


The Dogecoin (DOGE) price trades inside a short-term neutral pattern but shows long-term bullish signs.
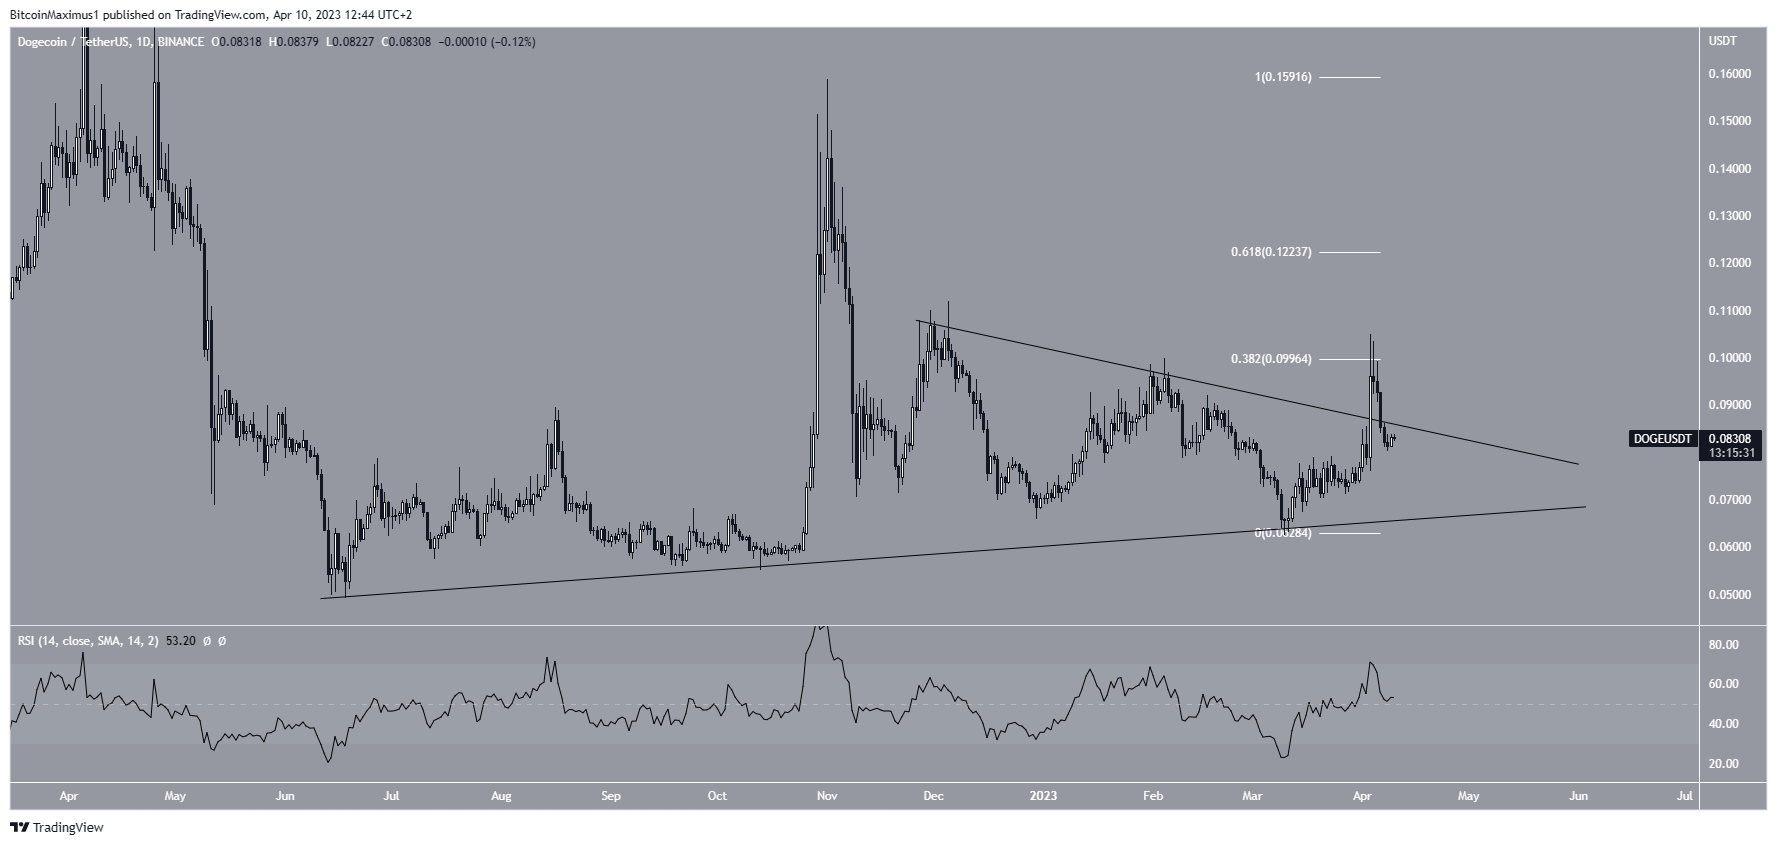
The DOGE price has increased alongside an ascending support line since June 2022. Since November of the same year, the price created a descending resistance line. Combined, these lines create a symmetrical triangle, which is considered a neutral pattern.
On April 3, the price broke out from the triangle and reached a high of $0.105. However, it was rejected by the 0.382 Fib retracement resistance level (white) and fell sharply over the next 24 hours. On April 7, the Dogecoin price fell back inside the confines of the triangle, suggesting that the previous breakout was illegitimate. However, the daily RSI is still above 50, a sign of a bullish trend.
As a result, it is possible that another breakout may eventually ensue.
A potential reason for the rejection was the fact that Tesla CEO Elon Musk reverted the Twitter logo back to its previous bluebird after its previous substitution to the internet meme coin.
Long-Term Outlook Supports Dogecoin (DOGE) Price Increase
While the technical analysis from the daily time frame does not provide a clear direction for the trend, the weekly one is bullish.
The main reason for this is the breakout from a 539-day descending resistance line. Breakouts from such long-term structures usually lead to significant increases.
Even though DOGE created a long upper wick last week (red icon), the weekly RSI is still above 50. Therefore, another attempt at reaching the $0.128 resistance area is expected.
If a breakout from it occurs, the DOGE price can increase to $0.275. However, if the decrease continues, DOGE could drop to the $0.055 horizontal support area.
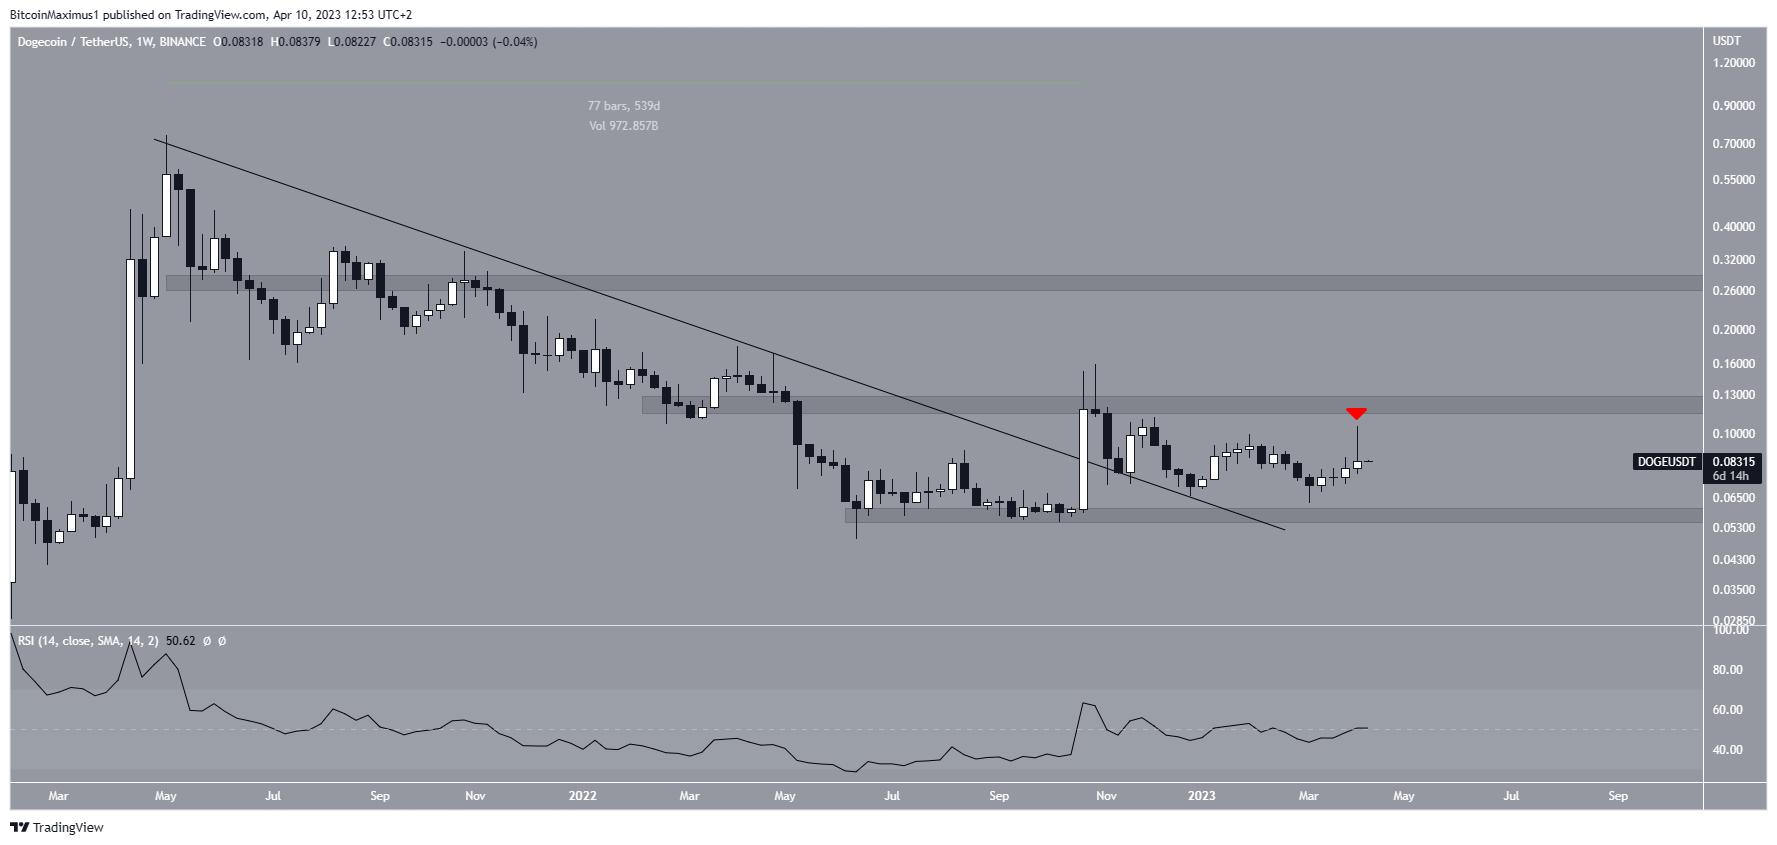
To conclude, the most likely DOGE price forecast is an eventual breakout from the short-term pattern and an increase toward the long-term $0.128.
For BeInCrypto’s latest crypto market analysis, click here.



