


On Apr 4, 2019, the price of Dogecoin (DOGE) reached a high of $0.0041. It has been gradually decreasing since, reaching lows of $0.0027.
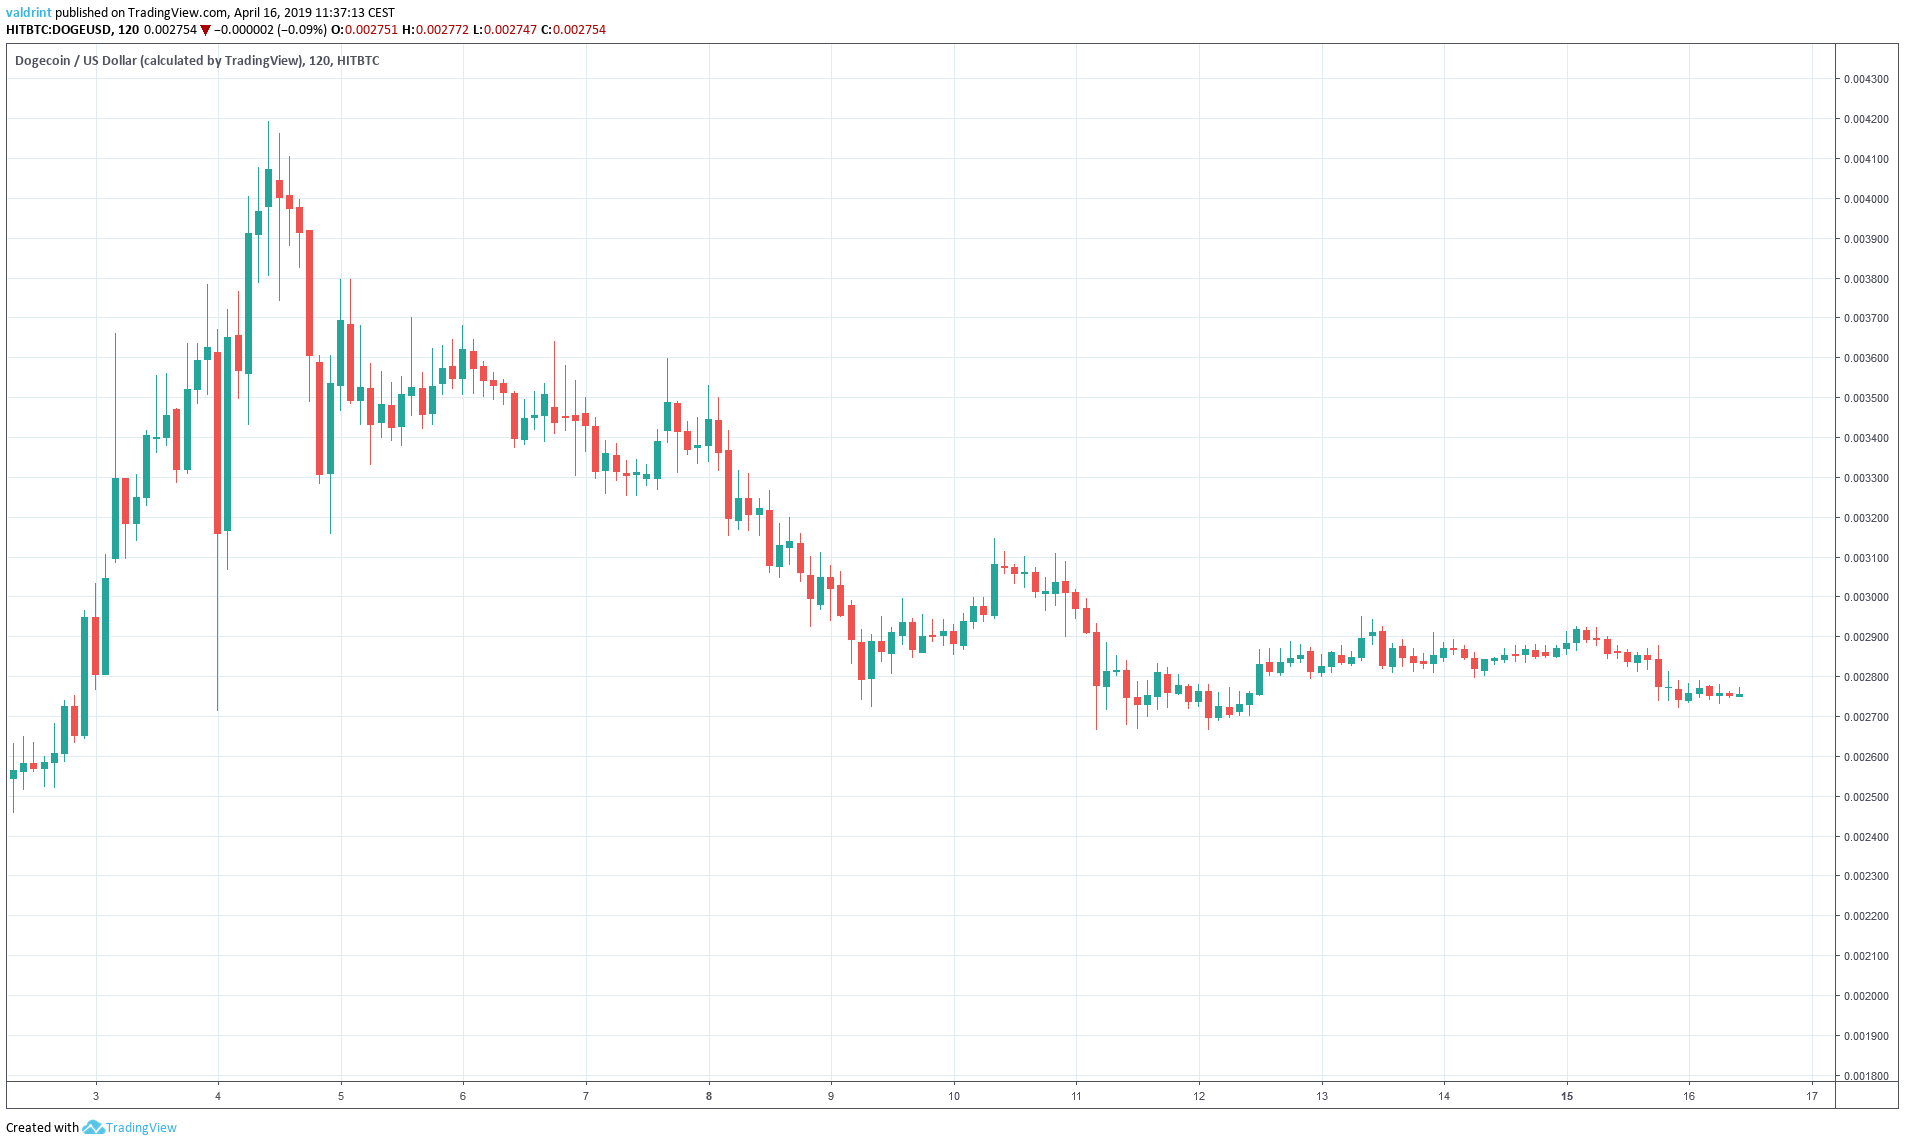
Will prices continue dropping or can we expect a reversal to bring new highs?
Let’s find out!
Dogecoin (DOGE): Key Trends And Highlights For April 16, 2019
- The price of DOGE/USD began an uptrend on Apr 1.
- Dogecoin reached a high on Apr 4.
- It broke out from a descending wedge on Apr 13.
- Slight bullish divergence is developing in the RSI and the MACD.
- There is resistance near $0.0036 and $0.0030.
Descending Wedge
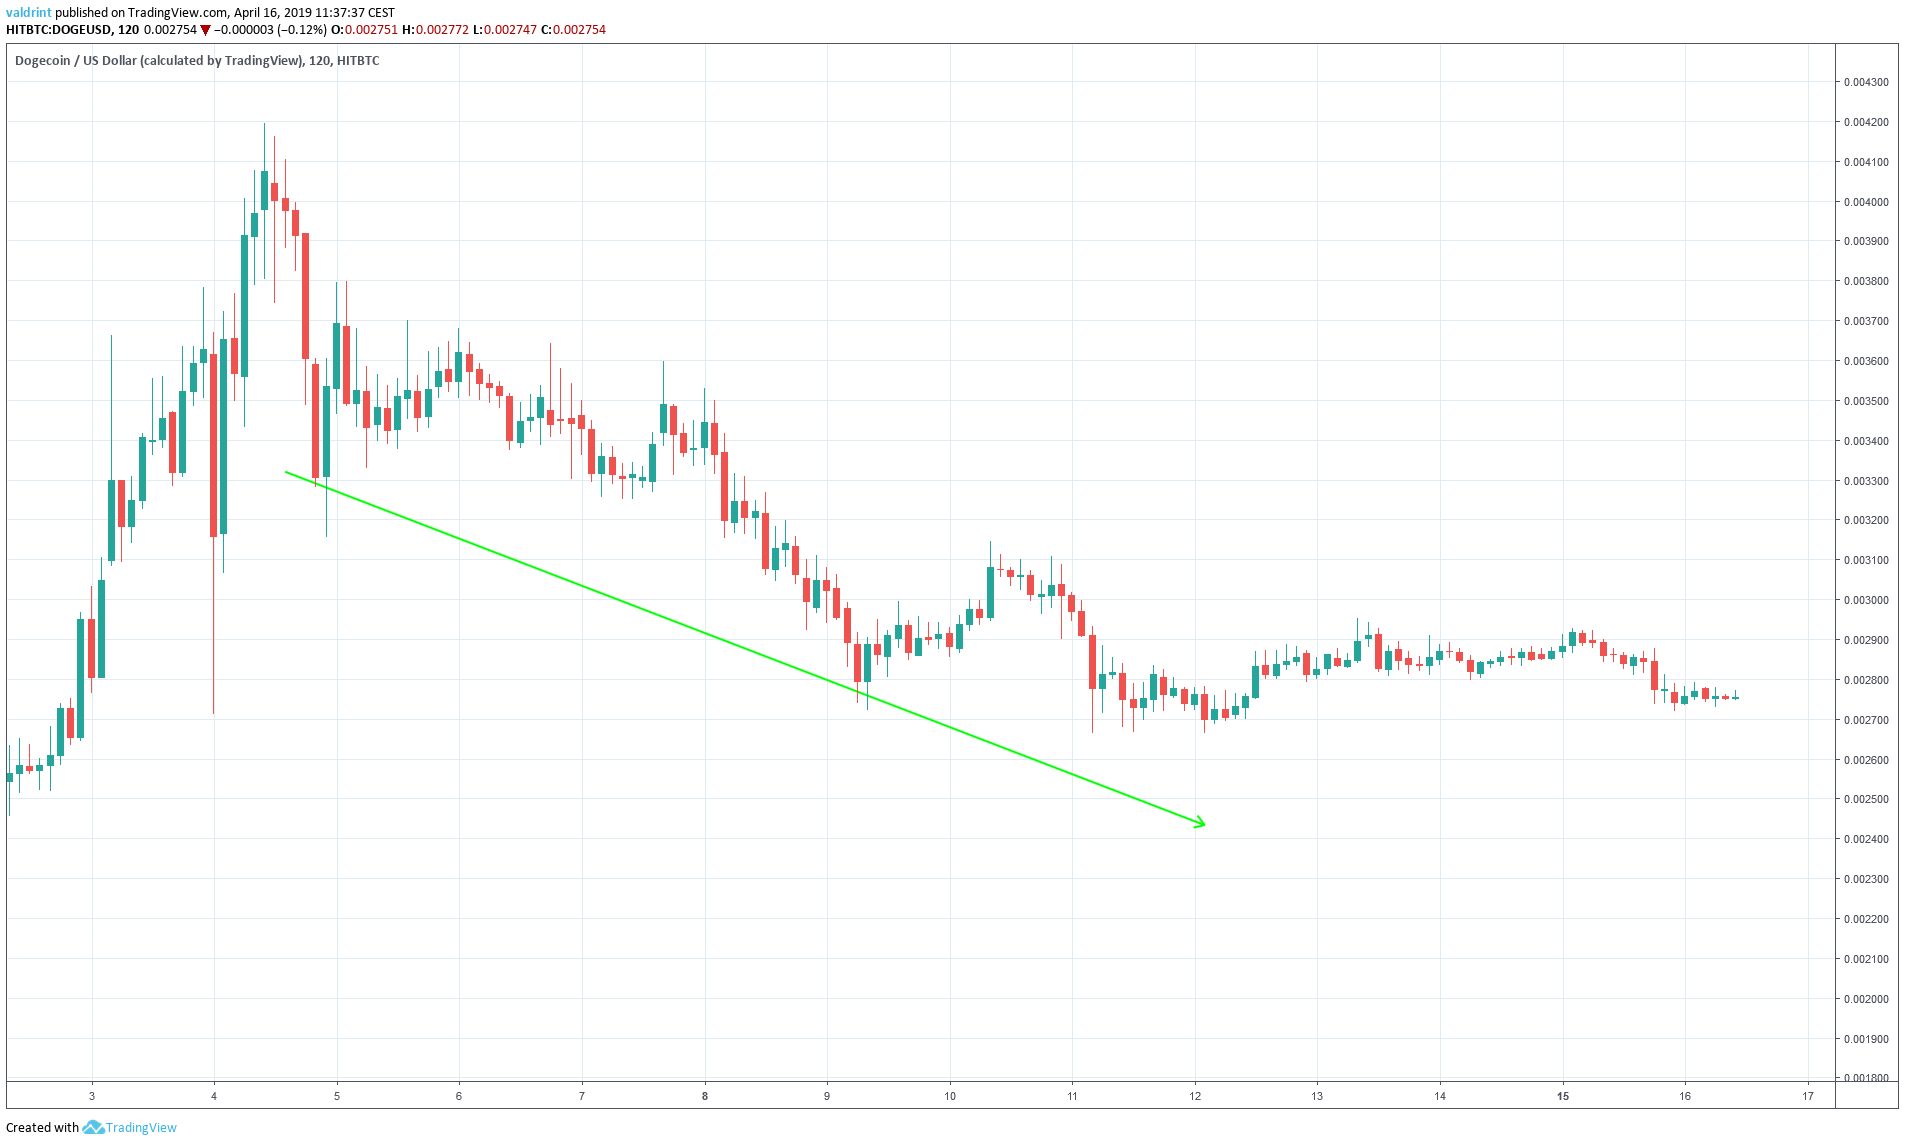
On Apr 4, the price made a low of $0.0031. A gradual increase was followed by a decrease. The price made a lower low on Apr 9.
Tracing these lows gives us a descending support line:
On Apr 4, the price made a low of $0.0041. Since then, several market cycles have been completed with each high being lower than the previous one.
Tracing these highs gives us a descending resistance line:
The support and resistance lines combine to create a descending wedge:
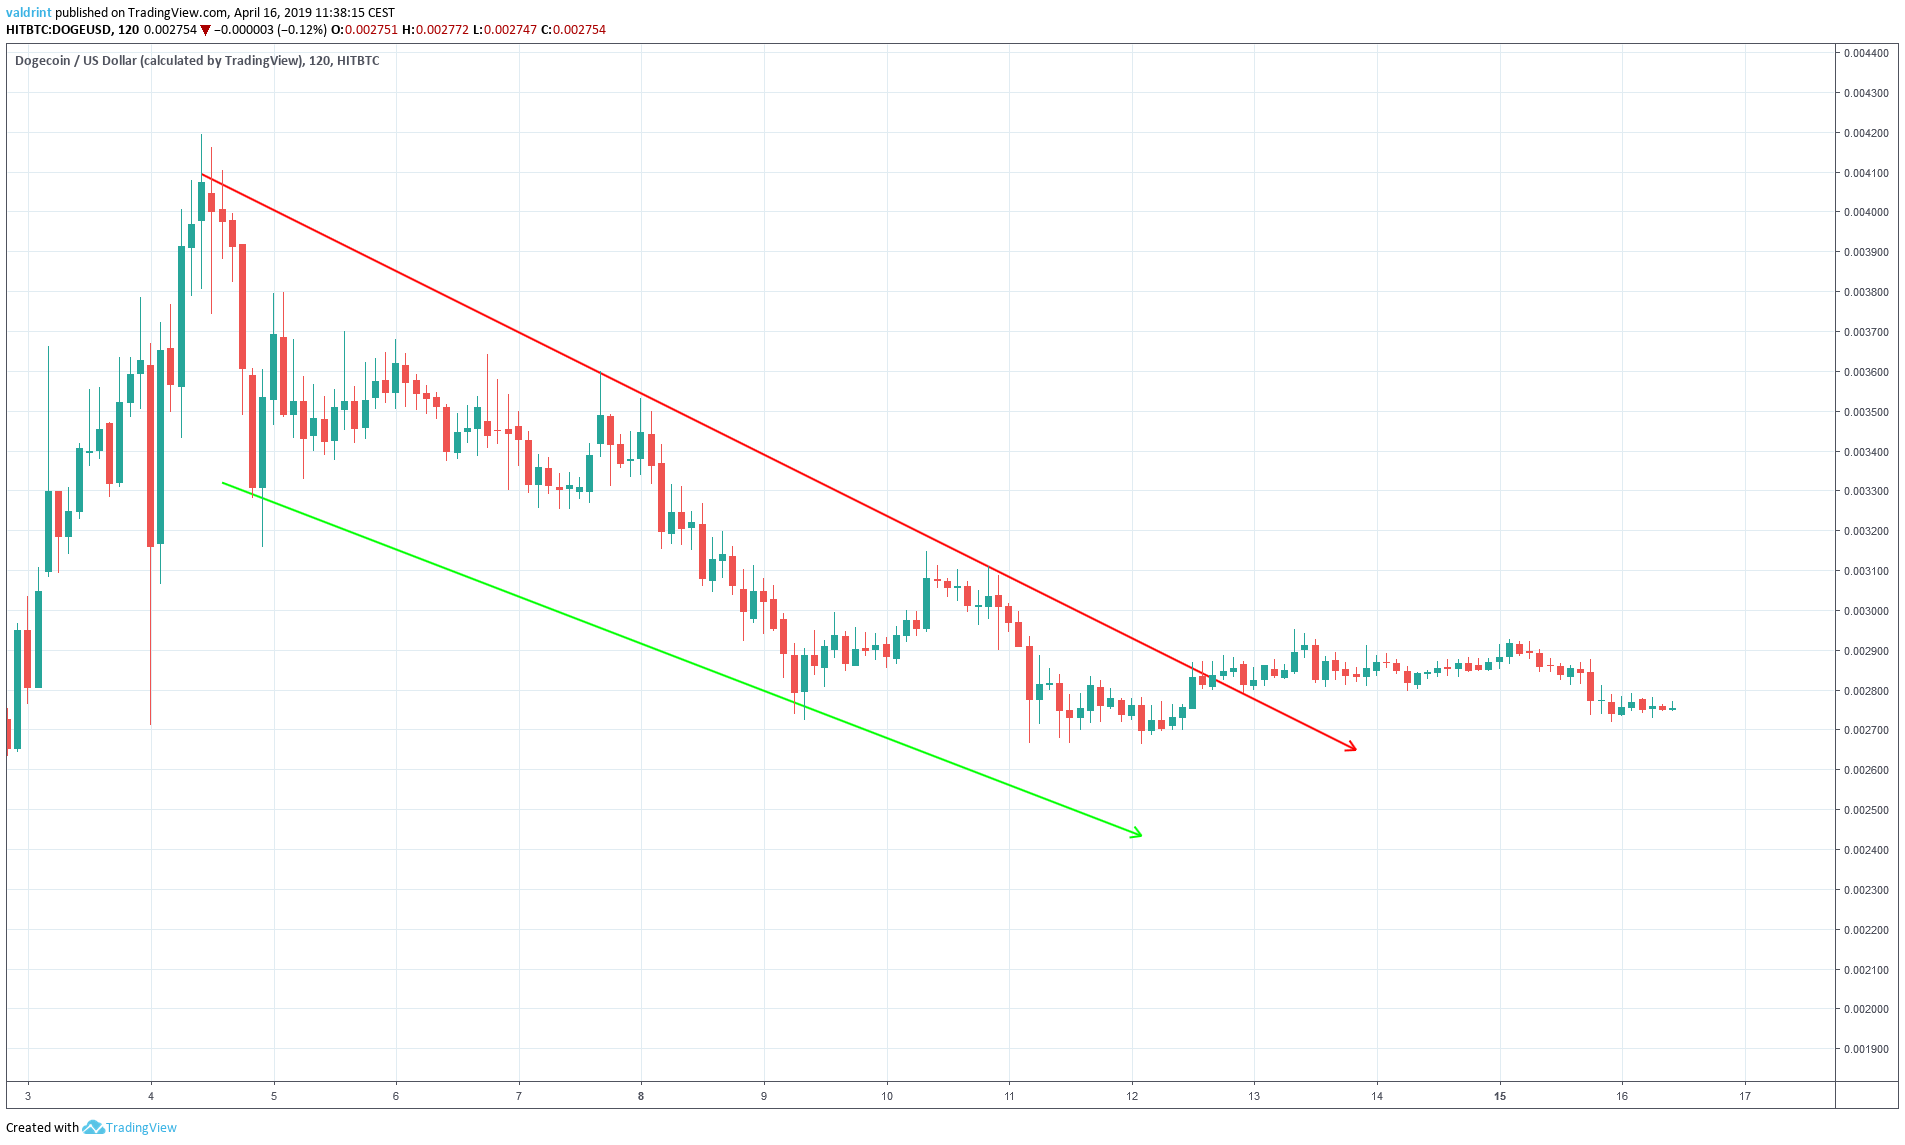
The price broke out from the wedge on April 13.
Where will it go next?
In order to answer that question, we need to take a look at some technical indicators.
Technical Indicators
We begin with the MACD and RSI.
The moving average convergence divergence (MACD) is a trend indicator that shows the relationship between two moving averages (long and short-term) and the price. It is used to measure the strength of a move.
Combining MACD and RSI bullish/bearish divergence with support/resistance essentially predicts price fluctuations.
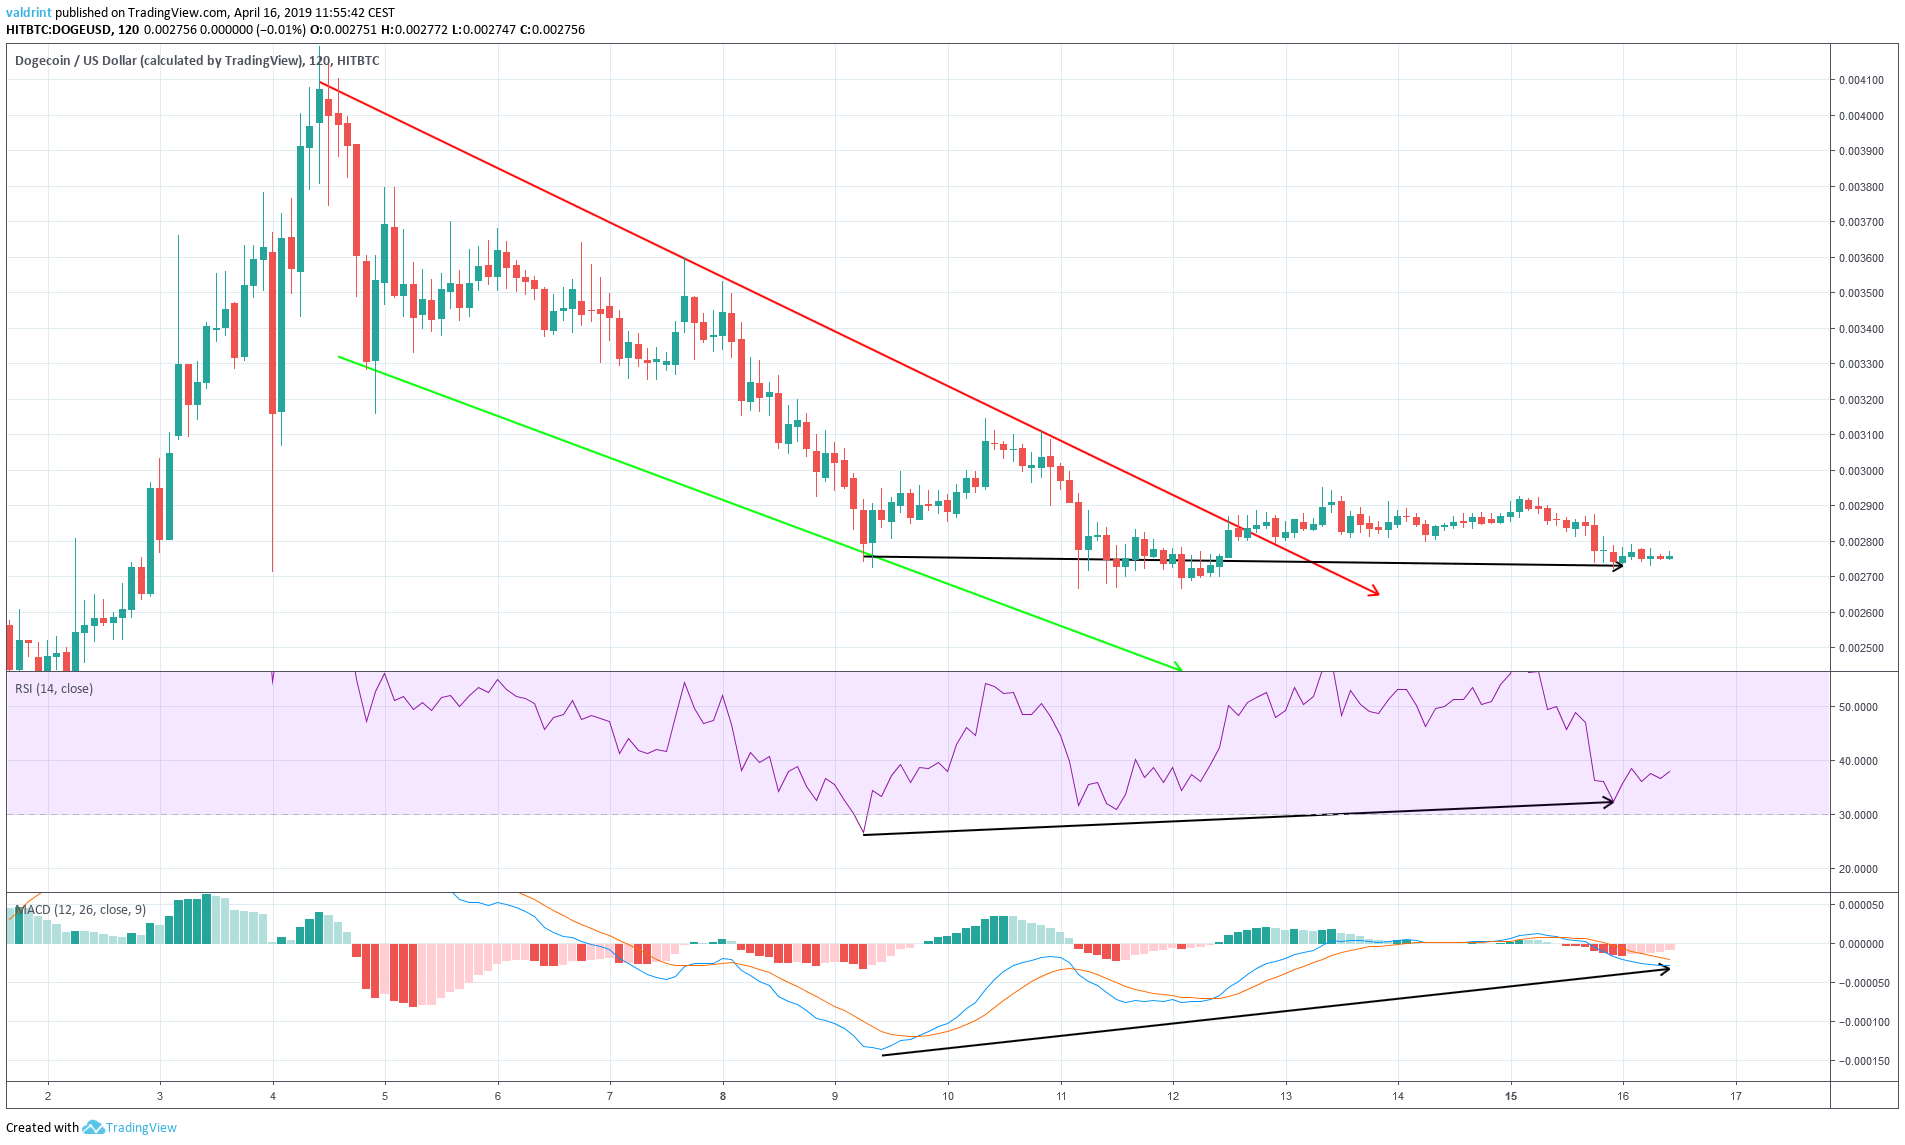
Similarly, the RSI and the MACD reached the first low on Apr 9. However, they have proceeded to generate higher values.
This is known as bullish divergence and often precedes price increases.
The level of divergence is not very significant. However, we believe it gains validity since it is occurring after the breakout from a bullish pattern.
Using these indicators, we believe that the price of DOGE will increase in the future. However, the increase may be slow.
Possible Reversal
To determine future areas of reversal, we incorporate resistance areas into the analysis.
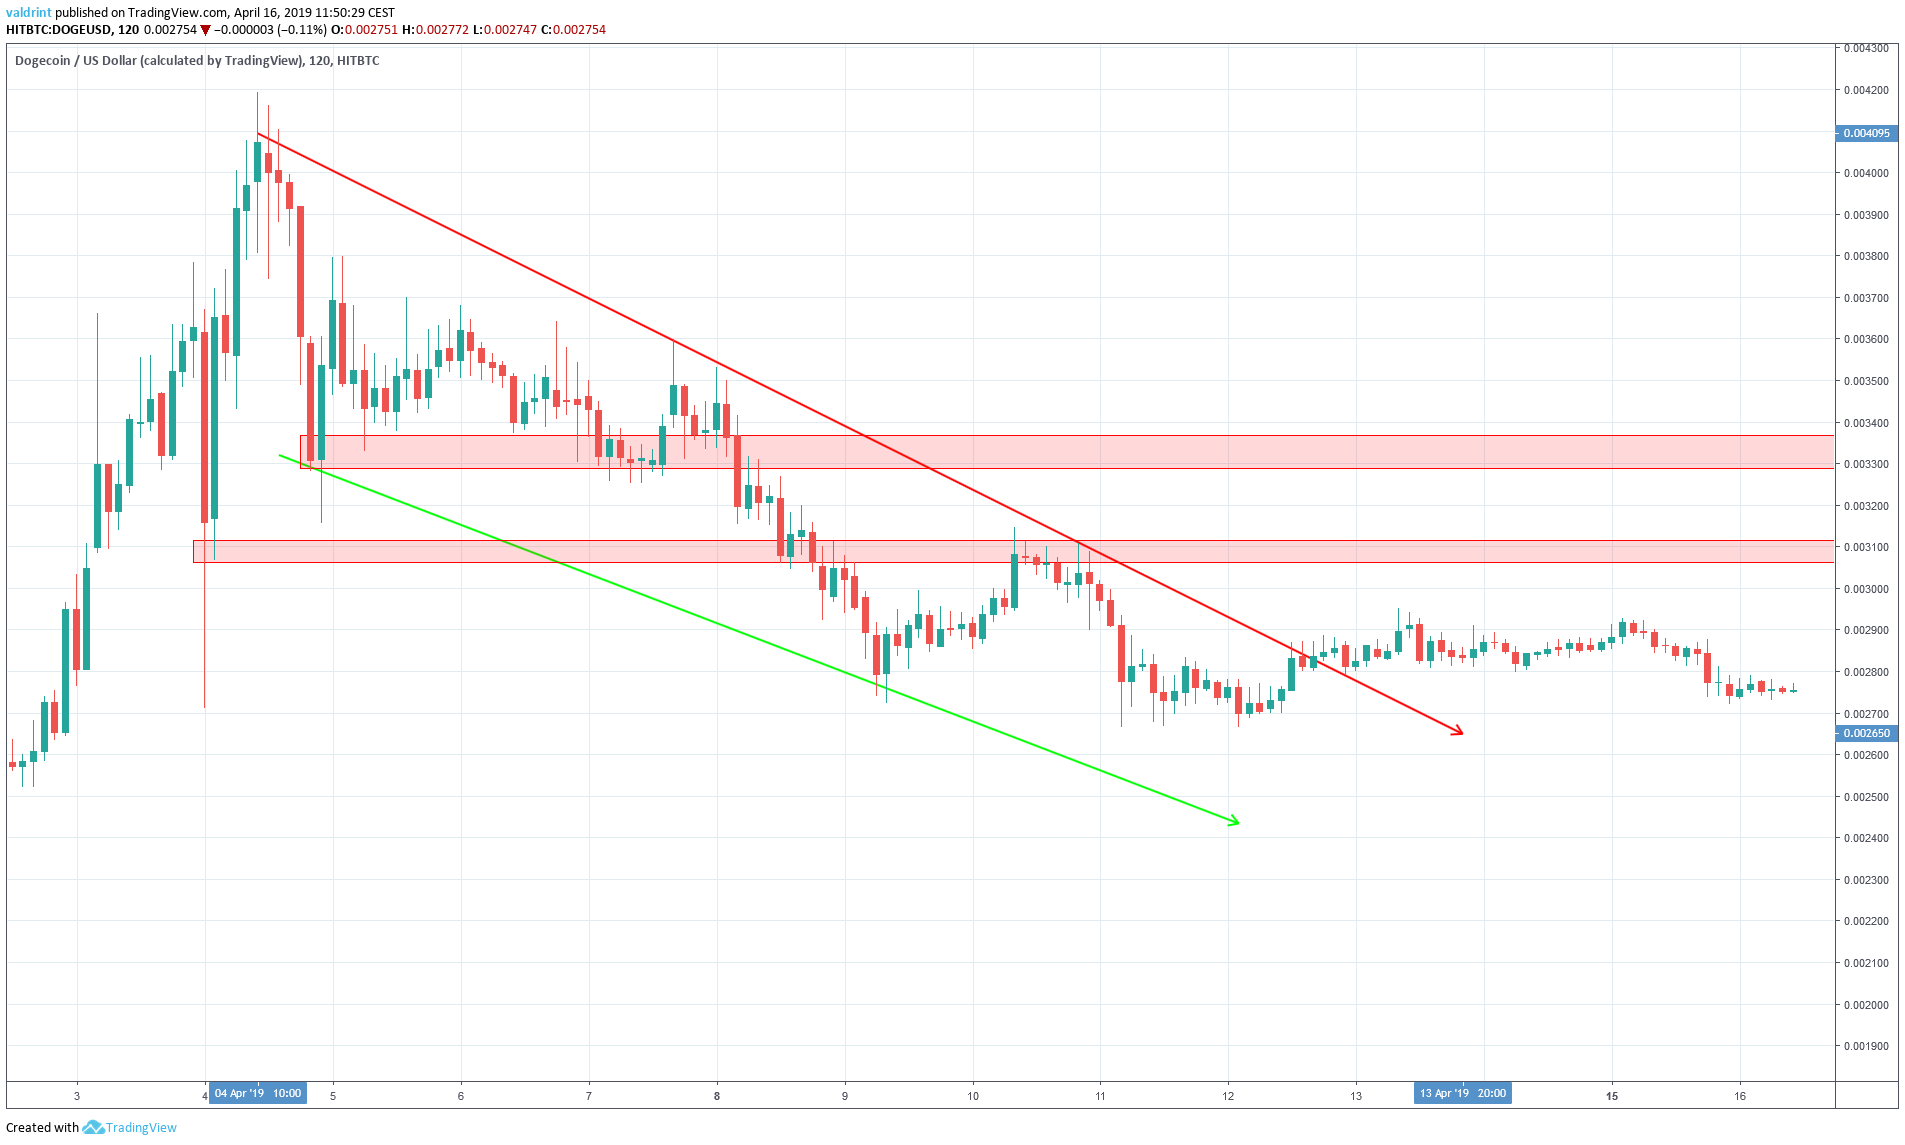
The closest resistance area is found near $0.0030. The second one is found near $0.0036. We believe that the price will reach at least one of these areas.
Summary of Analysis
Based on our analysis, the price of DOGE is likely to increase toward the resistance areas outlined above.
Do you think Dogecoin will initiate an upward move? Let us know your thoughts in the comments below!
For long-term price predictions of DOGE/USD, click on the green button below:
Disclaimer: This article is not trading advice and should not be construed as such. Always consult a trained financial professional before investing in cryptocurrencies, as the market is particularly volatile.


