


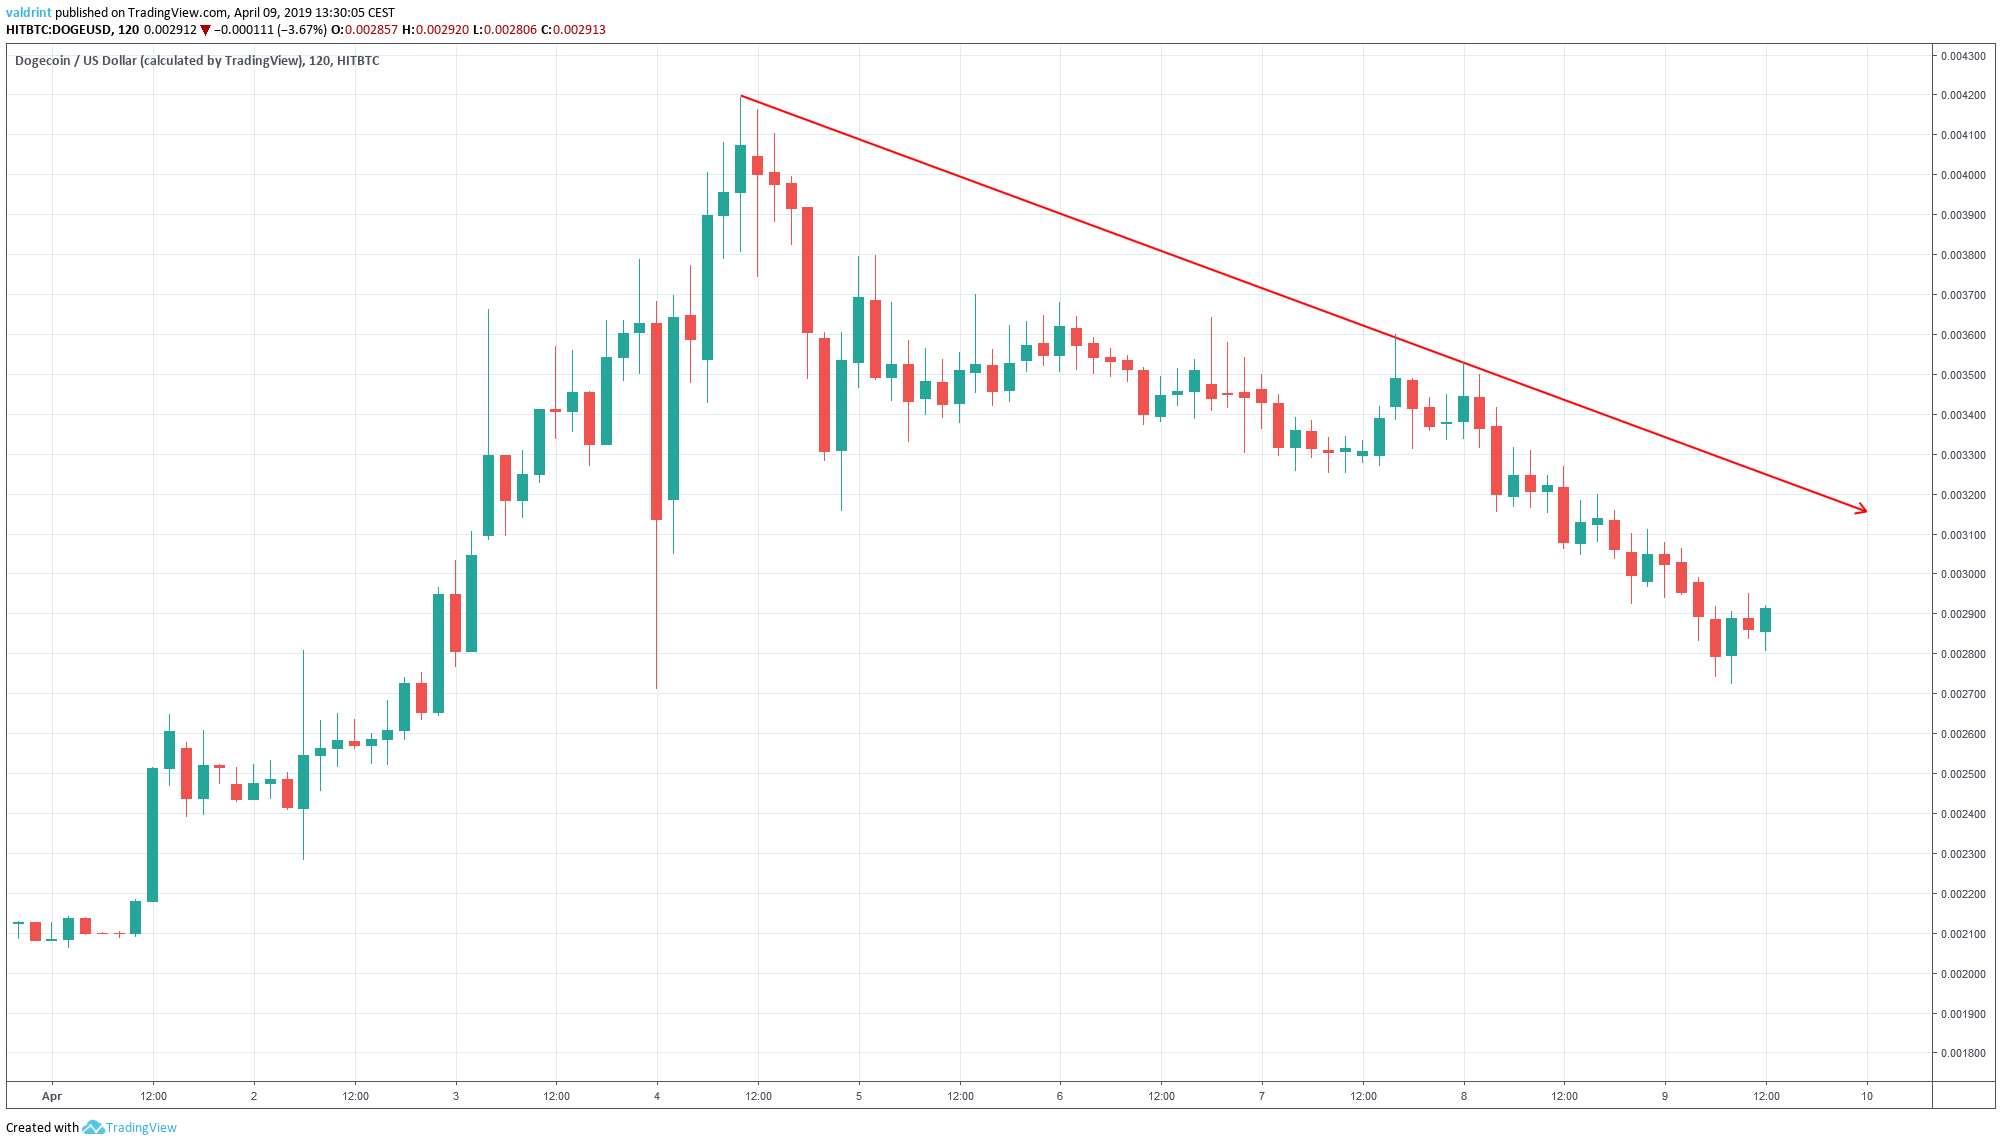
On Apr 1, 2019, the price of Dogecoin (DOGE) began an upward move. It reached a high of $0.0041 on Apr 4. It has been gradually decreasing since.
What will happen next? Keep reading in order to find out.
Dogecoin (DOGE): Key Trends And Highlights For April 9
- The price of DOGE/USD began an uptrend on Apr 1.
- Dogecoin reached a high on Apr 4 but has been on a downtrend since.
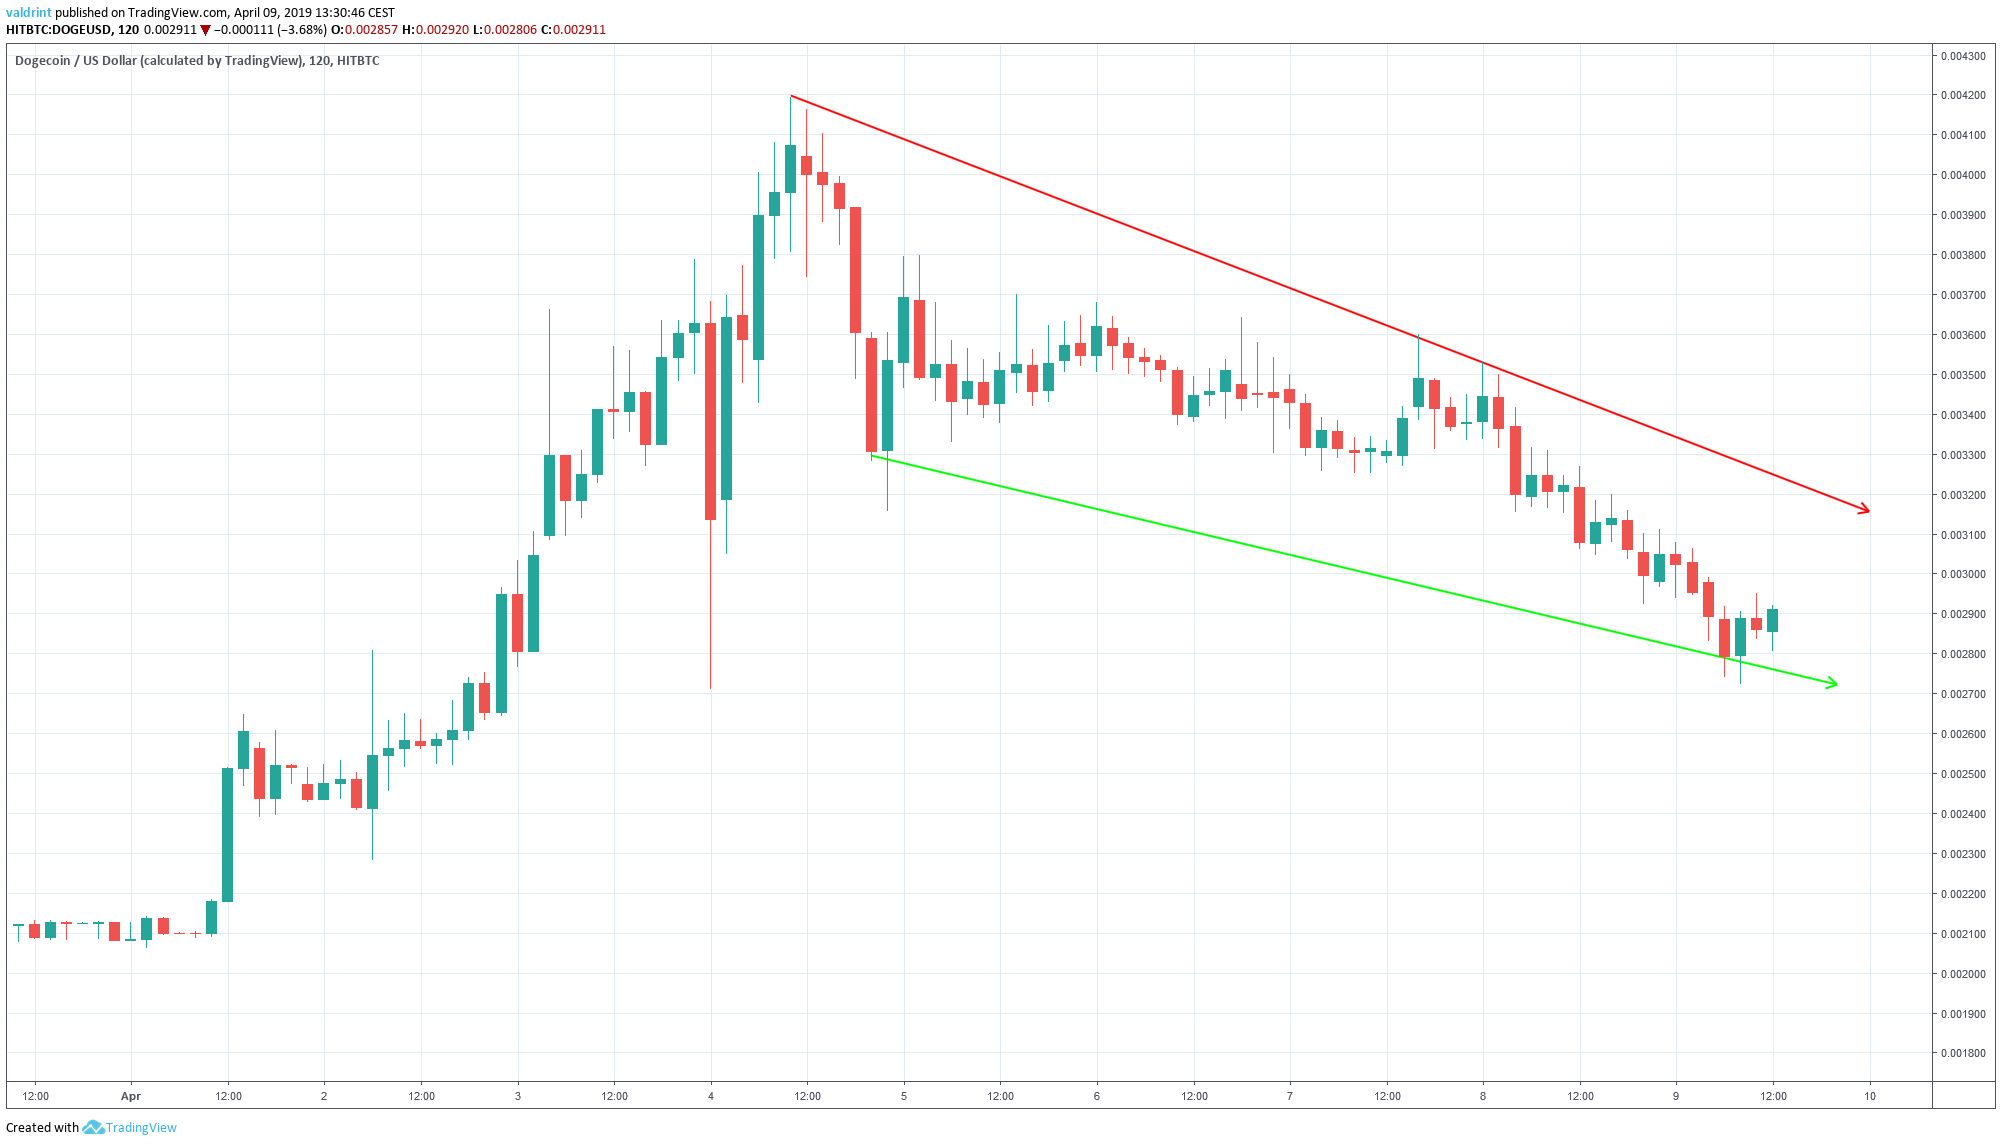
- It is now trading inside a descending wedge.
- There is support near $0.0026 and resistance near $0.0036
Descending Wedge
On Apr 4, the price made a low of $0.0041. Since then, several market cycles have been completed with each high being lower than the previous one.
Tracing these highs gives us a descending resistance line:
On Apr 4, the price made a high low of $0.0031. A gradual increase was followed by a decrease. The price made a lower low on Apr 9.
Tracing these lows gives us a descending support line. However, the line has only been touched twice, therefore it is possible that the price will create different levels of support.
The support and resistance lines combine to create a descending wedge. This is a bullish pattern. It suggests price increases and a possible breakout as more likely than price losses or a breakdown.
In order to figure out the direction of the move, we need to take a look at previous movements alongside technical indicators.
Moving Averages
In order to better assess future price fluctuations, we incorporate moving averages into our analysis. Furthermore, we analyze DOGE/USD at one-day intervals from Dec 2018 to Apr 2019 alongside the 200-day moving average.
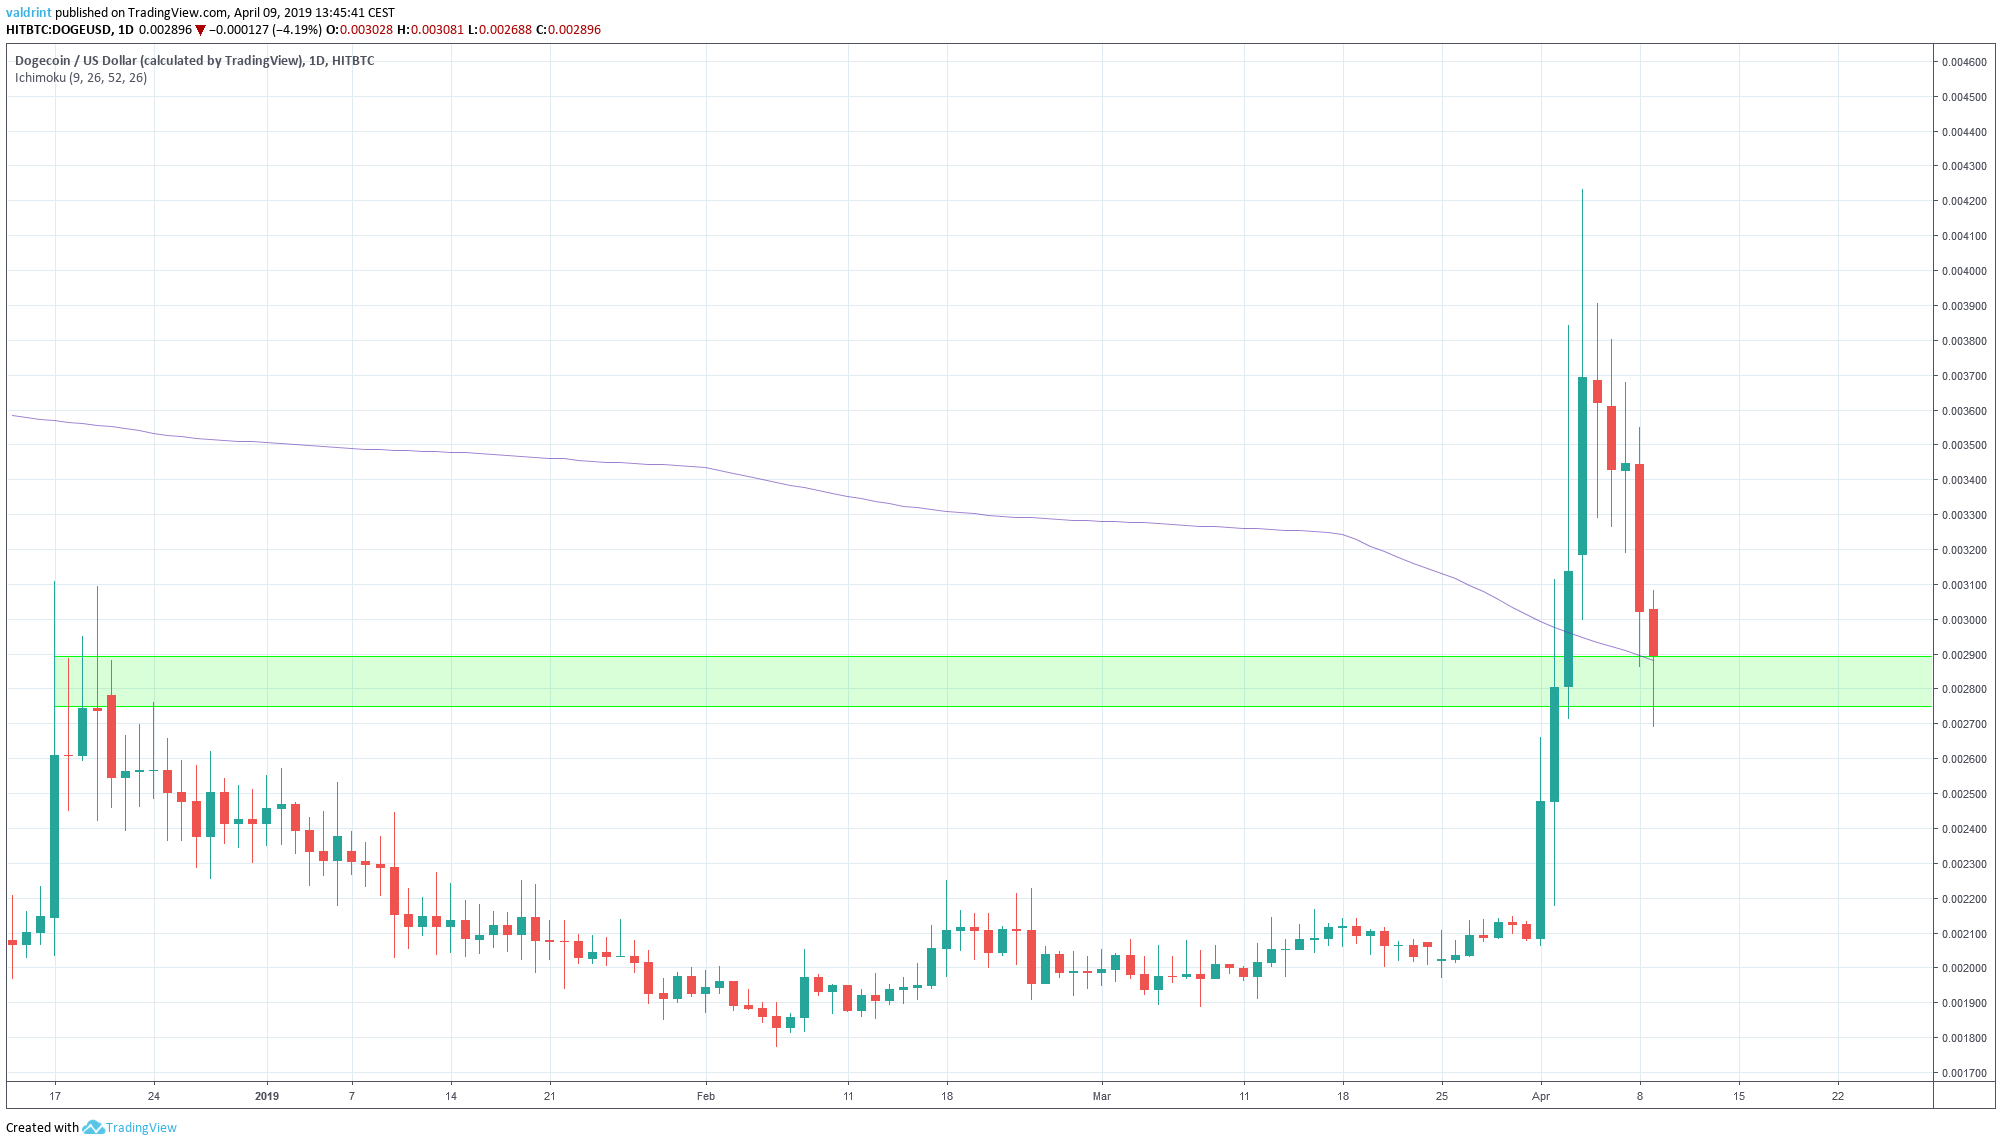
On Apr 3, the price moved above the 200-day moving average.On Apr 9, it decreased below it for a short period of time, before rebounding and finding support above it.
Furthermore, the moving average coincides with the $0.0026 support area created by the highs of Dec 2018.
Therefore, we believe that this is a very significant support area that is not likely to be broken in such a short period of time.
Possible Reversal

The closest support area is found near $0.0026. If the price keeps decreasing at the rate predicted by the wedge, it will reach this area again during the upcoming days. We do not believe that the price will decrease below this area.
The closest resistance area is found near $0.0036. If the price were to break out from the wedge, it would provide a likely reversal area.
Summary of Analysis
Based on our analysis, the price of DOGE is likely to keep trading inside the wedge and possibly break out. We do not believe that the price will drop below $0.0026
Do you think Dogecoin will breakdown below the support? Let us know your thoughts in the comments below!
LEARN ABOUT 0 commision BTC INVESTING HERE!
Disclaimer: This article is not trading advice and should not be construed as such. Always consult a trained financial professional before investing in cryptocurrencies, as the market is particularly volatile.


