


On July 26, the Bitcoin dominance rate (BTCD) reached a long-term support area at 62.50% and initiated a rapid bounce that is still ongoing. However, we cannot yet state with certainty that the trend is bullish.
BTCD Bounces at Long-Term Support
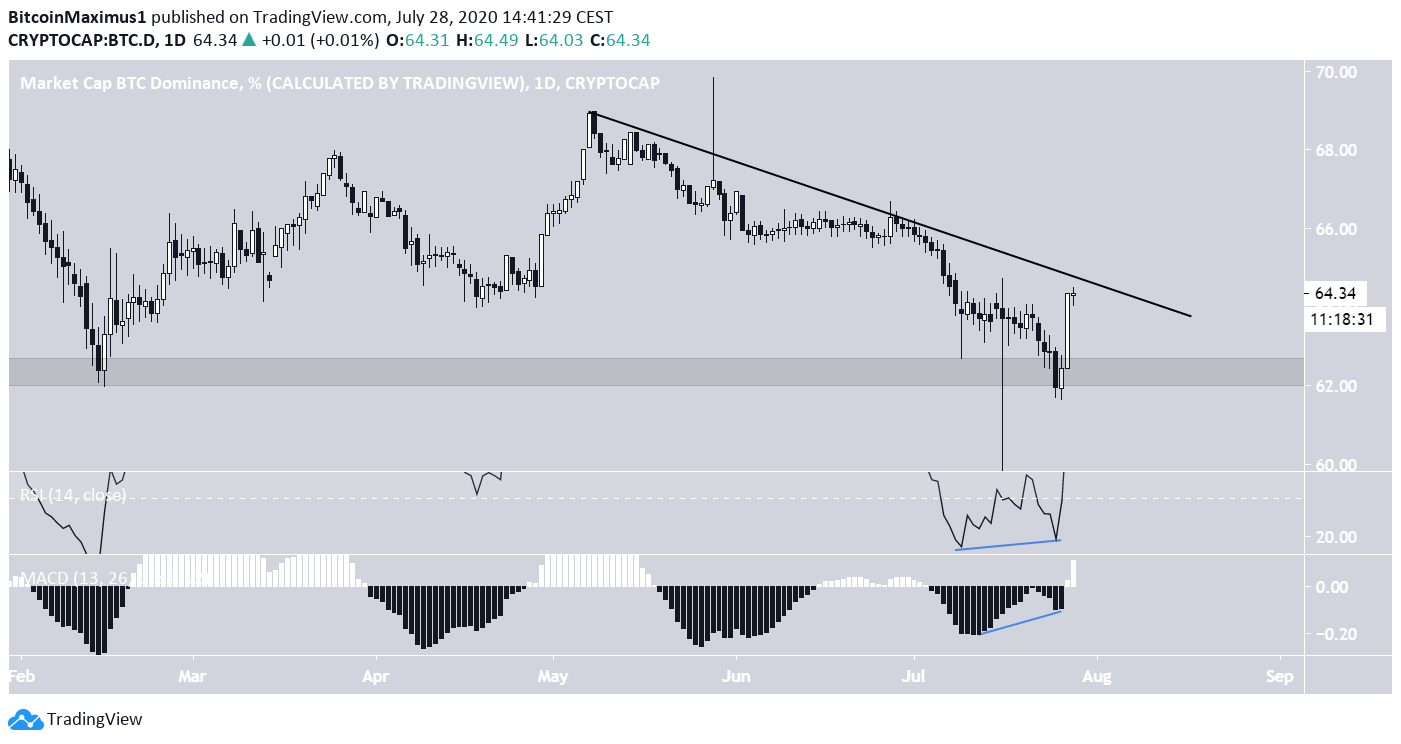
The Bitcoin dominance rate has been declining alongside a descending support line since it reached a high of 68.92% on May 7.
On July 26, the rate reached the 62.50% support area, which had previously initiated an upward move in the middle of February. Similarly, the rate initiated another upward move, creating a massive bullish engulfing candlestick the following day.
The rally was preceded by considerable bullish divergence on both the RSI & the MACD, increasing its legitimacy.
Cryptocurrency trader @anbessa100 believes that the Bitcoin dominance rate could continue to rally, reaching a high of 65,80%.
– BTC second 4h close $10888 could trigger a little continuation though
– in this case you would look for a target of 200MA at 65,80% as pointed out in the last update yesterday (cheaper altcoins)
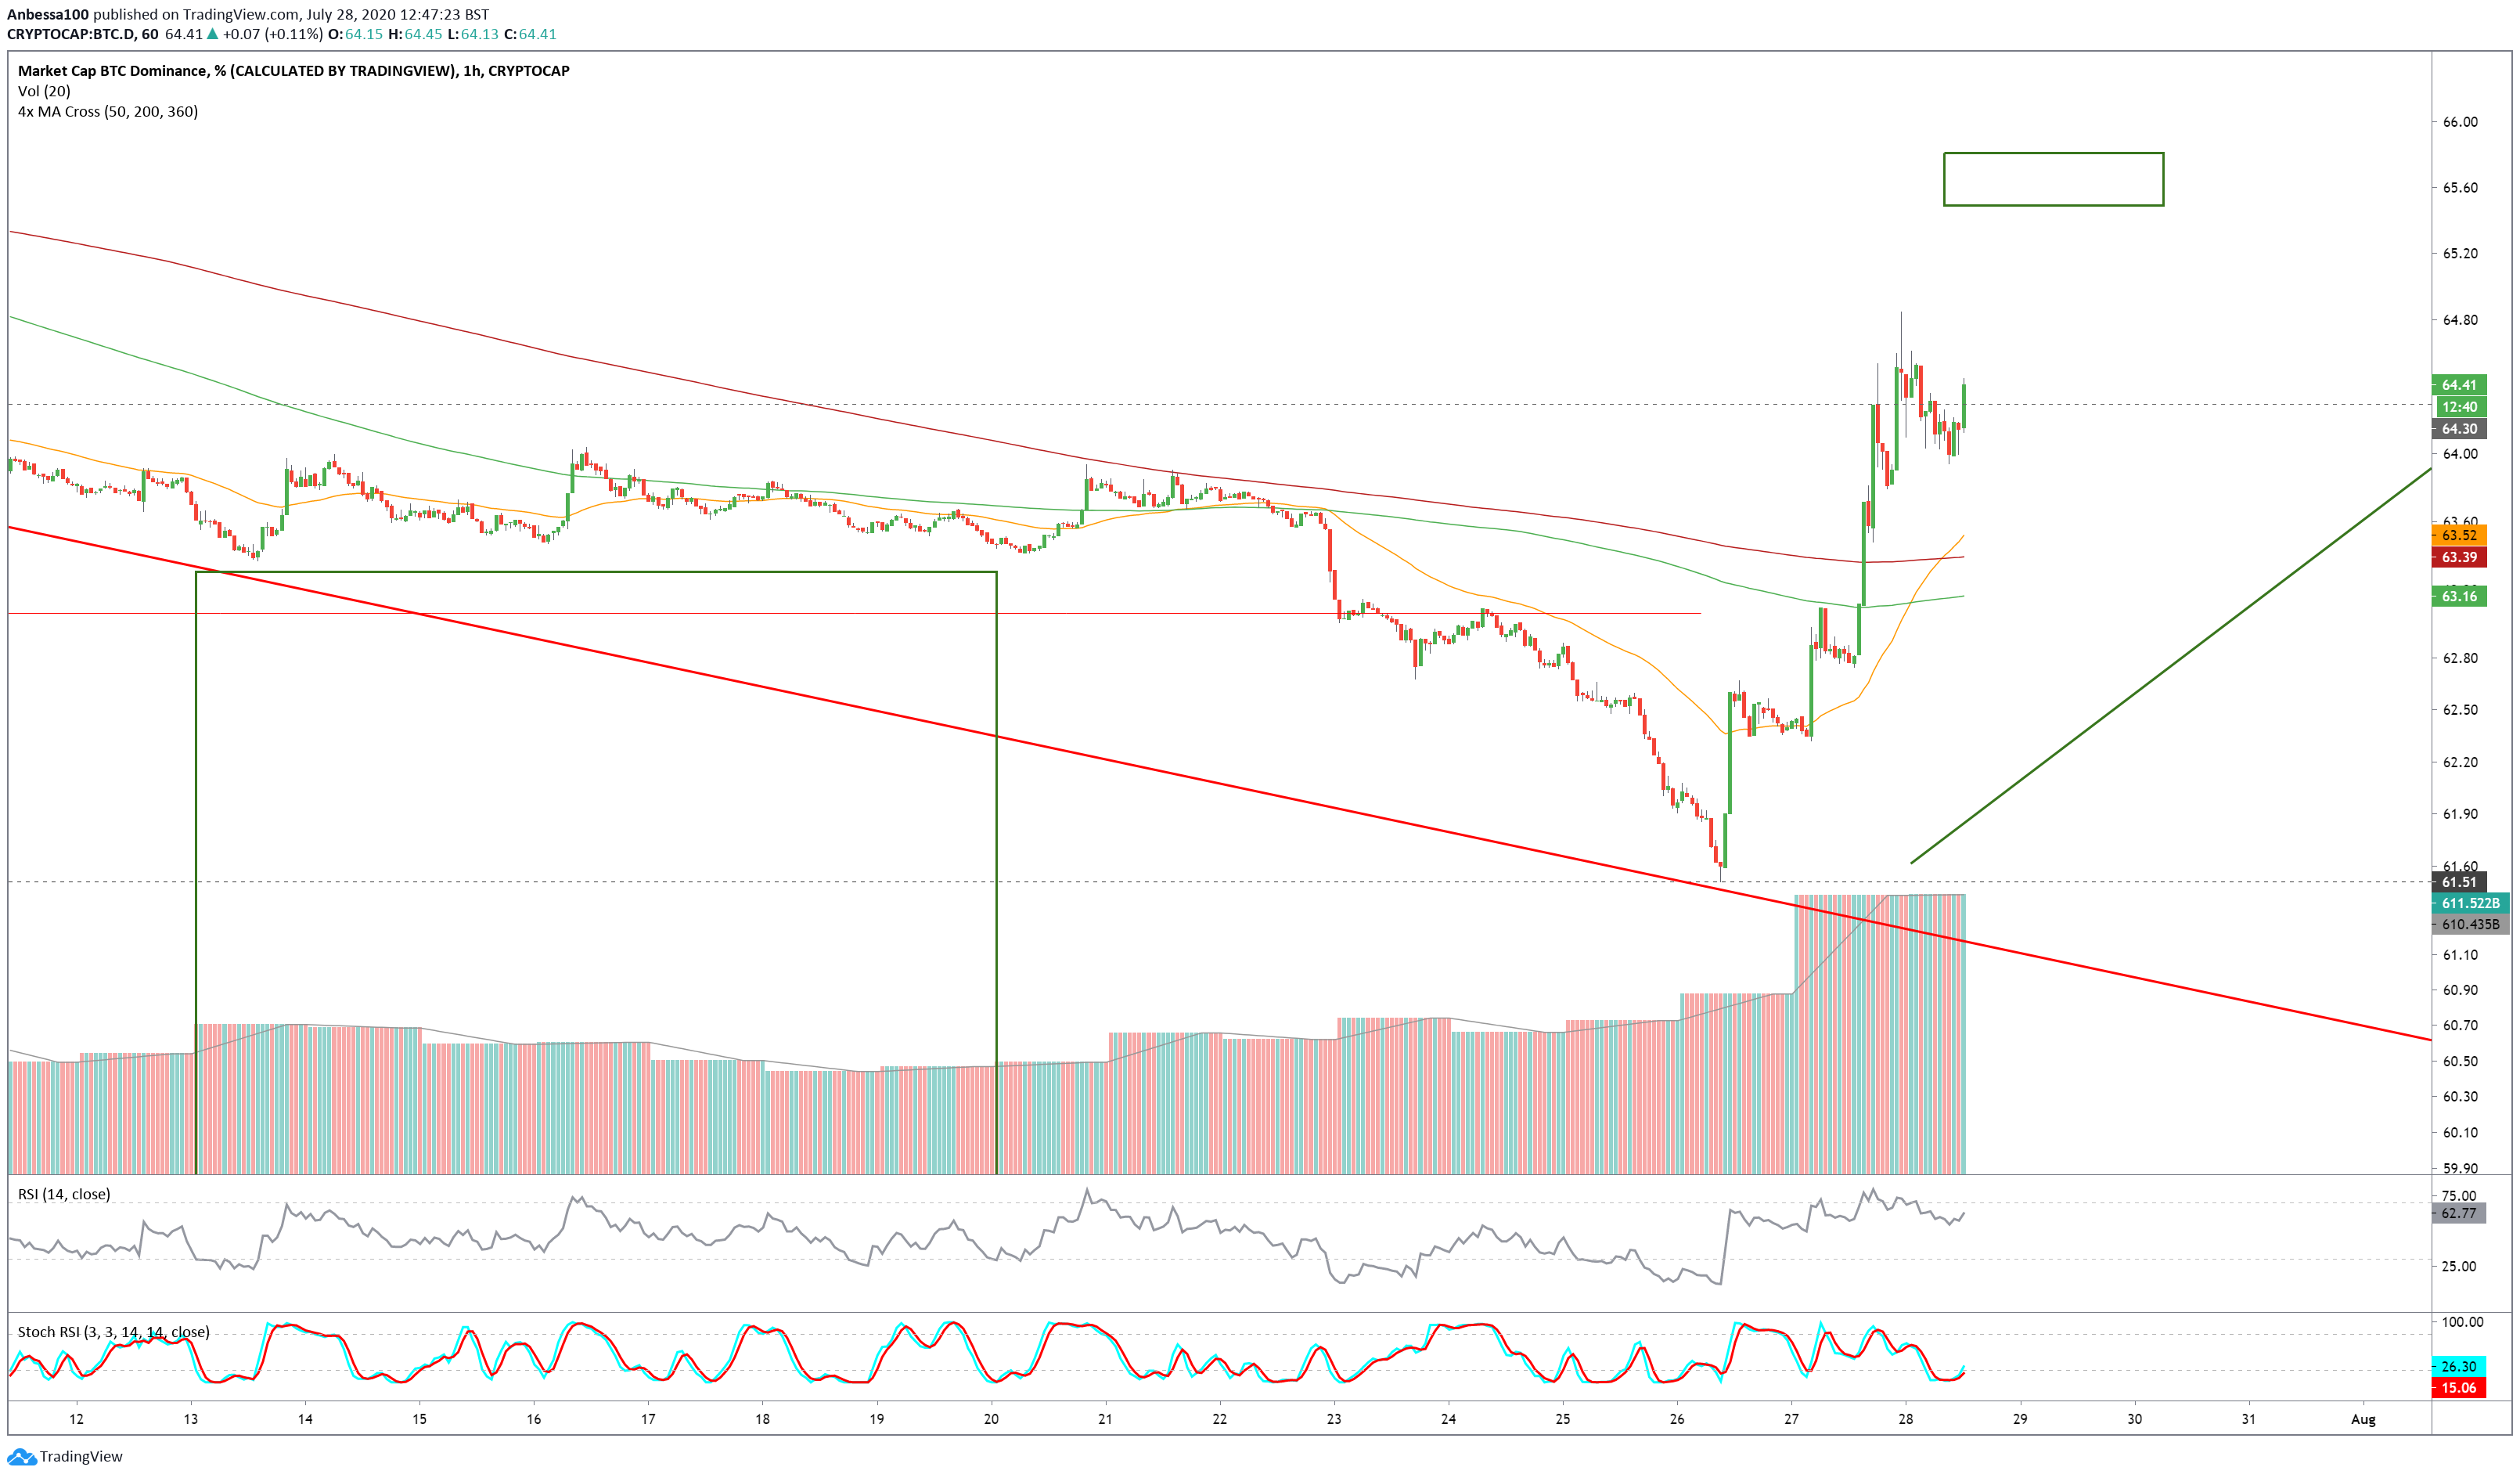
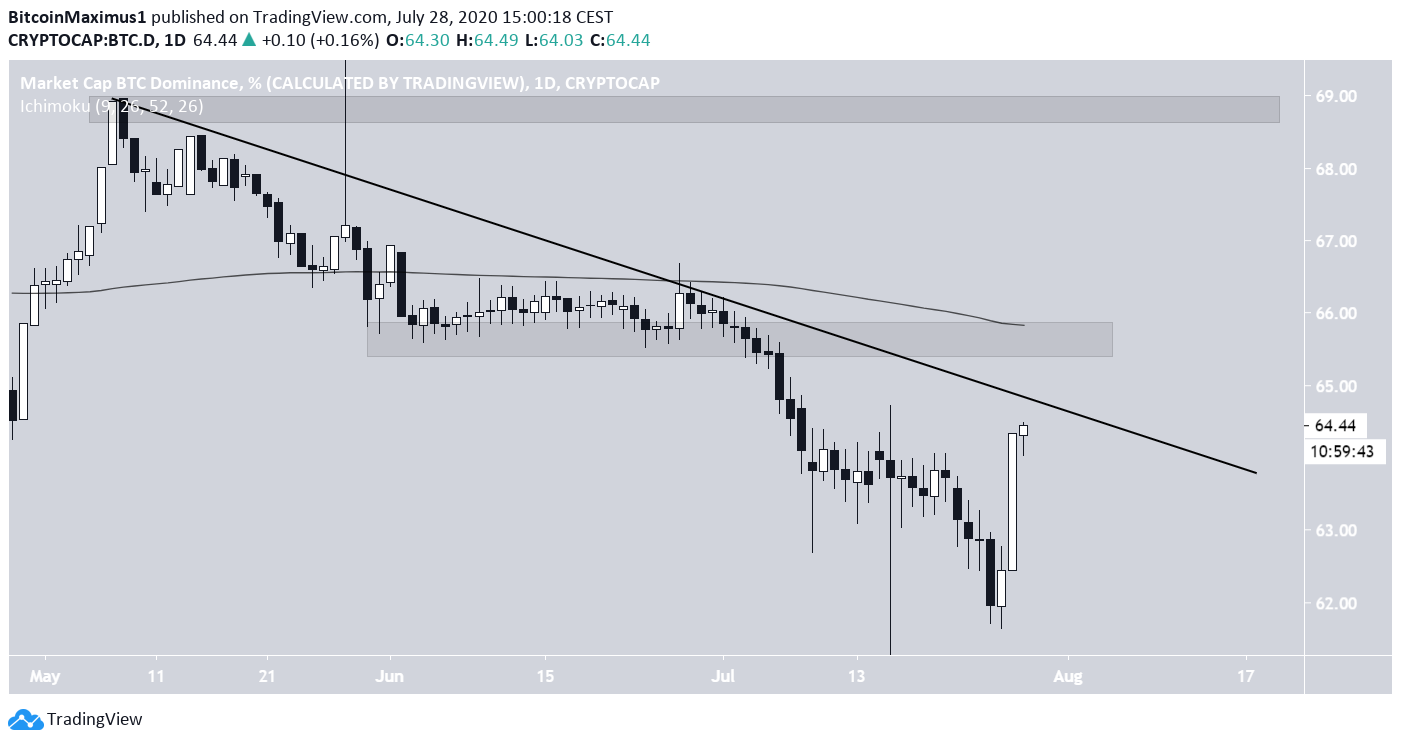
The 65.85% area is extremely important since it acted as support for the entire month of June. Therefore, it is likely to act as resistance in case the price reaches it again. In addition, it is strengthened by the presence of the 200-day moving average (MA).
However, this level is above the descending resistance line. So, it’s possible that the price will reach here with a long upper wick and then decline below the line.
However, until the price reaches a decisive close above the 65.85% level, the trend is not bullish.
Relationship to Bitcoin
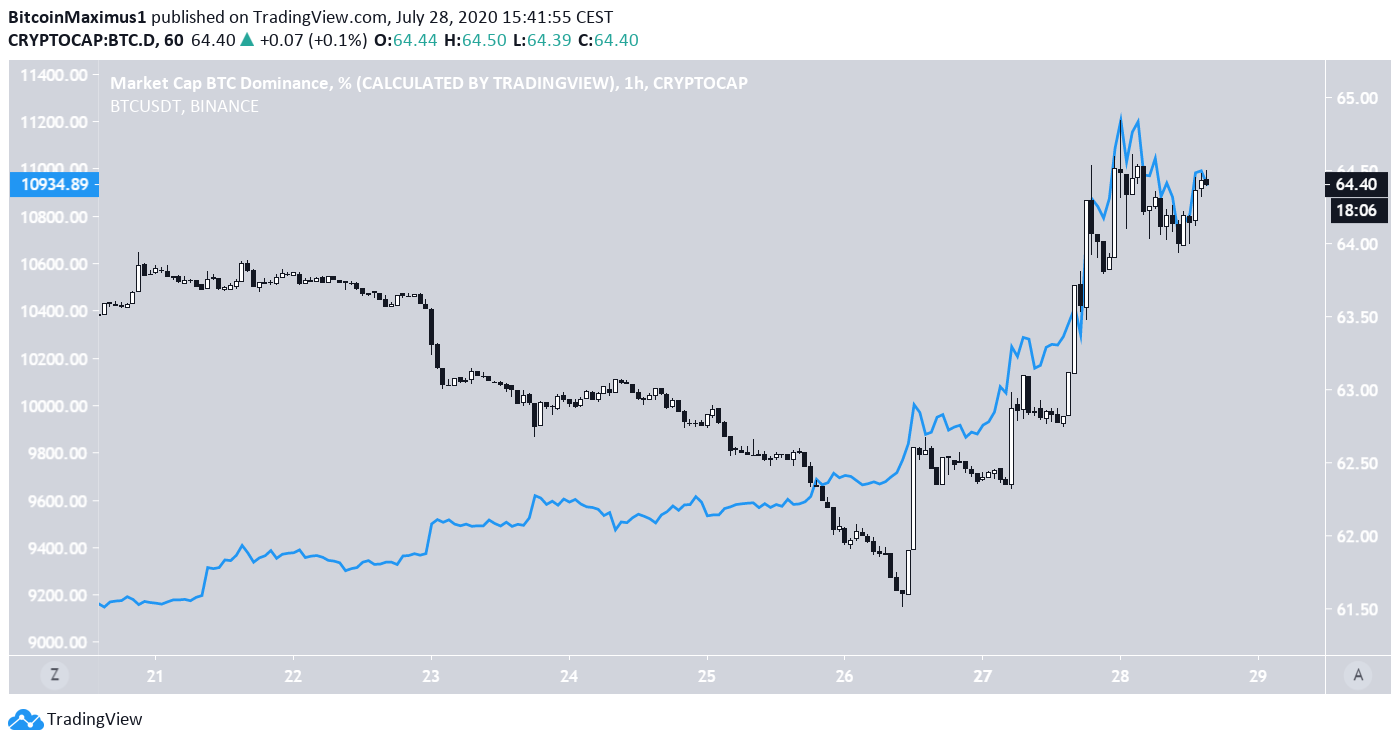
Since July 26, when BTC initiated a rapid upward move, the relationship between BTC and BTCD has been positive, and the two assets have perfectly mirrored each other. This ended a long period in which they were negatively correlated.
Therefore, if the same relationship continues to hold, BTC price increases would also cause BTCD to rise, and vice versa.
To conclude, while BTCD has initiated a very strong bounce, the trend is not bullish until the rate reaches a close above the 65.85% resistance area.


