


In the early hours of April 16, the BTC price began a rapid downward move, taking it to a low of $6,468. However, it immediately bounced back upwards and reclaimed the recently lost $6,700 support level.
Bitcoin’s Descending Channel
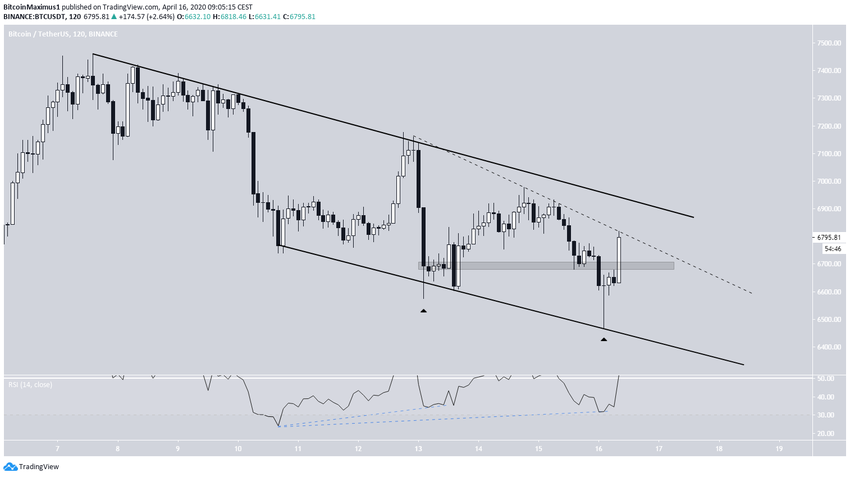
The BTC price decreased considerably on April 16, at one point reaching a low of $6468. This created a very long lower wick that was quickly bought up. However, we can use the wick to change the slope of the descending support line, and that now gives us a descending channel instead of a descending, broadening wedge. However, the bullish divergence is not as pronounced as when the price previously generated a similarly long lower wick.
On a bullish note, besides the considerably long lower wicks, there is another potential descending resistance line (dashed) that the price is following, which would create a descending wedge. This is a bullish reversal pattern that often leads to a breakout.
Furthermore, the price has reclaimed the $6700 support area, making the movement below it a failed breakdown.
Trading Range
When looking at a slightly longer time-frame, we can see that the price is trading at a confluence of two resistances, both the descending one from the current channel and the horizontal one from the trading range., which is found at $6900.
Therefore, the expected movement from here would be a decrease that validates the confluence of the descending support line of the channel and the midpoint (EQ) of the range at $6300.

If the price were to increase, the most likely move would be an upwards to around $7,800, as it is the closest resistance area and would be a validation of the descending wedge the price has just broken down from.
However, the price is facing heavy resistance from the 25-day moving average (MA), further reducing the chances of a breakout. In addition, the RSI has just reached the 50-line from below, making this a likely place for the rally to end.

To conclude, the BTC price has reached the resistance line of both the channel and its trading range. The price is expected to decrease towards $6,300.
For those interested in BeInCrypto’s previous Bitcoin analysis, click here.


