


On April 13, the Bitcoin price reached a high of $7,140 but began a rapid decrease almost immediately afterward.
The price has been increasing since, but it has yet to move above significant resistance levels that would indicate a new upward trend. The current price movement looks more akin to a retracement in response to the prior decrease.
Bitcoin’s Descending Broadening Wedge
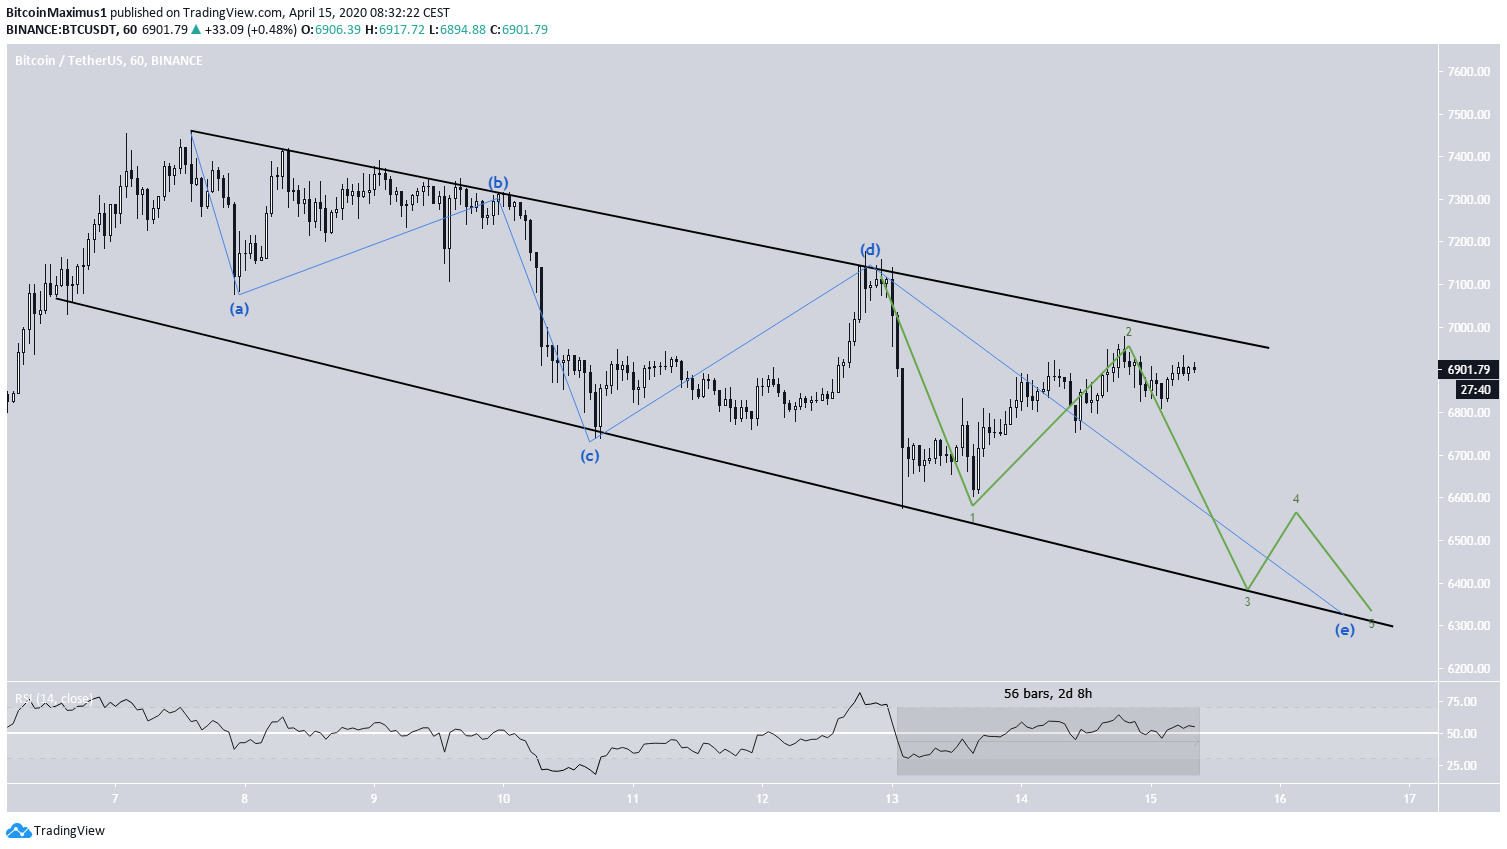
The Bitcoin price is following a descending resistance line and possibly trading inside a descending broadening wedge since April 6. At the time of publishing, the price was very close to the resistance line of the wedge.
The RSI has been freely moving above and below 50 for the past two days, a characteristic that is indicative of a price consolidation period. The direction of its next movement still remains unclear.
It is possible to outline a rough wave count, which would suggest that the price is in the (e) wave of an a-b-c-d-e formation. If this theory is true, BTC is currently in the process of beginning the third sub-wave, which should take the price towards the support line at $6,500.
Possible Head-and-Shoulders
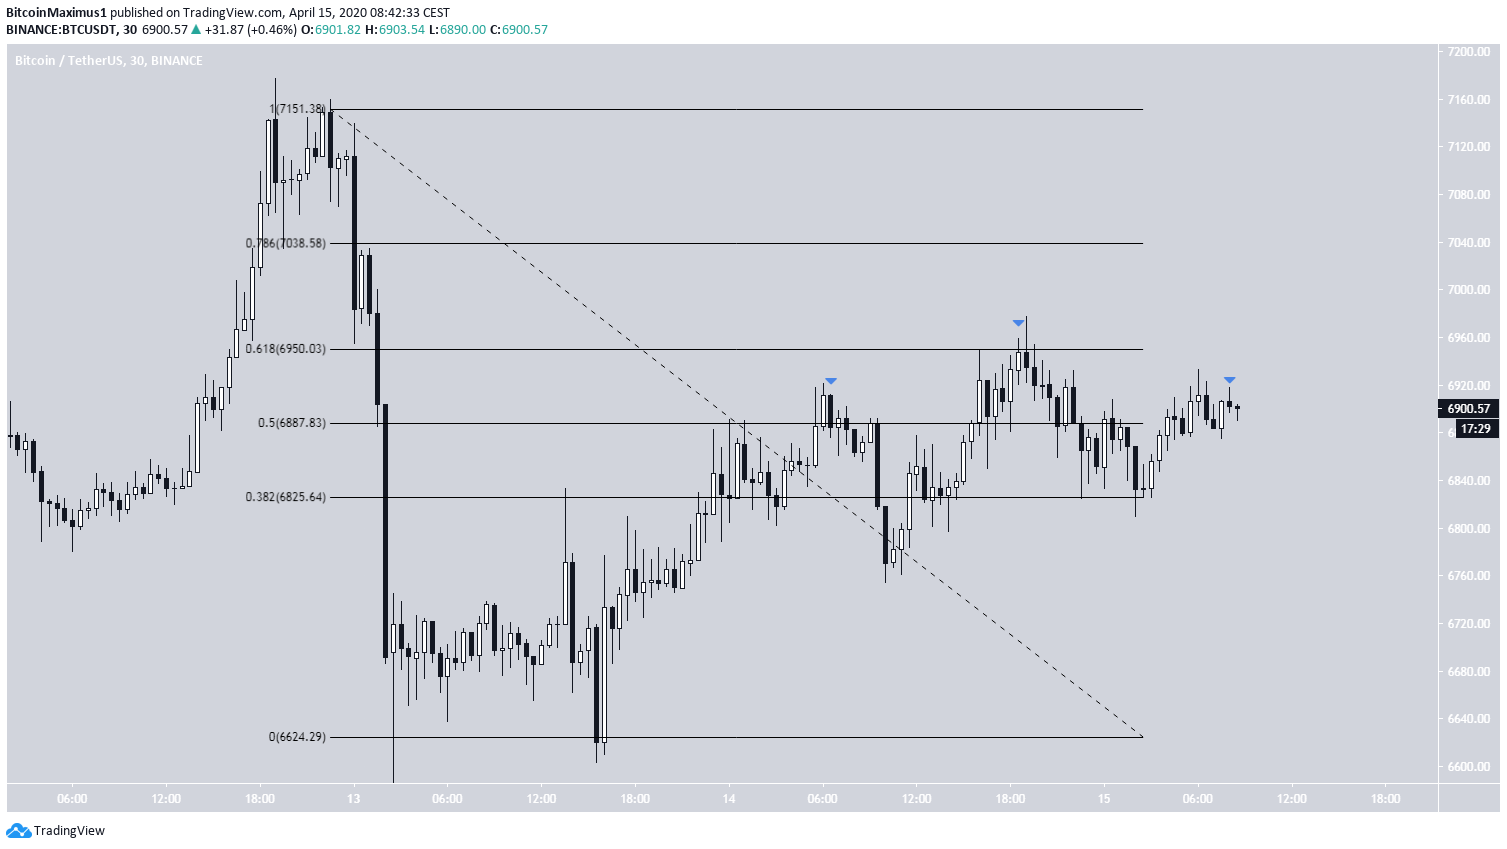
Lower time-frames further support the possibility of the Bitcoin price continuing to decrease. Since the rapid downturn on April 13, the price has been increasing, but the upward move was clearly rejected at the 0.618 Fibonacci level.
In addition, the price has possibly created a head and shoulders pattern, currently being in the process of creating the right shoulder, which is the first lower-high.
If the pattern were to be completed and confirmed, a breakdown would take the price towards the lows at $6600, and possibly towards the support line of the descending wedge near $6300.
To conclude, the Bitcoin price has been trading inside a descending, broadening wedge since April 6. It has currently reached its resistance line and the price is expected to begin a downward move soon, with an eventual target of $6,300.
For those interested in BeInCrypto’s previous Bitcoin analysis, click here.


