


Dia (DIA) has bounced at a strong support area of $1.85, but has yet to reclaim any of its closest resistance levels.
Along with DIA, Loopring (LRC) has bounced at the previous resistance area but has yet to initiate a significant upward movement.
Akropolis (AKRO) has broken out from a descending resistance line and is expected to reach a new all-time high price eventually.
Dia (DIA)
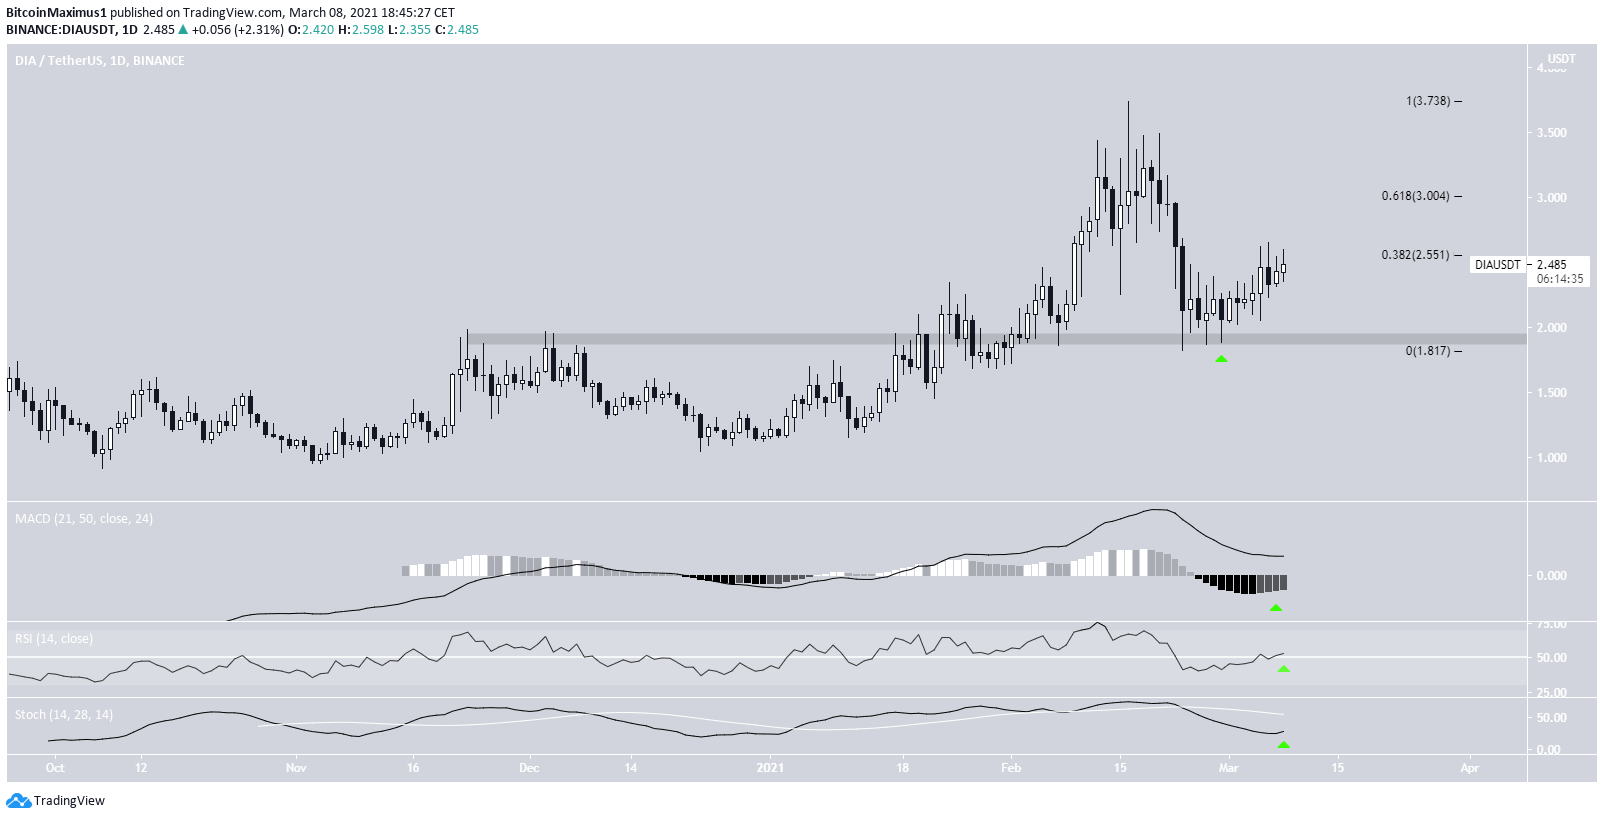
DIA has been decreasing since Feb. 16, when it reached a high of $3.73.
After the drop, it bounced at the $1.85 support area on Feb. 23 and moved upwards since.
Technical indicators are bullish. This is evident by the bullish reversal signal in the MACD & RSI cross above 50.
However, DIA has yet even to clear the 0.382 Fib retracement level of the most recent decrease. If it does, the next closest resistance area would be the 0.618 Fib at $3.
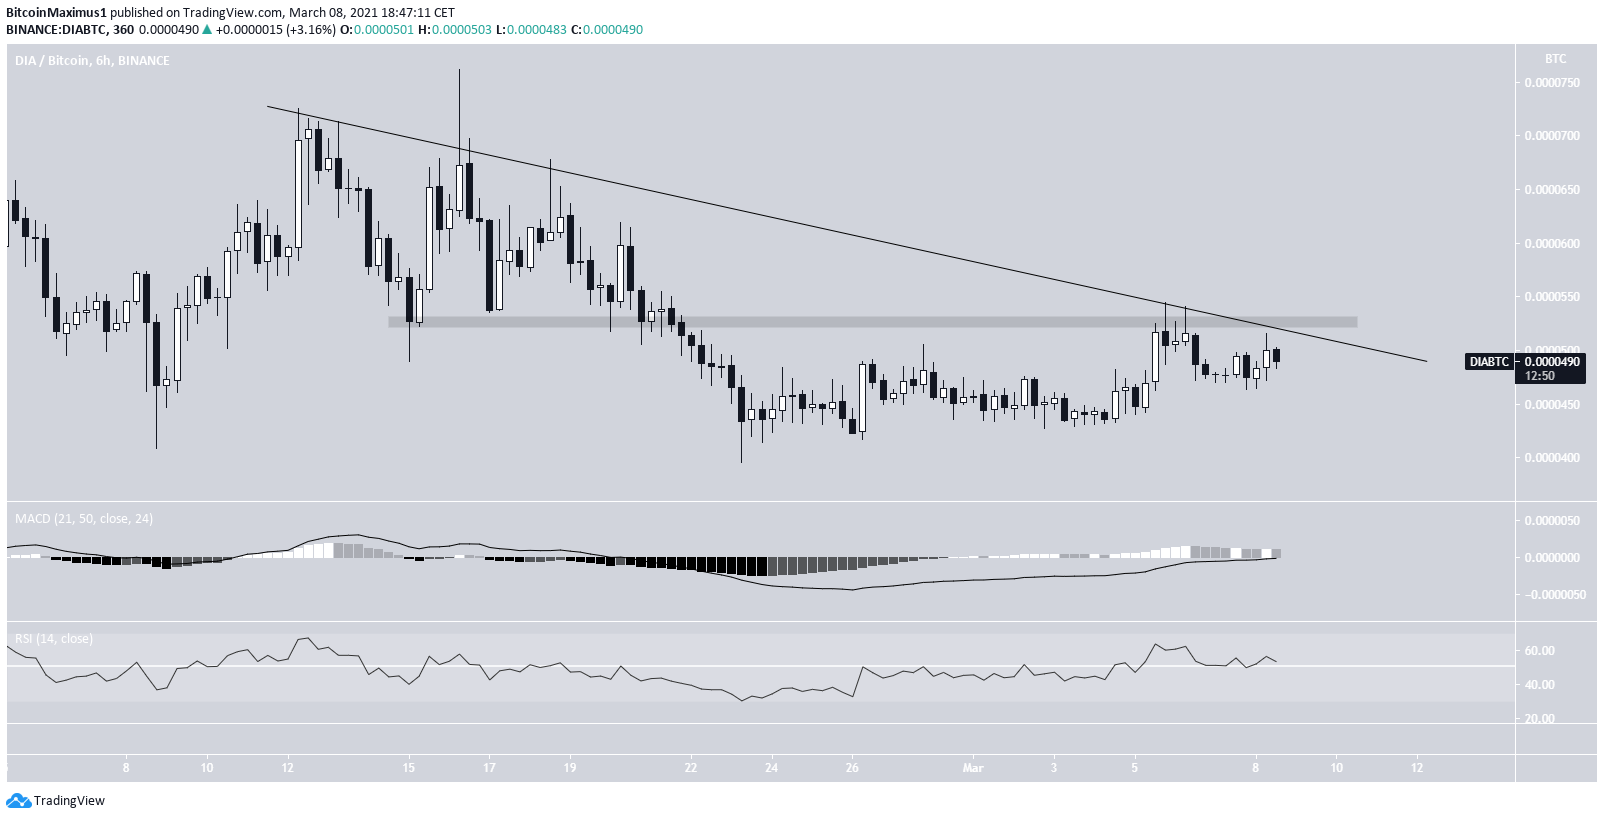
DIA/BTC has been following a descending resistance line since Feb. 12. It is currently slightly below it, potentially making its fourth attempt at breaking out.
Furthermore, the line coincides with the 5300 satoshi resistance area.
Despite the MACD & RSI being bullish, the trend cannot be considered until DIA breaks out from both this line and area.
Highlights
- DIA/USD has bounced at the $1.85 support area.
- DIA/BTC is following a descending resistance line.
Loopring (LRC)
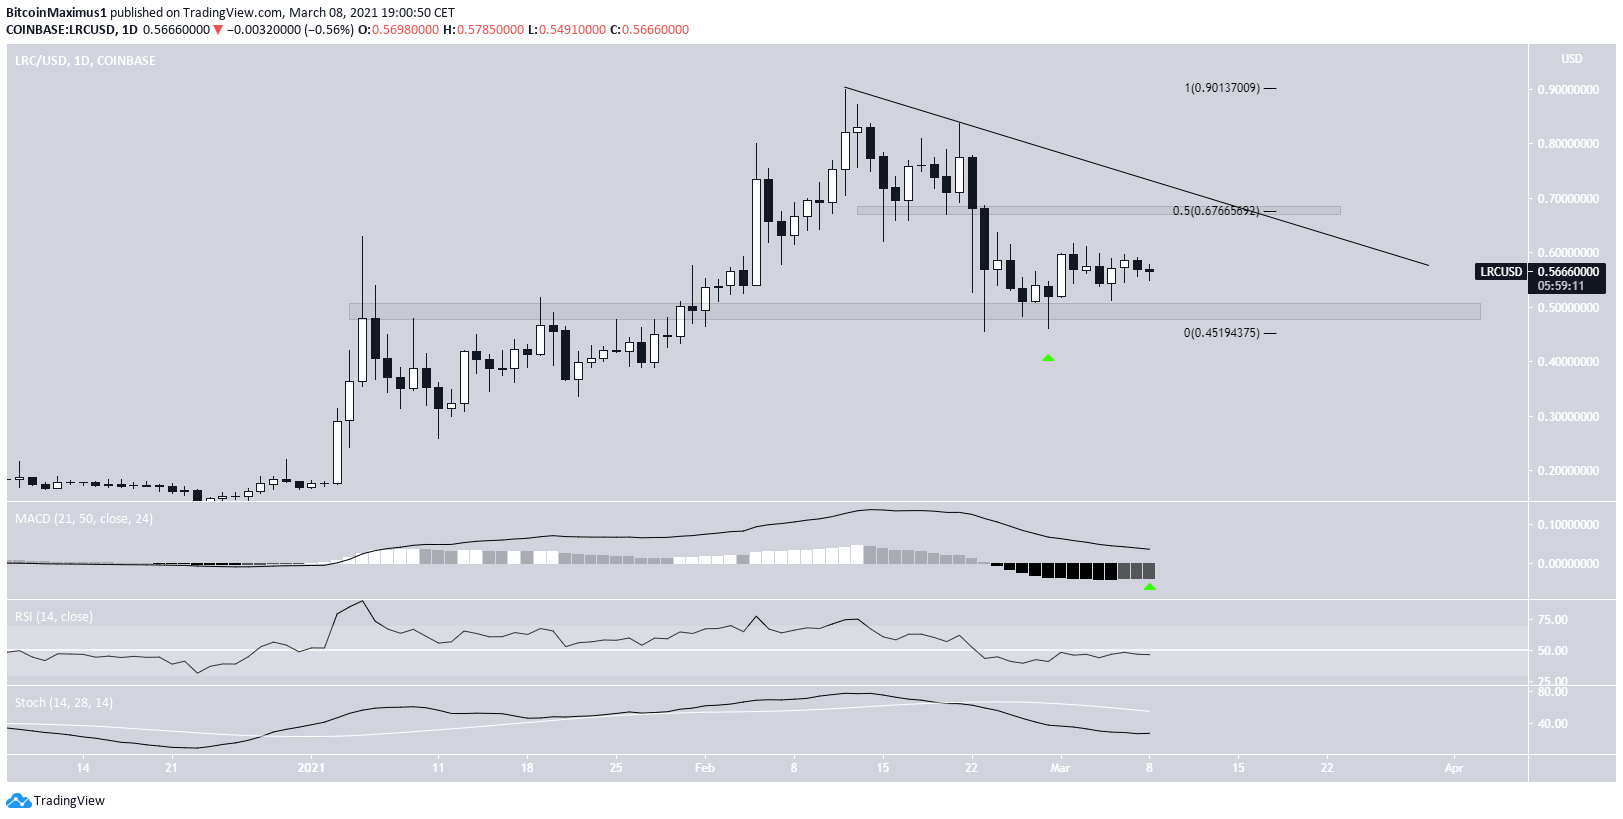
LRC has been decreasing since Feb. 12, when it reached a high of $0.89.
The decrease took it to the $0.50 area, which previously acted as a resistance level. The subsequent bounce validated it as support.
However, technical indicators are neutral, and the bounce has been weak.
Therefore, it is not clear if the trend is bullish or if LRC will break down below this area.
The closest resistance area is found at $0.67, coinciding with a potential descending resistance line.
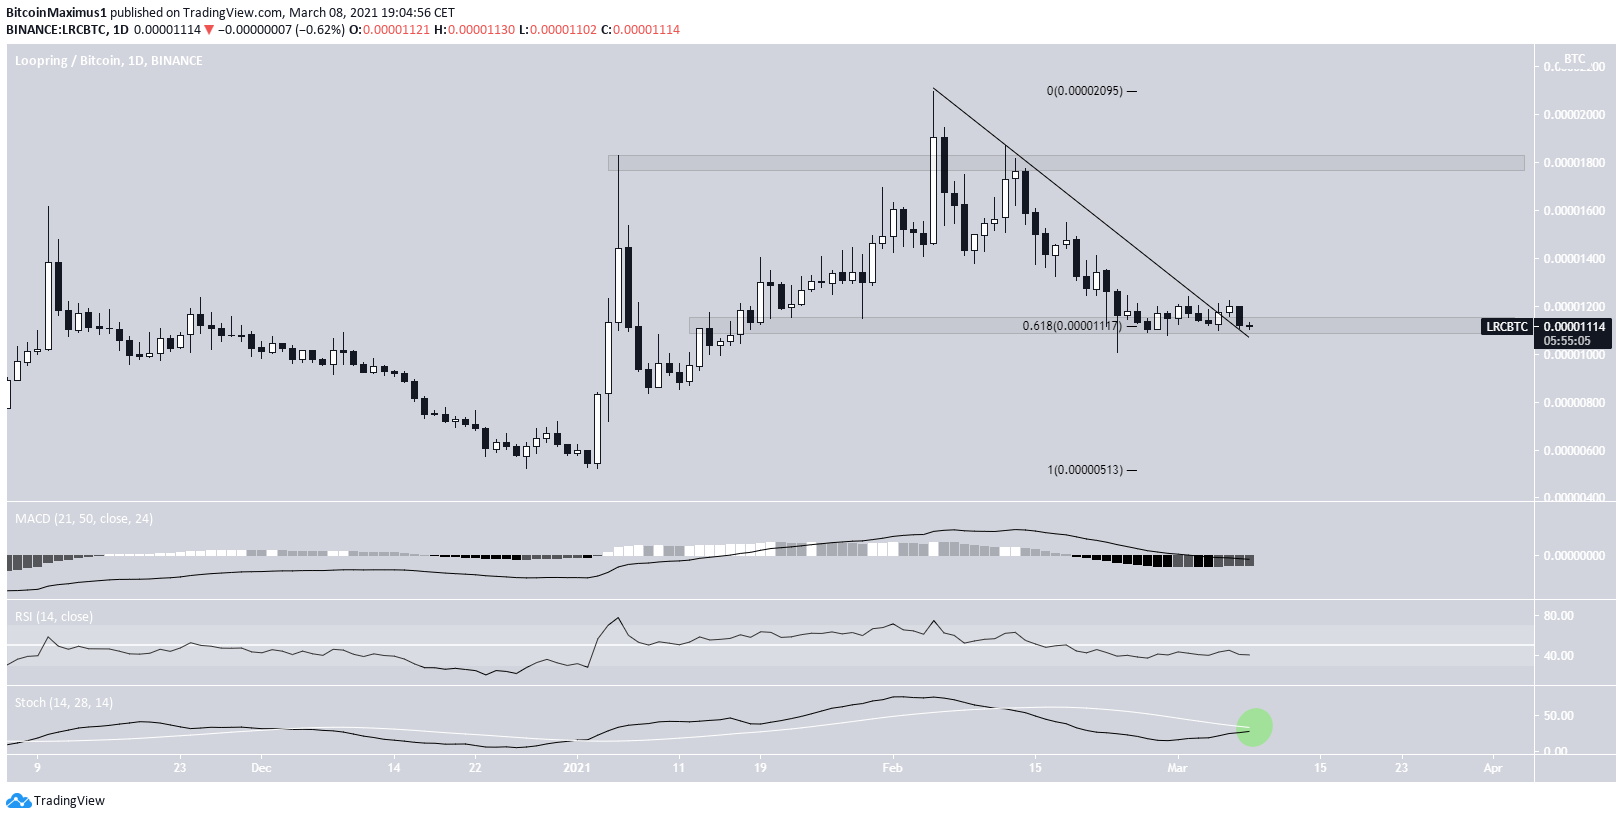
The LRC/BTC pair has been moving downwards since Feb. 5, when it reached a high of 2094 satoshis.
The drop ended once LRC reached the 1100 satoshi area and broke out from a descending resistance line afterward. The area is the 0.618 Fib retracement level of the most recent upward move.
Technical indicators are bullish, and a bullish cross would confirm the bullish trend in the Stochastic oscillator (green circle).
If LRC moves upwards, it will find the next resistance area at 1800 satoshis.
Highlights
- LRC/USD has bounced at the $0.50 support area.
- LRC/BTC has potentially broken out from a descending resistance line.
Akropolis (AKRO)
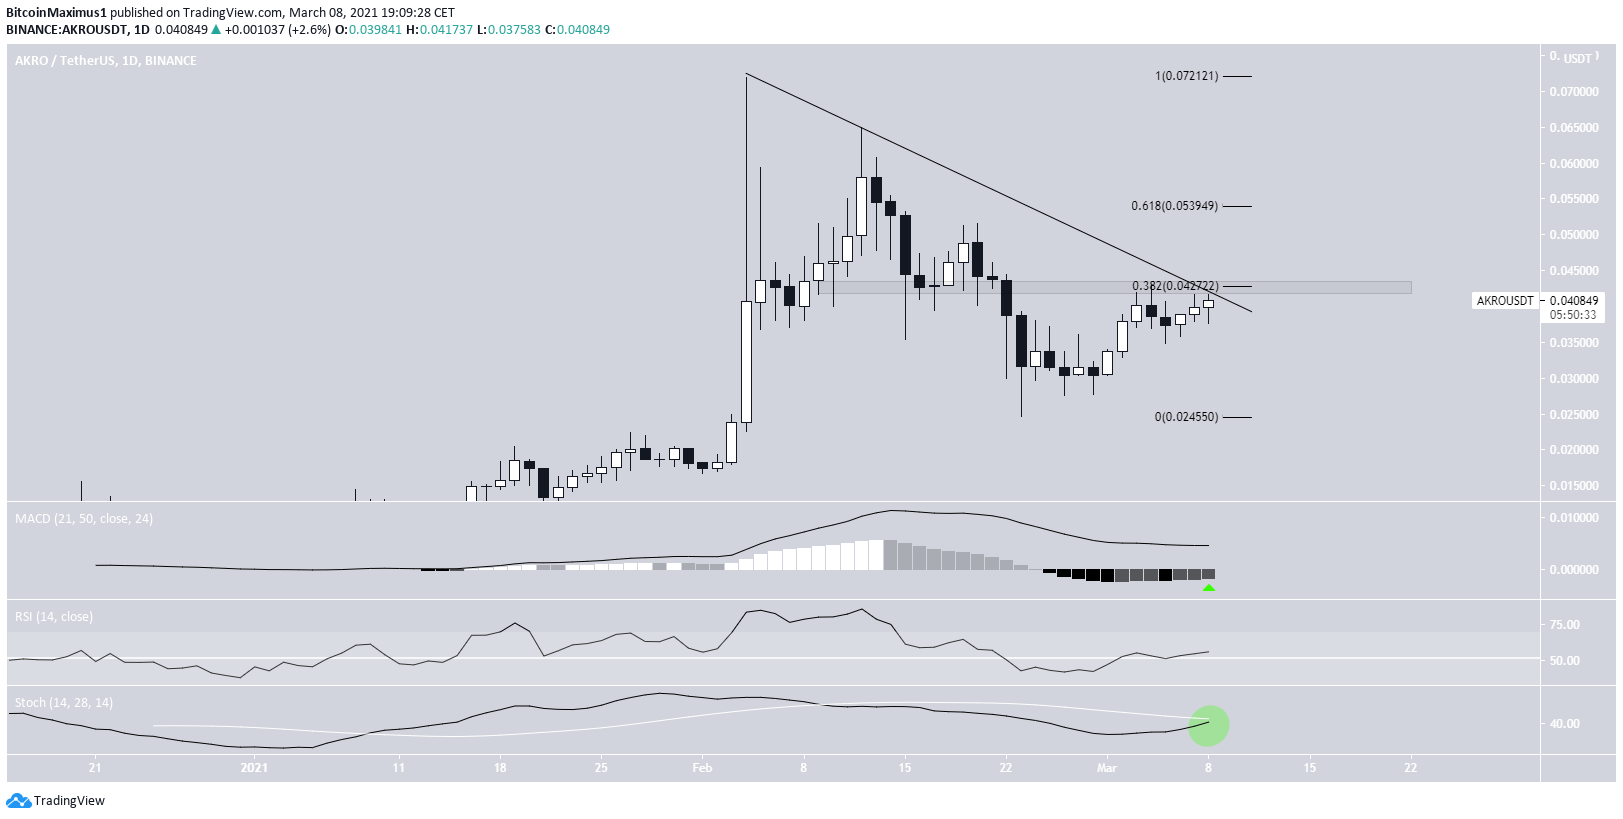
AKRO has been decreasing since reaching an all-time high of $0.064 on Feb. 12.
Throughout the decrease, it has been following a descending resistance line.
Currently, AKRO is trading just below this line, coinciding with the minor $0.042 resistance area.
Until a breakout from this line & area occurs, we cannot consider the trend bullish.
Nevertheless, technical indicators suggest a breakout is expected. This is evident by the bullish reversal signal in the MACD & bullish cross in the Stochastic oscillator.
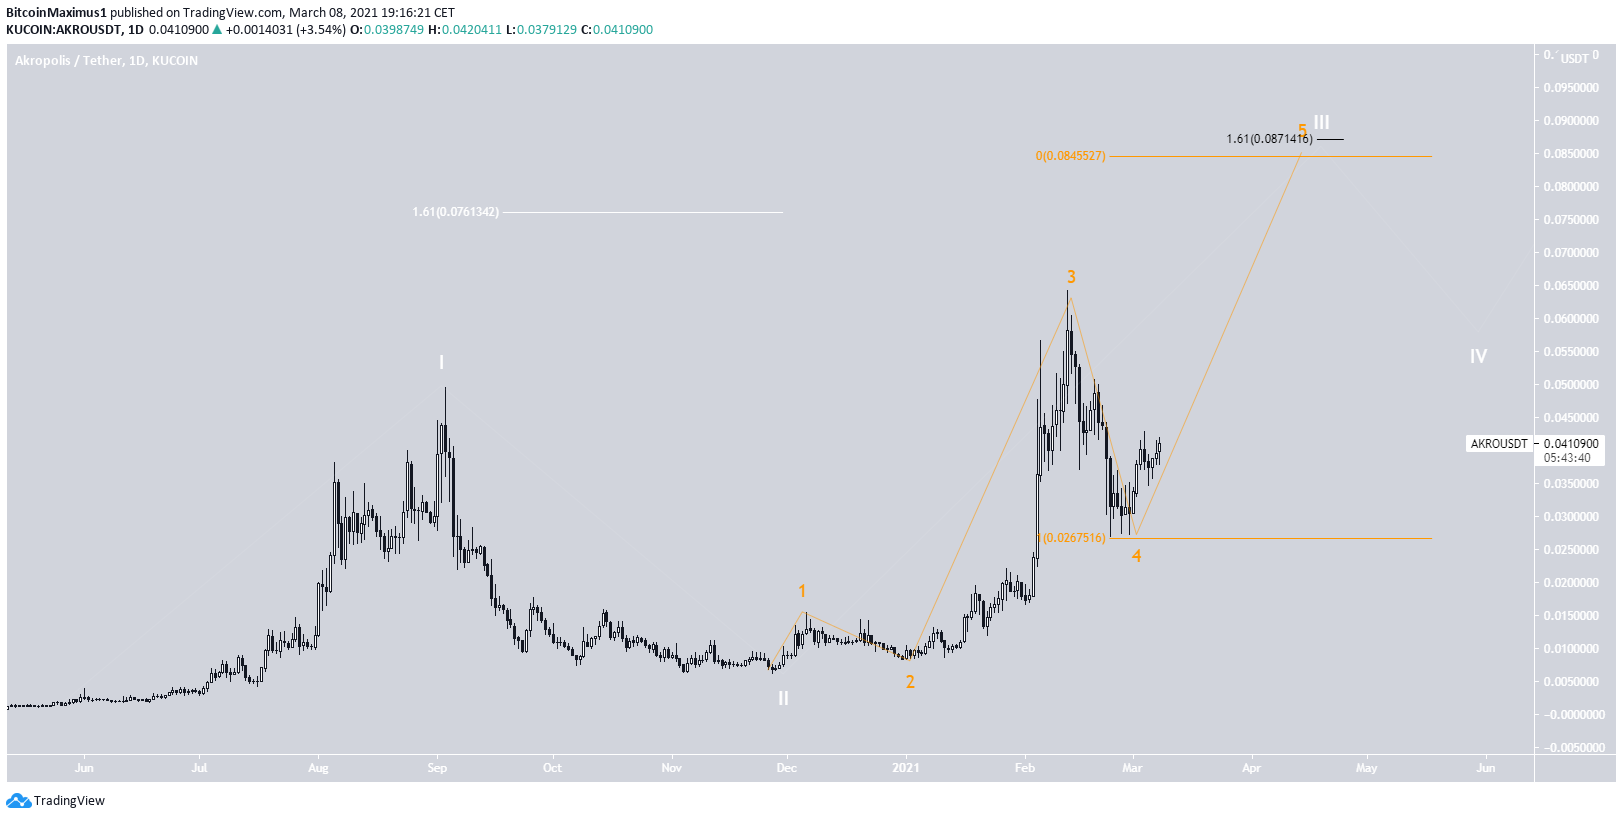
The wave count suggests that AKRO is in sub-wave five (orange) of a long-term wave three (white).
The most likely target for the top of this movement is found between $0.76-$0.87.
The target is found by using a combination of external retracements (white & black) and Fib projection (orange)
A decrease below the sub-wave four low of $0.027 would invalidate this particular wave count.
Highlights
- AKRO has broken out from a descending resistance line.
- AKRO is in sub-wave five of a bullish impulse.
For BeInCrypto’s latest Bitcoin (BTC) analysis, click here.


