


The DFI.Money (YFII) price looks to be in the process of breaking out from a descending resistance line.
The YFII price has been decreasing since reaching a local high of $6,940 on Sept 12. The downward move that followed culminated in the price hitting a low of $2,820 on Sept 24.
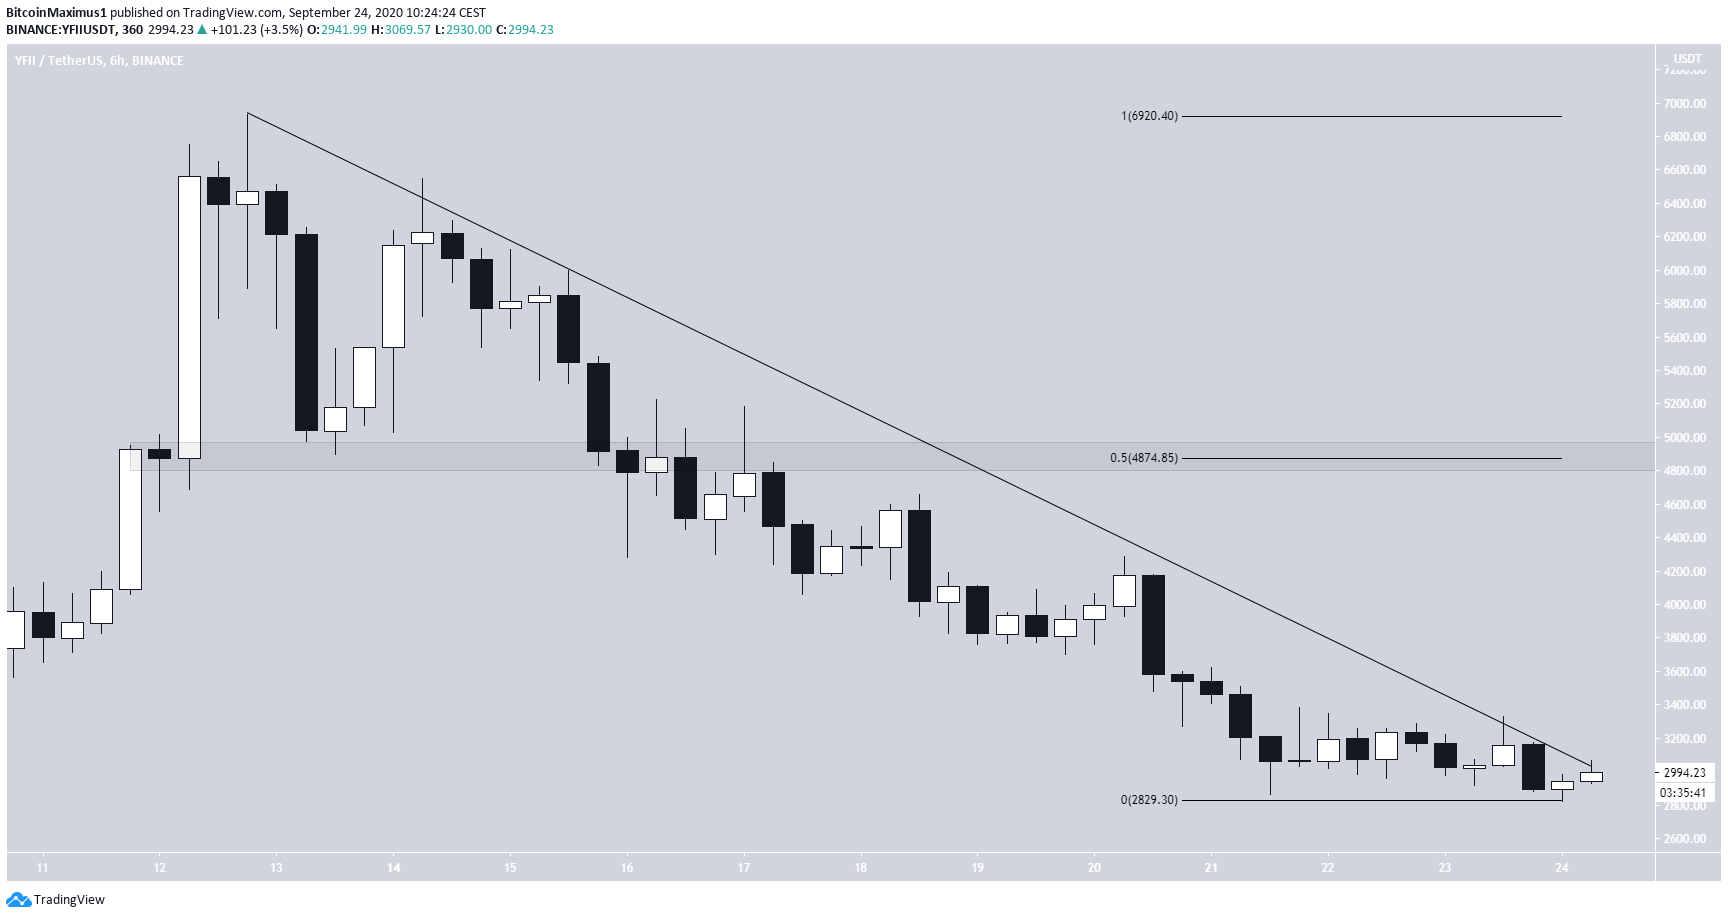
YFII Following a Descending Resistance Line
Throughout the decrease, the price has been following a descending resistance line and is currently in the process of making a breakout attempt.
If successful, the closest resistance area would be found at $4,900, which is the 0.5 Fib level of the entire decrease.
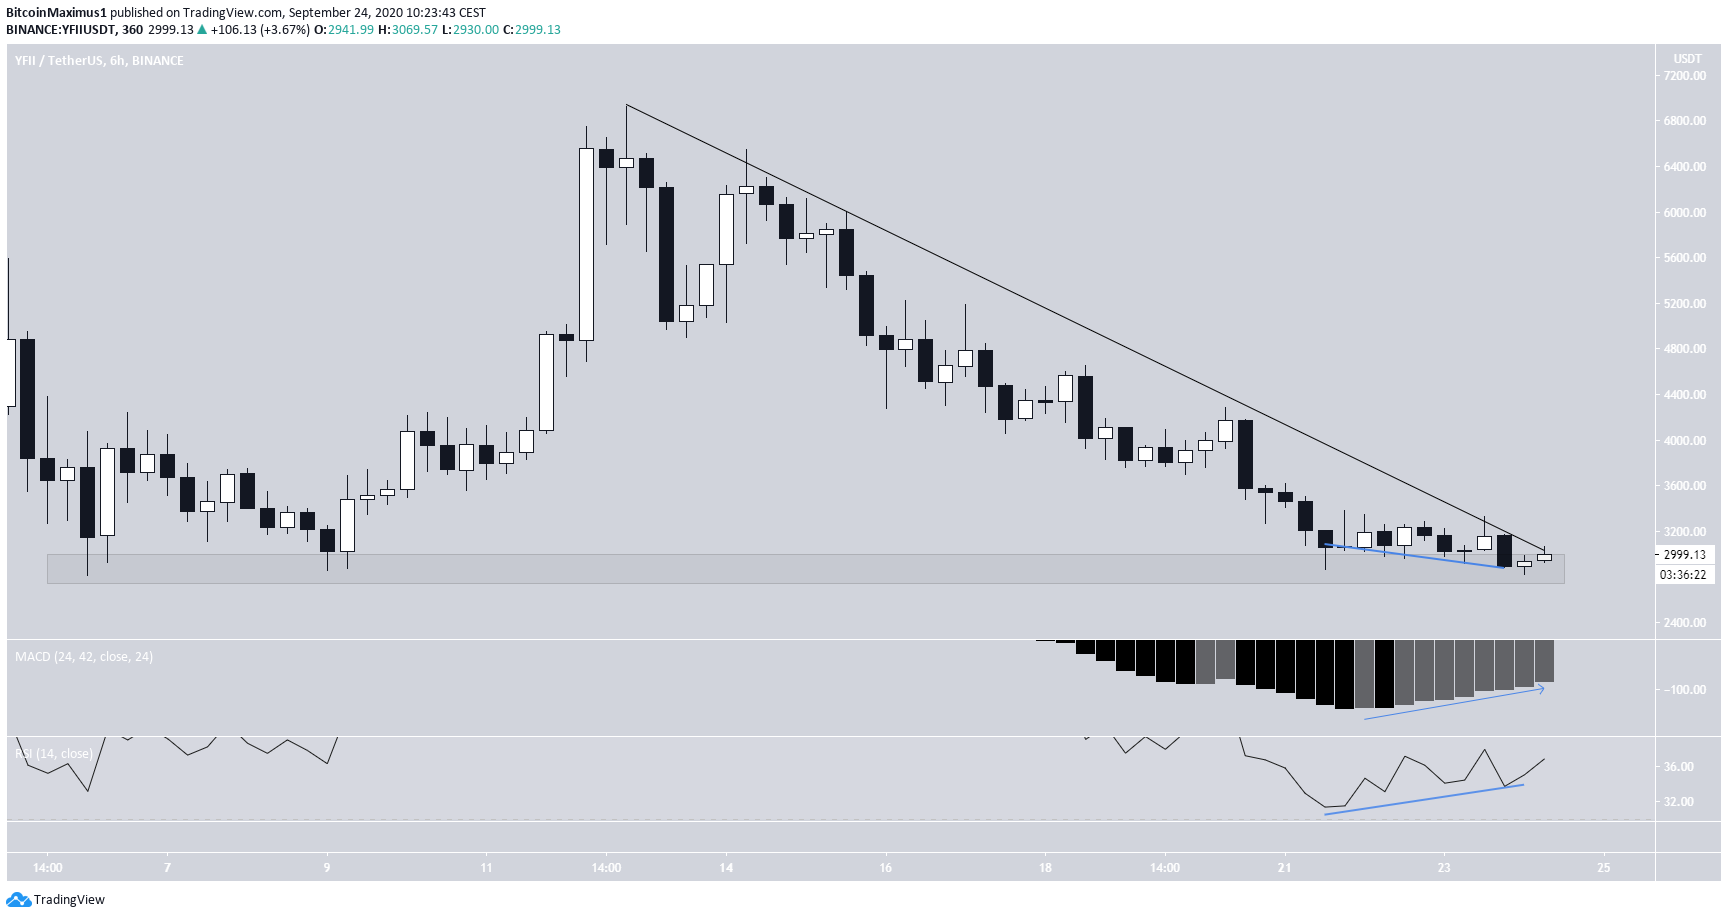
Possible Breakout
Technical indicators are showing that the possibility of a breakout is high. There is a bullish divergence in both the RSI and MACD and the latter is close to moving into positive territory.
Furthermore, the price has bounced at the $2,900 support area, which acted as the low during the beginning of September. A breakdown from this area could trigger a rapid decrease.
Considering these signals, a breakout from the descending resistance line seems the more likely scenario.
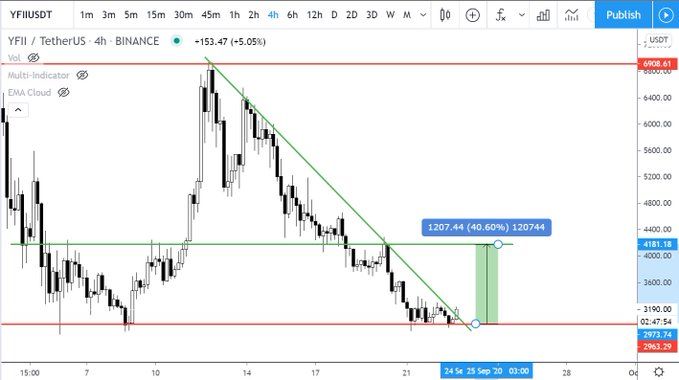
Cryptocurrency trader @Devchart outlined a YFII chart that shows a possible breakout, which could lead to an eventual increase of 40%. Due to the analysis from the two previous sections, this seems like the most likely scenario.
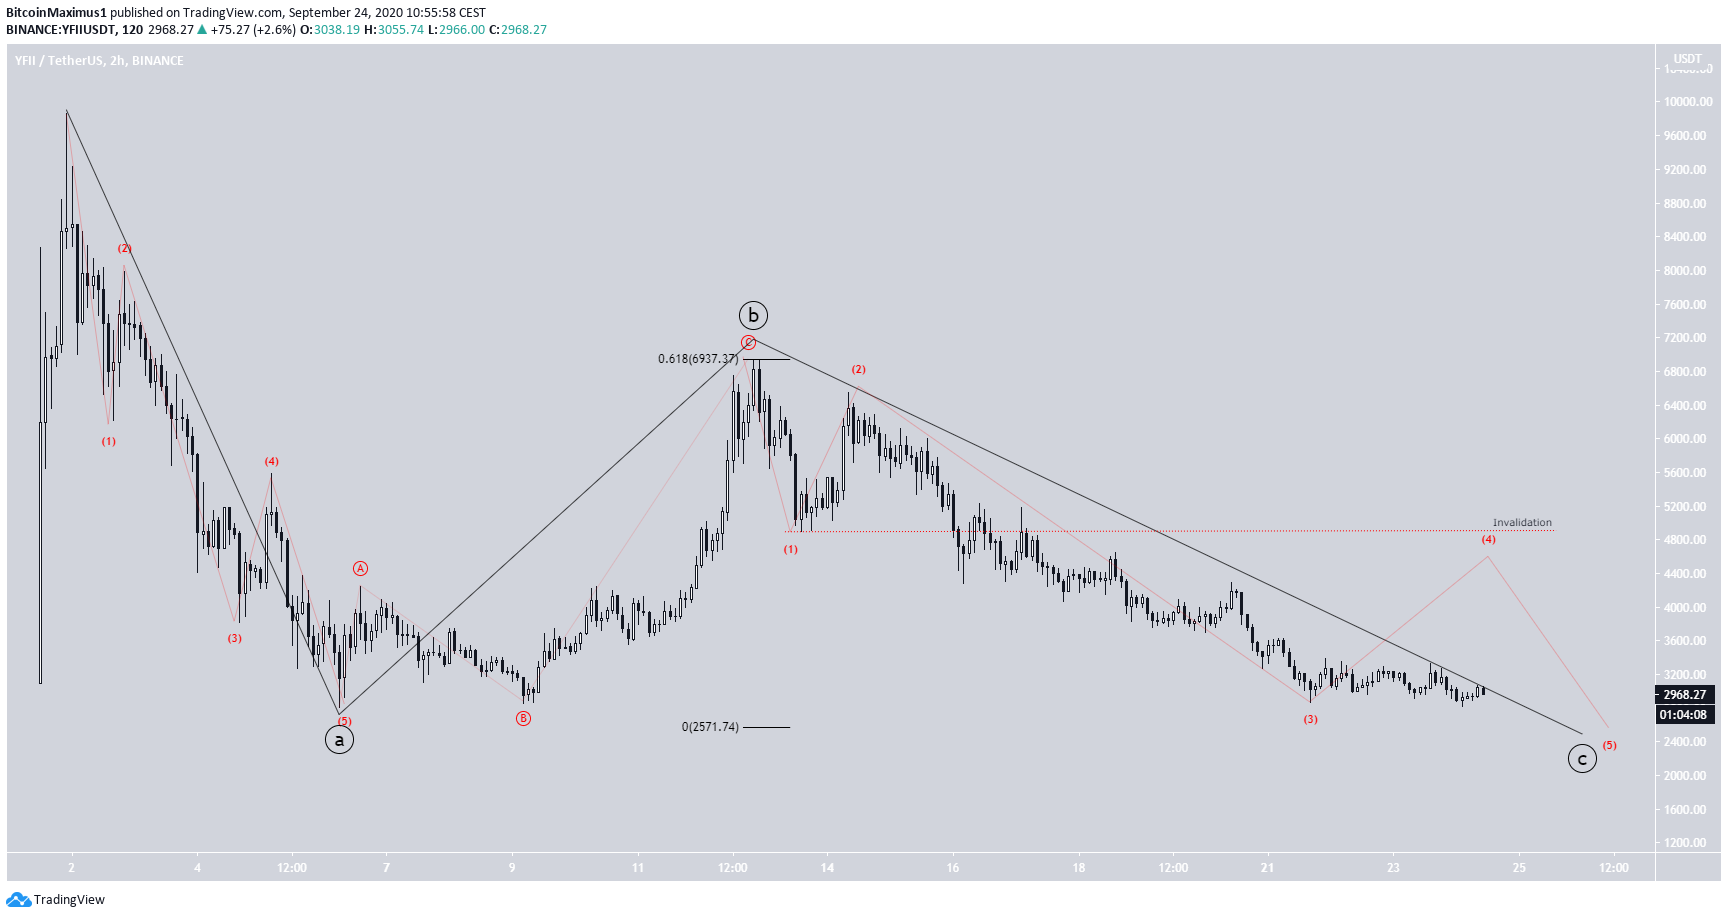
Wave Count
Beginning on Sept 1, the price has likely begun an A-B-C correction (shown in black below) and looks to be nearing an end.
However, the price will likely dip down another leg, since the C wave has yet to reach the 0.618 Fib length of the A wave, which is the minimum length it often reaches.
In addition, we cannot count five waves down (red) for the C wave. This makes it likely that if a breakout occurs, it will only be a corrective bounce after which the price will reach another low.
A possible target for the final low is estimated to be $2,570.
To conclude, the YFII price is expected to break out from the current descending resistance line. However, the most likely scenario is that the price will test one more lower-low first.
For BeInCrypto’s latest Bitcoin (BTC) analysis, click here!


