


The week has had interesting developments, such as COMP being the first DeFi project with more than $10 billion in Total Value Locked (TLV).
In addition, the World Economic Forum (WEF) has had numerous discussions about the DeFi sector. Finally, HBTC launched six new ETFs, with Kava.io (KAVA) being one of them.
Compound (COMP) has broken out from a descending resistance line, but was rejected by a horizontal resistance area. Aave (AAVE) is trading inside a symmetrical triangle, from which a breakout is likely.
Compound (COMP)
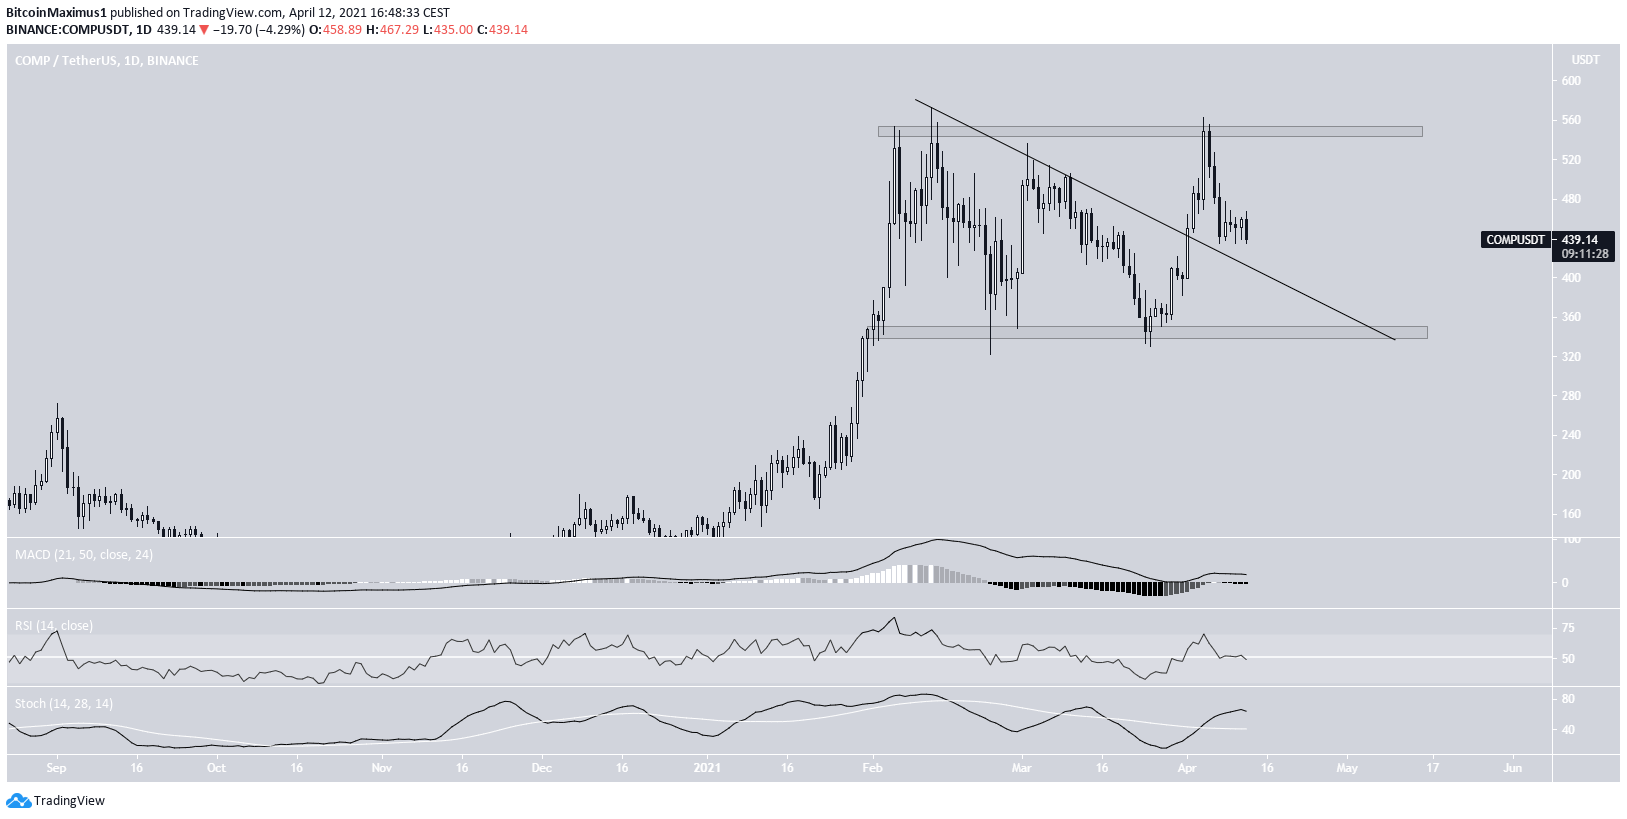
COMP has been decreasing alongside a descending resistance line. It has been doing so since reaching an all-time high price of $573 on Feb. 12.
On April 1, it managed to break out above this line, and proceeded to reach a high of $562 three days later. Despite this, COMP was rejected by the $550 resistance area. It is currently trading close to the descending resistance line from which it previously broke out. The closest horizontal support level is found at $340.
Technical indicators are neutral, leaning on bearish. While the Stochastic oscillator has made a bullish cross, both the MACD & RSI are moving downwards.
Therefore, it is not yet clear if COMP will bounce at the line which previously acted as resistance or if it will fall to the $340 area instead.
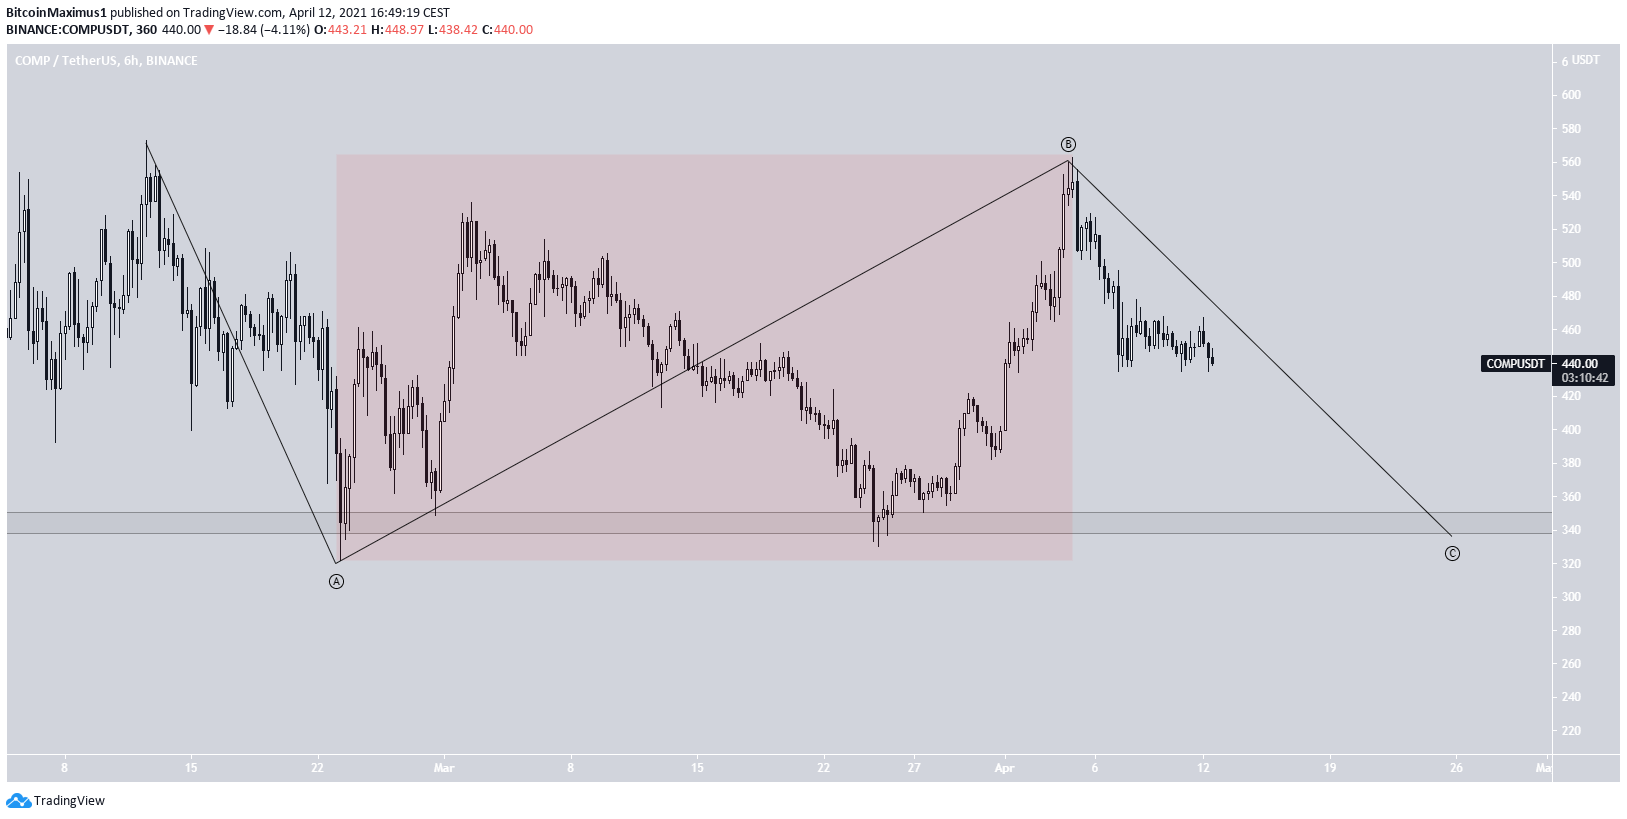
A closer look at the increase since Feb. 23 suggests that the move is corrective. Therefore, it is more likely that COMP is in an A-B-C flat corrective structure and will decrease towards the $340 support area once more.
Highlights
- COMP has broken out from a descending resistance line.
- It is facing resistance at $540.
Kava.io (KAVA)
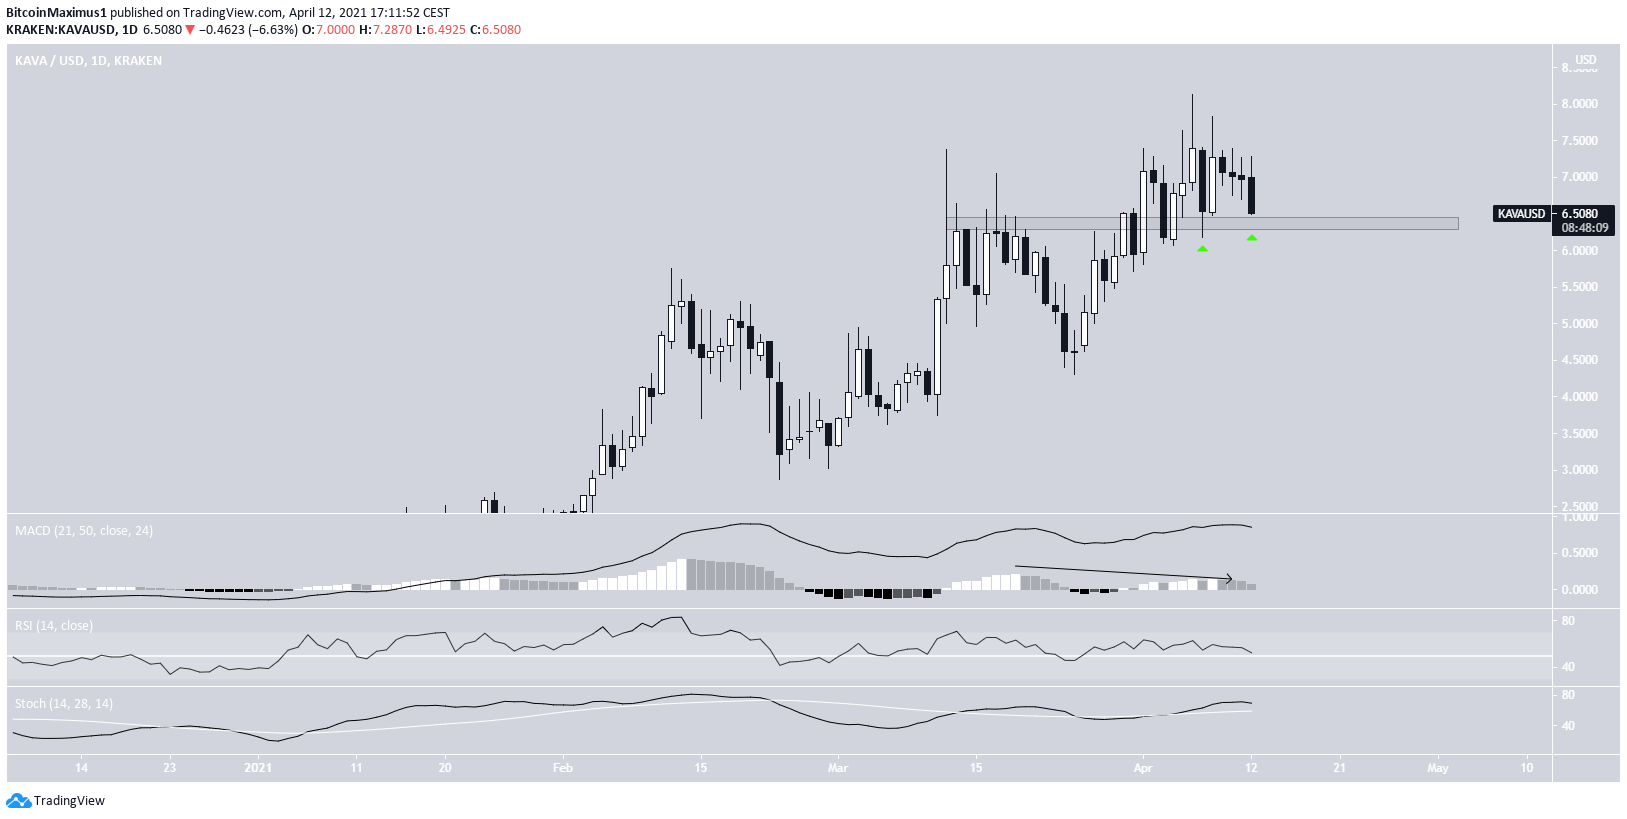
KAVA has been moving downwards since reaching an all-time high price of $8.13 on April 6.
Currently, it is in the process of re-testing the $6.35 area. The area previously acted as resistance, and it is likely that it will act as support during this decrease.
While technical indicators are still bullish, they are showing a lack of strength.
The MACD has generated bearish divergence. The RSI is decreasing, but is still above 50. Similarly, the Stochastic oscillator has lost strength, though it has yet to make a bearish cross.
Nevertheless, as long as KAVA is trading above the $6.35 area, this can still be considered a bullish re-test.
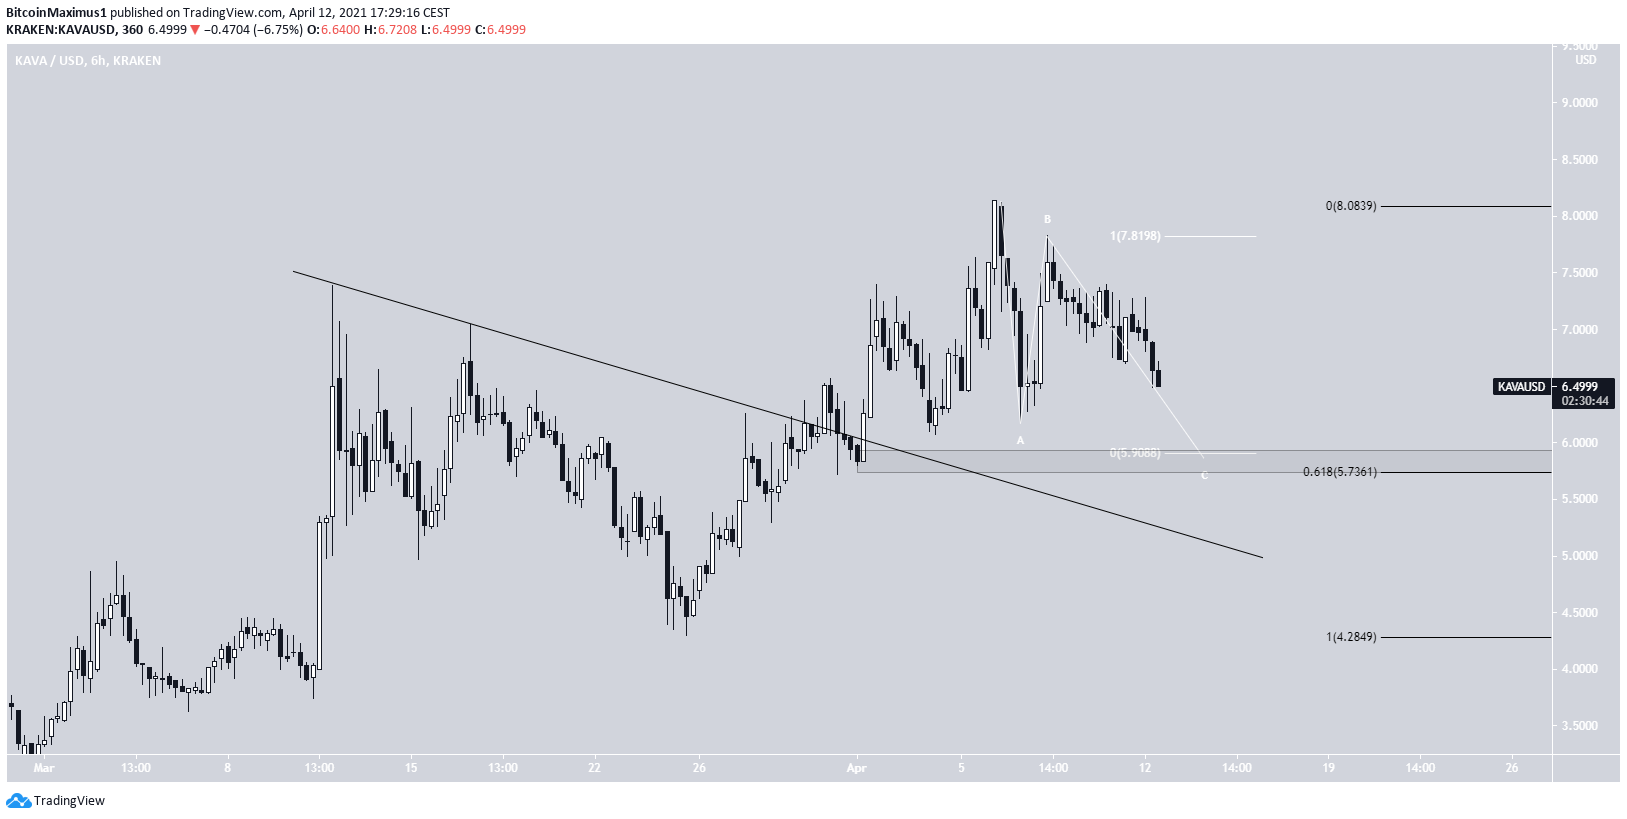
The shorter-term six-hour chart shows a breakout from a descending resistance line. In addition, the ensuing decrease looks like an A-B-C corrective structure.
If waves A:C have a 1:1 ratio, it would take KAVA down to $5.90, close to the 0.618 Fib retracement support level.
Afterwards, an upward movement that takes KAVA towards a new all-time high near $12 is expected.
Highlights
- KAVA has broken out from a descending resistance line
- There is support at $6.35 and $5.75
- Released Kava 5 on April 8
AAVE (AAVE)
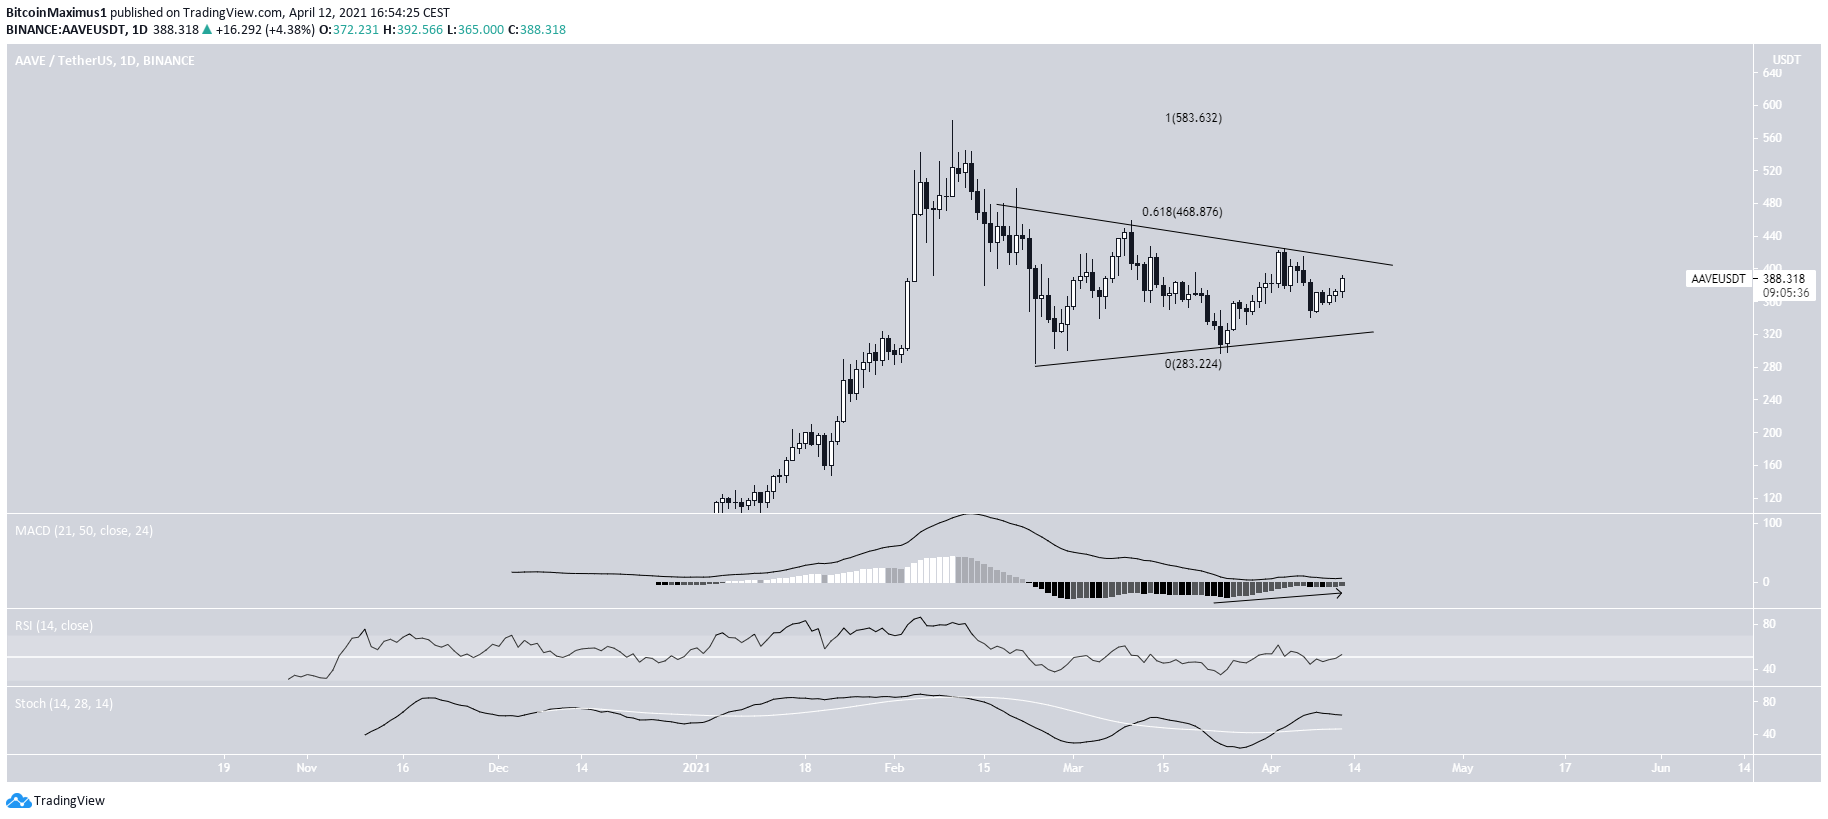
AAVE has been decreasing since Feb. 10, when it reached an all-time high price of $581.667. Since Feb. 18, it has been trading inside a symmetrical triangle.
Currently, it is approaching the point of convergence between resistance and support, at which point a decisive move is expected.
Technical indicators are bullish. Both the MACD & RSI are increasing, and the former is very close to crossing into positive territory.
Therefore, a breakout from this pattern is expected. If so, the next resistance levels would be found at $468 and $583, respectively.
Highlights
- AAVE is trading inside a symmetrical triangle.
- There is resistance at $468 and $583.
For BeInCrypto’s latest bitcoin (BTC) analysis, click here.


