


DeFi Index
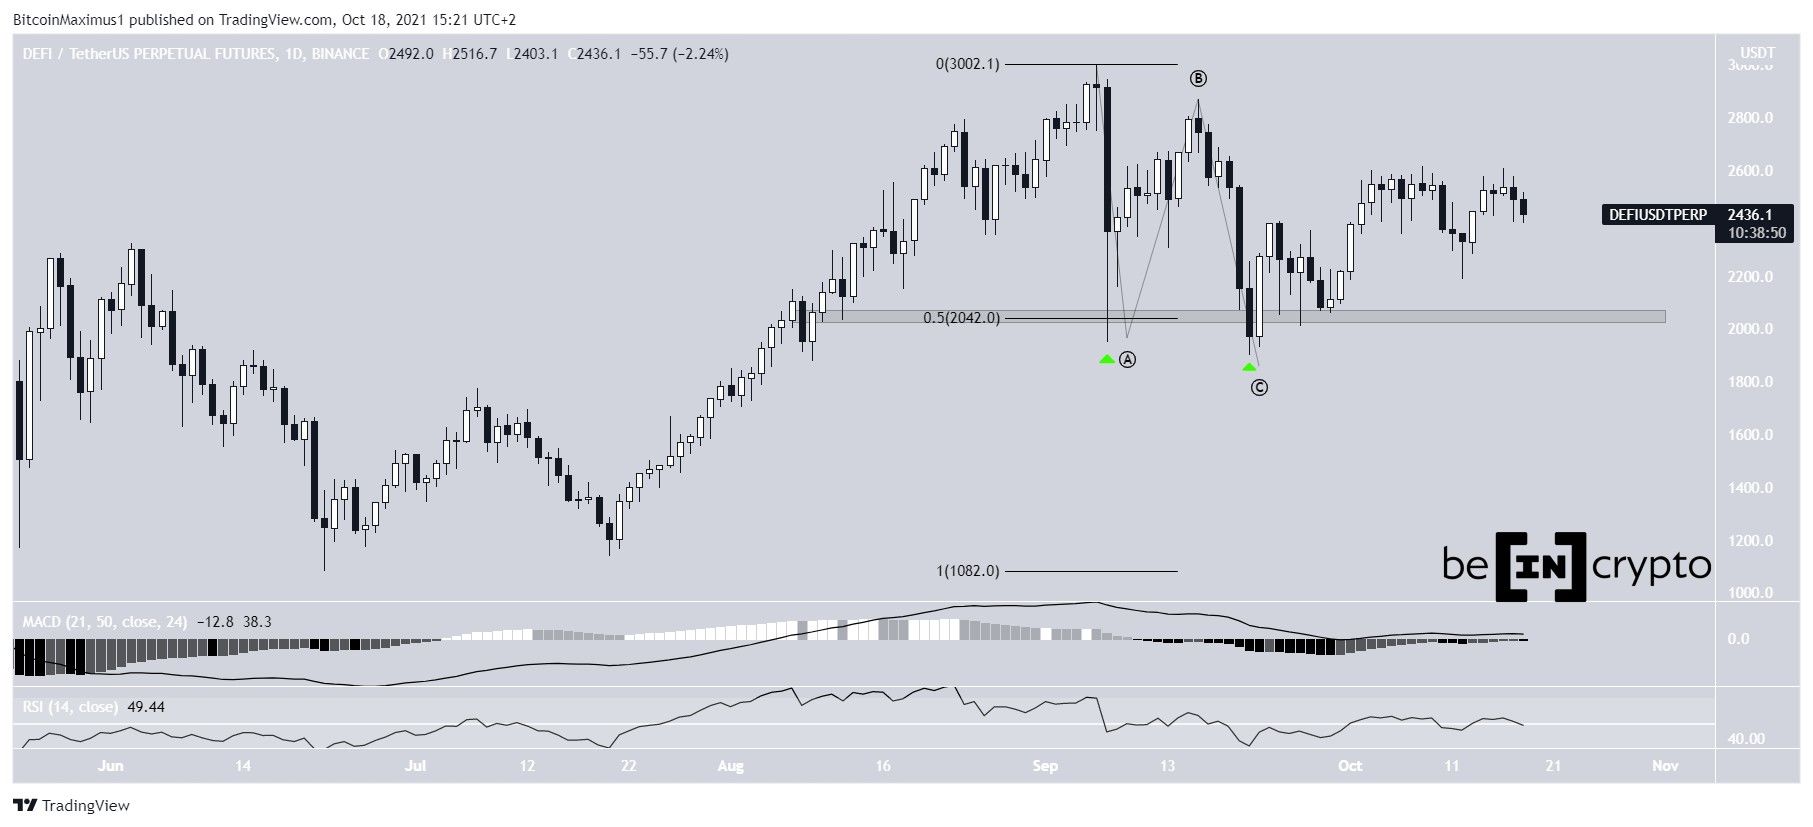
The daily chart for the DeFi index shows that it has twice bounced (green icon) at the $2,040 support. This is both a horizontal support area and the 0.5 Fib retracement support level, hence increasing its significance.
In addition to this, the decrease in the period from Sept 7 to 21 resembles an A-B-C corrective structure. This is because of the considerable overlap and the similarity in length between waves A and C. If correct, it would mean that the index has begun a new upward movement that will take it above the Sept highs.
However, technical indicators provide a neutral outlook. The MACD, which is created by a short- and long-term moving average (MA), is at the 0 line. This means that the short-term trend is moving at the same pace as the long-term one.
In addition to this, the RSI is at the 50 line. The RSI is a momentum indicator, and a reading of 50 is a sign of a neutral trend.
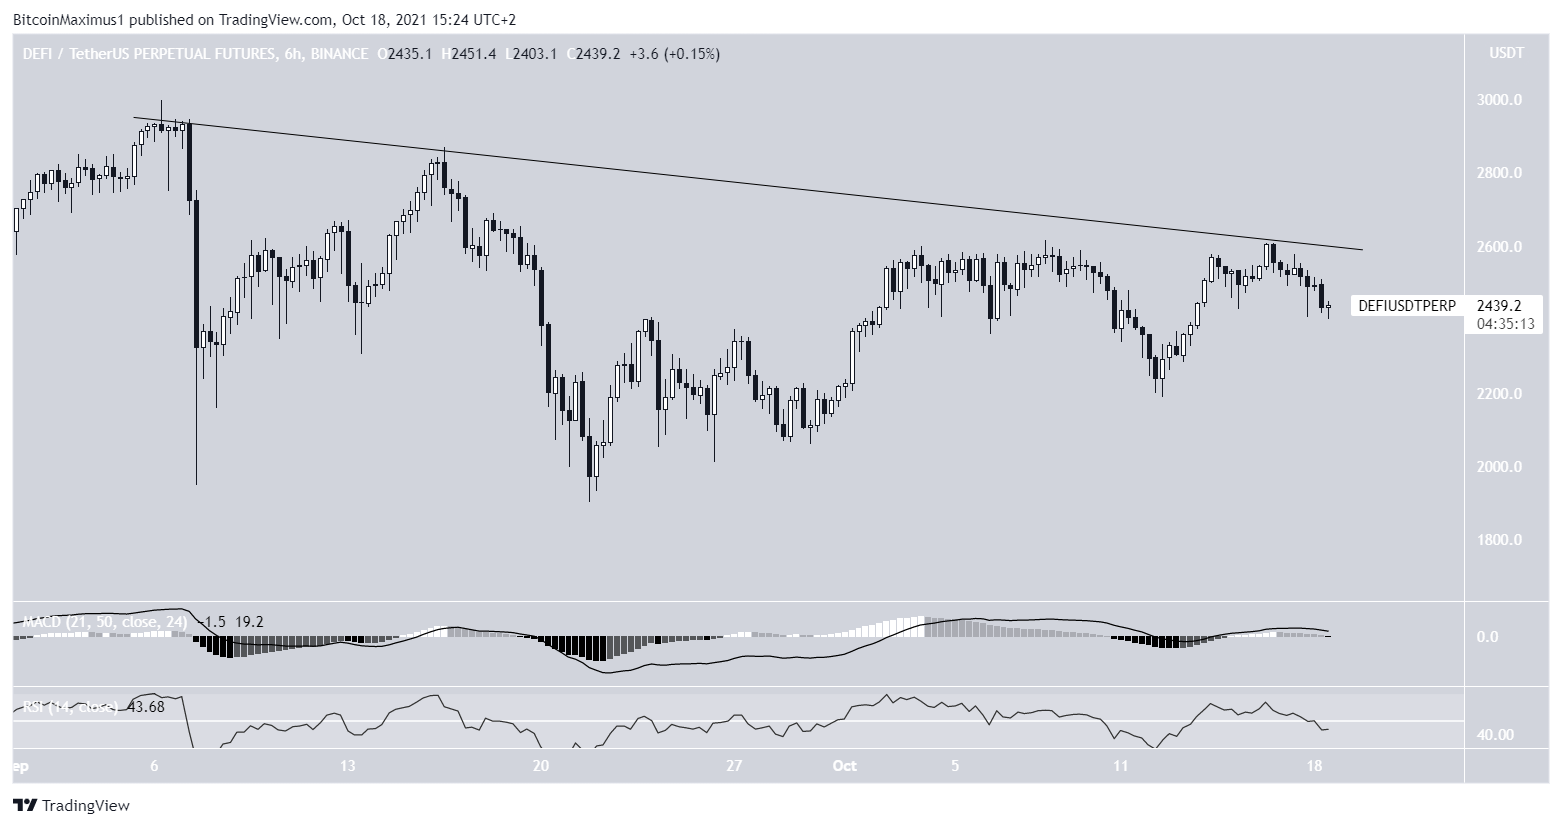
The shorter-term six-hour chart shows that the index is following a descending resistance line. As long as it is doing so, the correction is still ongoing.
Similarly to the daily time-frame, the RSI and MACD are both neutral.
Therefore, at the current time, it cannot be determined if the index will break out or get rejected.
Highlights
- The DeFi index is following a descending resistance line.
- It has completed an A-B-C corrective structure.
LINK
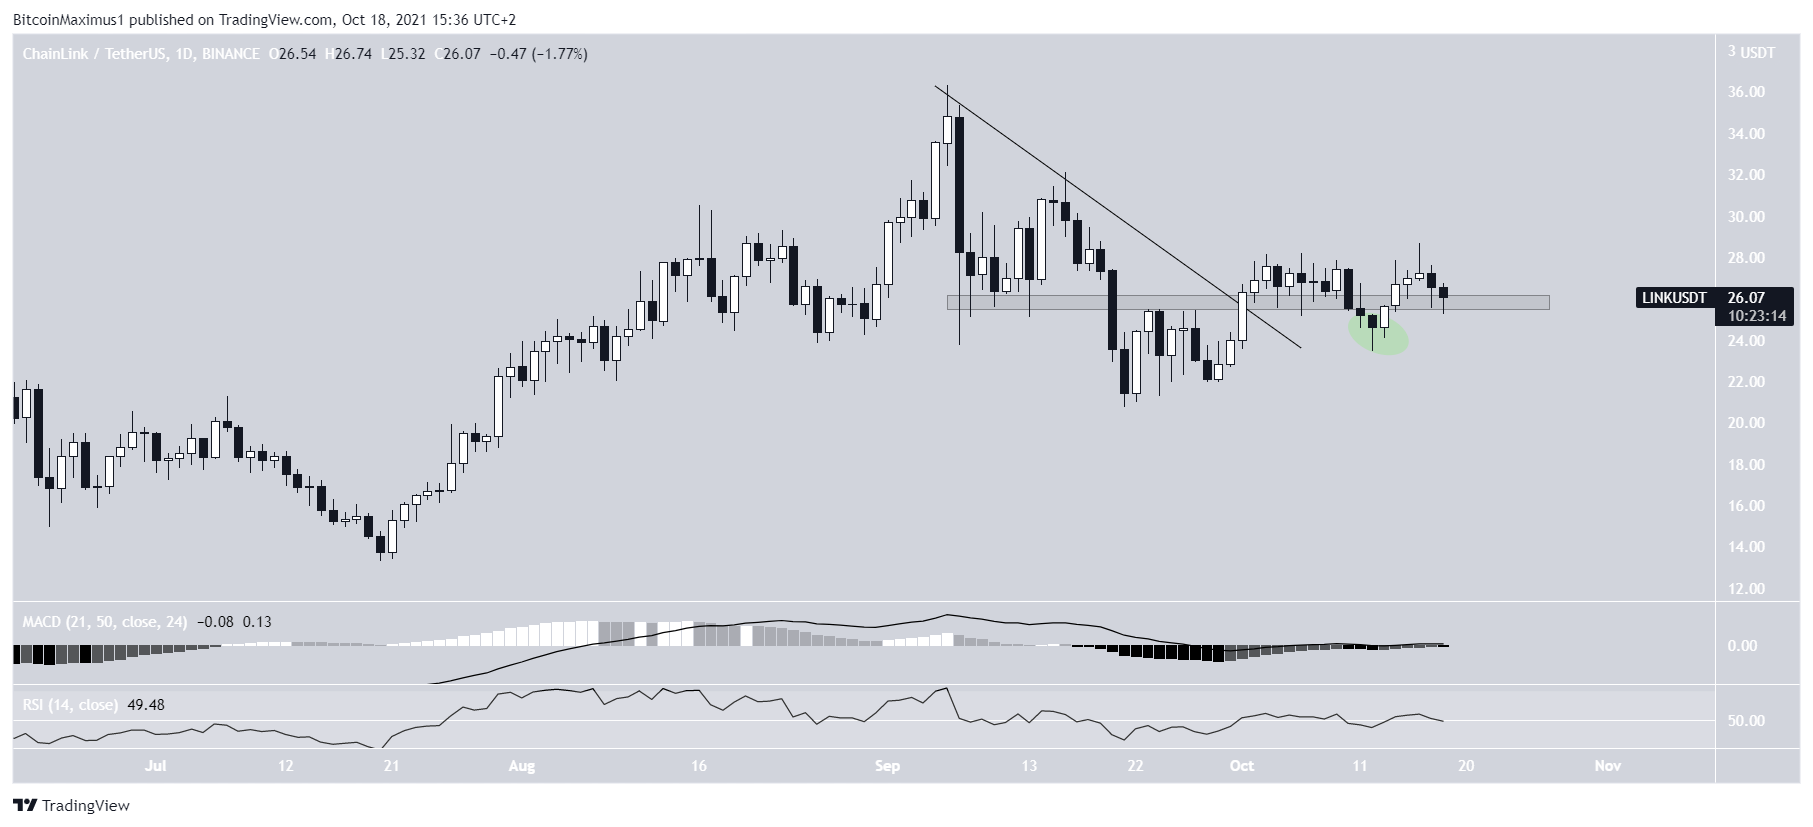
LINK had been following a descending resistance line since Sept 6. While following the line, the token fell to a low of $20.82, doing so on Sept 21.
However, it has been moving upwards since, and on Oct 1, it broke out from the descending resistance line. This was a sign that the correction had come to an end.
After doing so, it moved above the $26 area, which is now likely to act as support. The deviation (green circle) followed by a reclaim is another sign of strength, since it re-validated the area as support.
However, similarly to the DeFi index, technical indicators in the daily time-frame are neutral. The MACD is at the 0 line and the RSI is at 50.
Highlights
- LINK has broken out from a descending resistance line.
- It has reclaimed the $26 support area.
ANKR
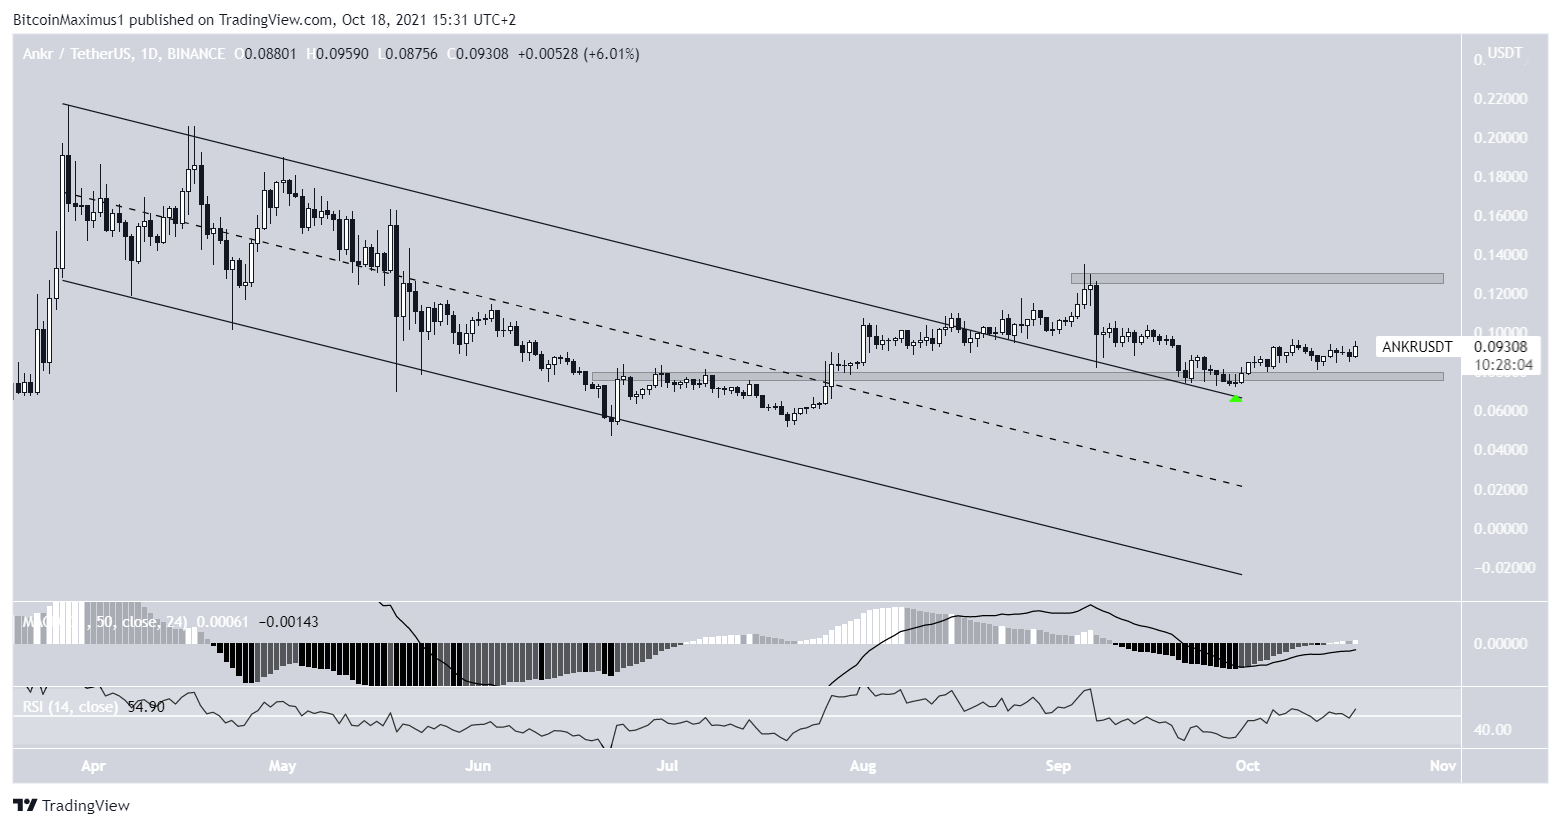
Since reaching an all-time high of $0.216 on March 28, ANKR had been trading inside a descending parallel channel. Such channels usually contain corrective movements, meaning that a breakout from the channel would be likely followed by the resumption of the upward trend.
Unsurprisingly, the token managed to break out on Aug 21.
Afterwards, it dropped until it validated the $0.086 area as support (green icon) and has been moving upwards since.
The RSI and MACD are also increasing, supporting the continuation of the upward movement. This is especially evident in the RSI, which has just moved above the 50 line.
Once ANKR managed to clear the Aug highs of $0.123, the rate of increase is likely to accelerate.
Highlights
- ANKR has broken out from a long-term descending parallel channel.
- There is support and resistance at $0.078 and $0.128.
For BeInCrypto’s latest Bitcoin (BTC) analysis, click here.
