
On February 7, the MANA price broke out above a significant resistance area that had been in place for 215 days.
MANA Highlights
- The price has likely completed a five-wave Elliott formation.
- There is support at 490 satoshis.
- The price has broken out from a 215-day resistance area.
- A golden cross has transpired.
- There is resistance at 660 and 940 satoshis.
The @decentraland twitter account announced that MANA has been added to Coinbase pro as a fully tradeable asset. The effect of a Coinbase announcement is somewhat ambiguous, and in the case of XRP launched fears of insider trading, allegations that were denied by its CEO.
We're proud to announce that $MANA has been added to Coinbase Pro in New York as a fully tradable asset. https://t.co/RNn2MaFhln
— Decentraland (@decentraland) February 10, 2020
What does this mean for the future price? Why did the price increase prior to the announcement? Continue reading below if you want to find out.
Coinbase Listing
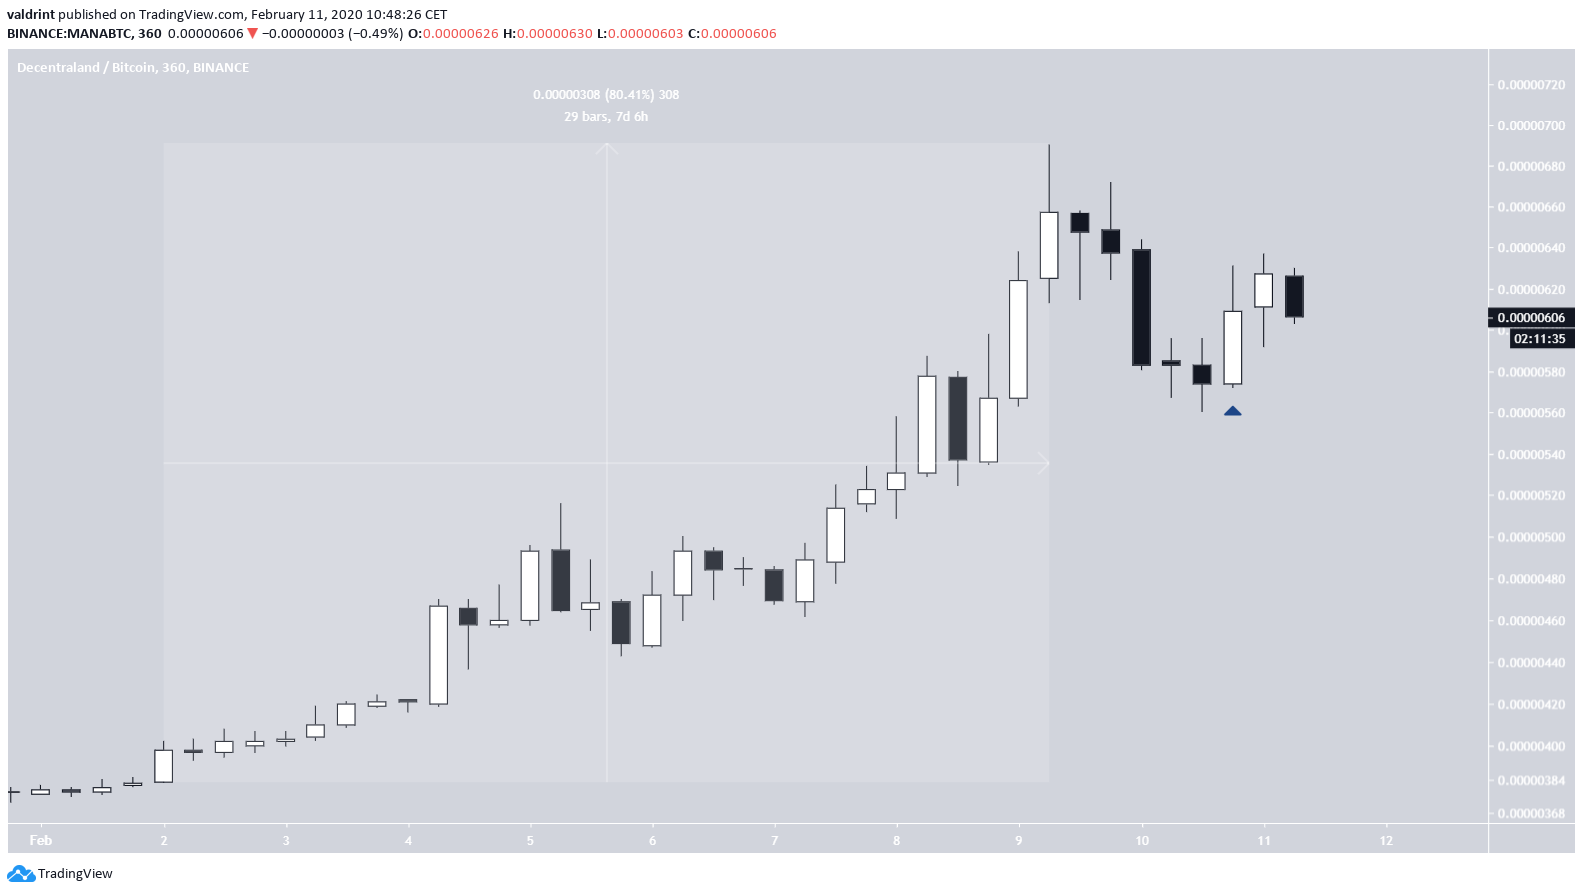
The announcement was made at 21:00 on Feb 10, so we marked this on the chart below.
Prior to that, the MANA price had increased by 80% in a span of one week, reaching a high of 690 satoshis on February 9 before decreasing slightly.
Therefore, the Coinbase listing seems inconsequential at first glance.
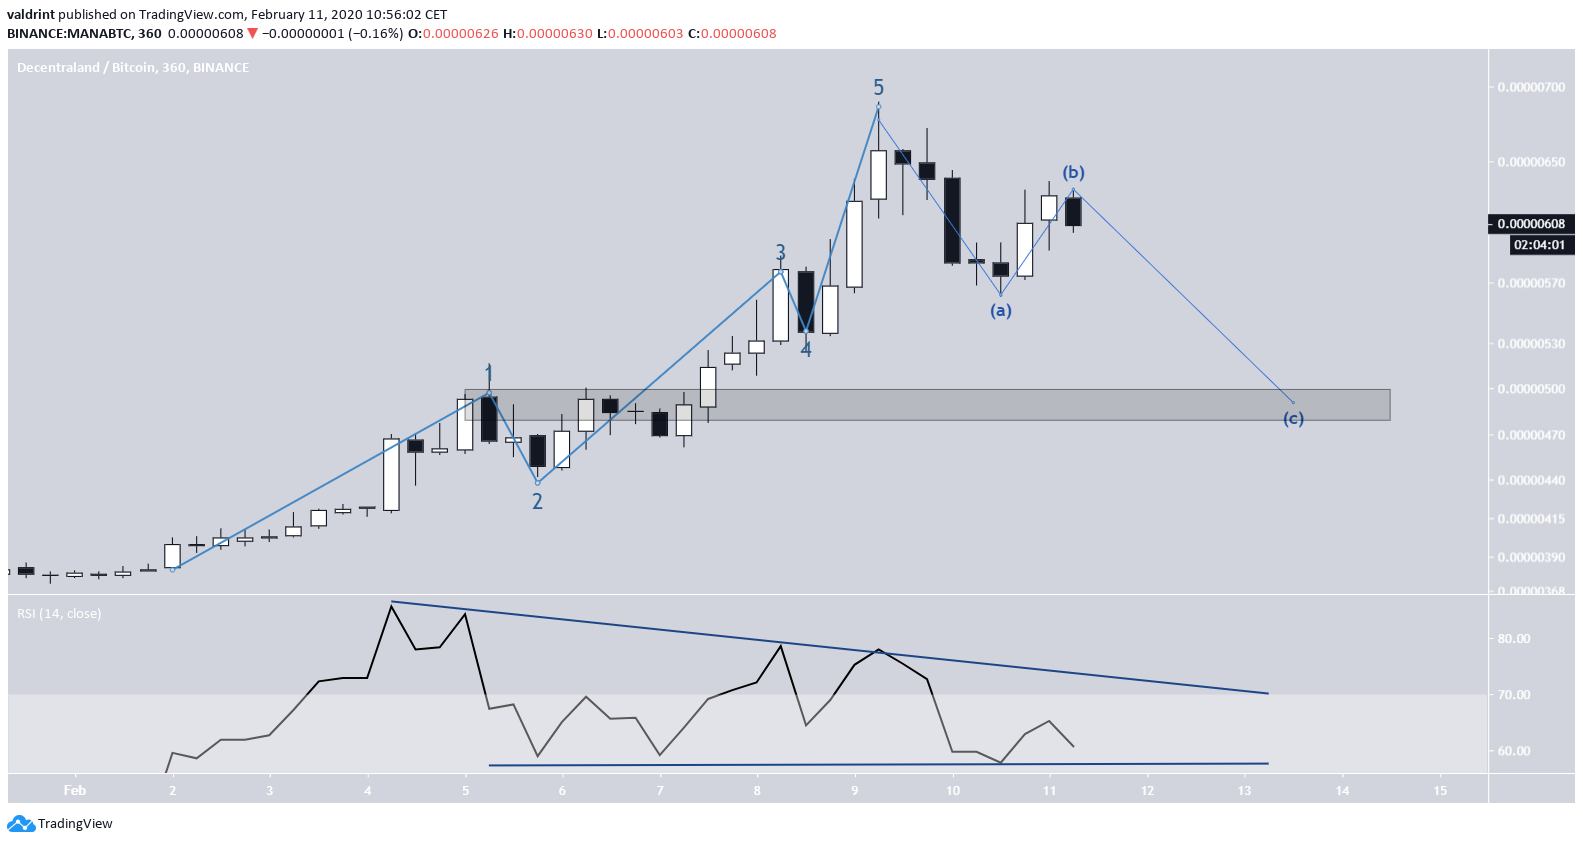
The price movement since February 2 resembles a five-wave Elliott formation. If so, the current price increase is the B-wave, prior to the C-wave decrease that finishes the correction. A likely level for the end of this correction is found at 490 satoshis, at the top of the first wave.
The RSI supports this continued decrease, since it has generated bearish divergence and created a descending triangle, which is a bearish pattern and out of which a breakdown is expected.
 Previous Breakout
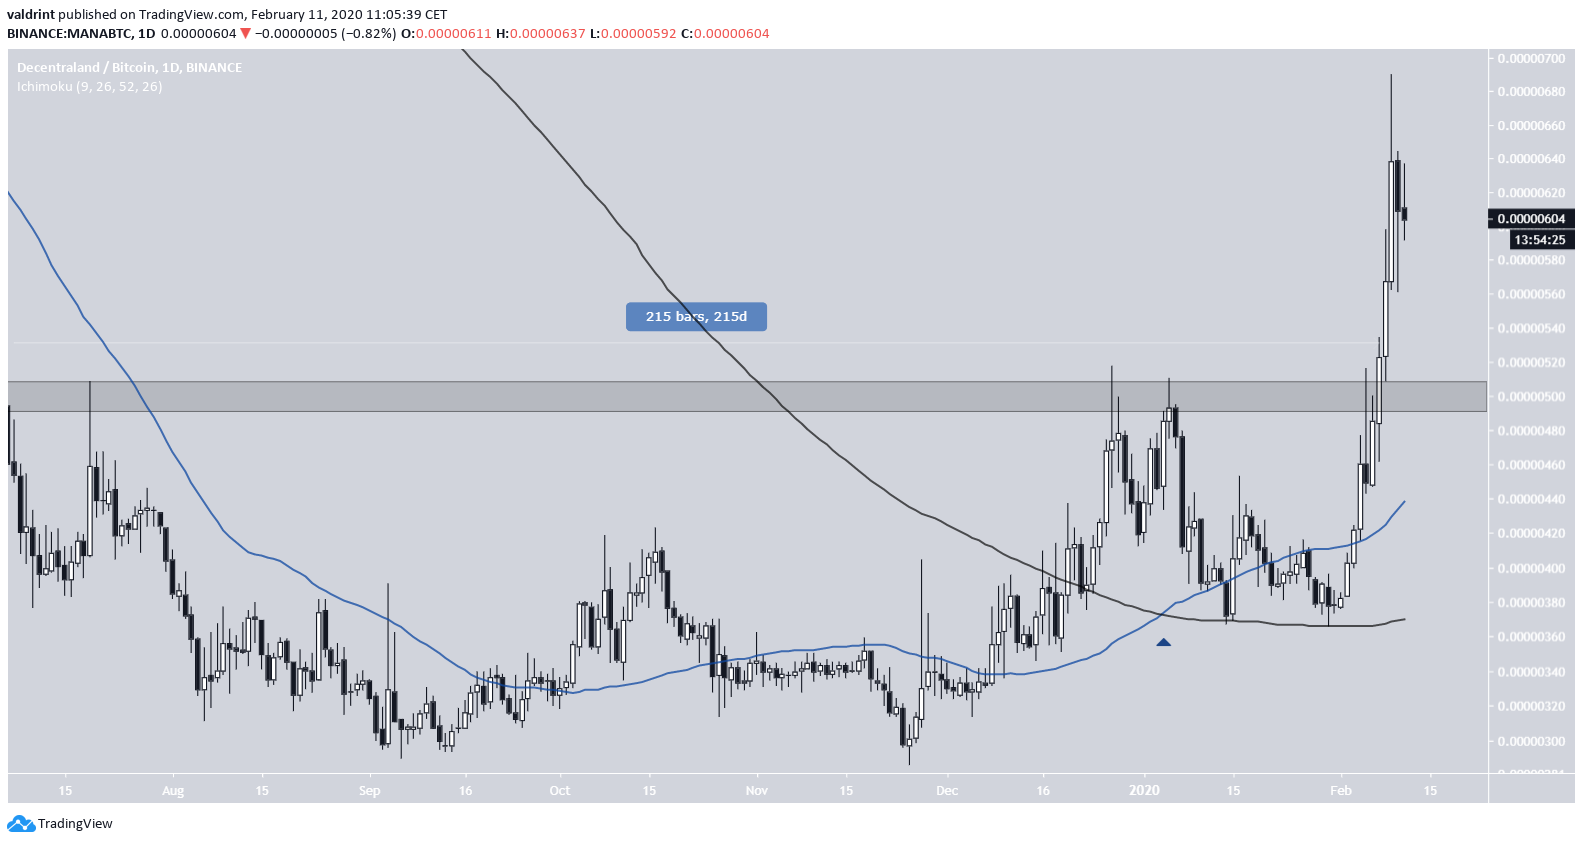
A look at the daily chart reveals the importance of the 490 satoshi level, since it acted as resistance for 215 days before the price finally broke out on February 7.
Prior to the breakout, a bullish cross transpired between the 50- and 200-day moving averages (MA) on January 5, signaling that the price has begun an upward trend.
Mana Future Movement
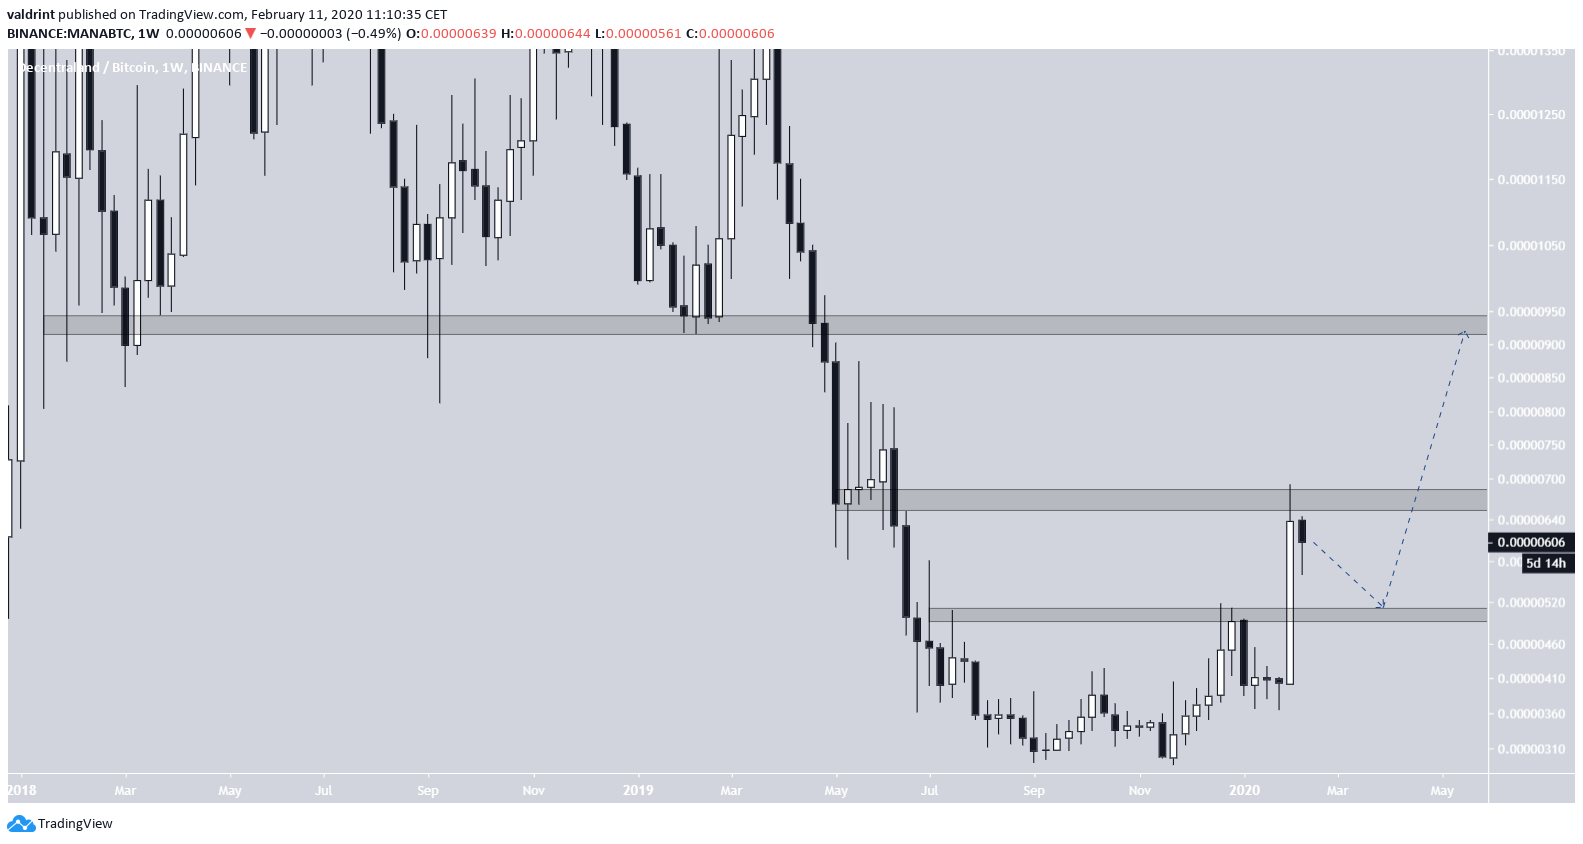
The weekly chart gives a clue as to why the price stalled prior to reaching 700 satoshis after the breakout since there is a strong resistance area at 670 satoshis.
If the price is successful in breaking through, the next major resistance area is found at 940 satoshis, which is the previous breakdown level.
Based on the price pattern and technical readings, the most likely movement is a re-test of the 490 satoshi area, validating it as support followed by a price increase that takes the price all the way to 940 satoshis.
To conclude, the MANA price has broken out above a significant resistance area. After a retracement that would validate this area as support, we believe the price will continue moving towards the two targets outlined above.
