
Decentraland (MANA) has been moving upwards since Jan 22 and has broken out from important diagonal and horizontal resistance levels.
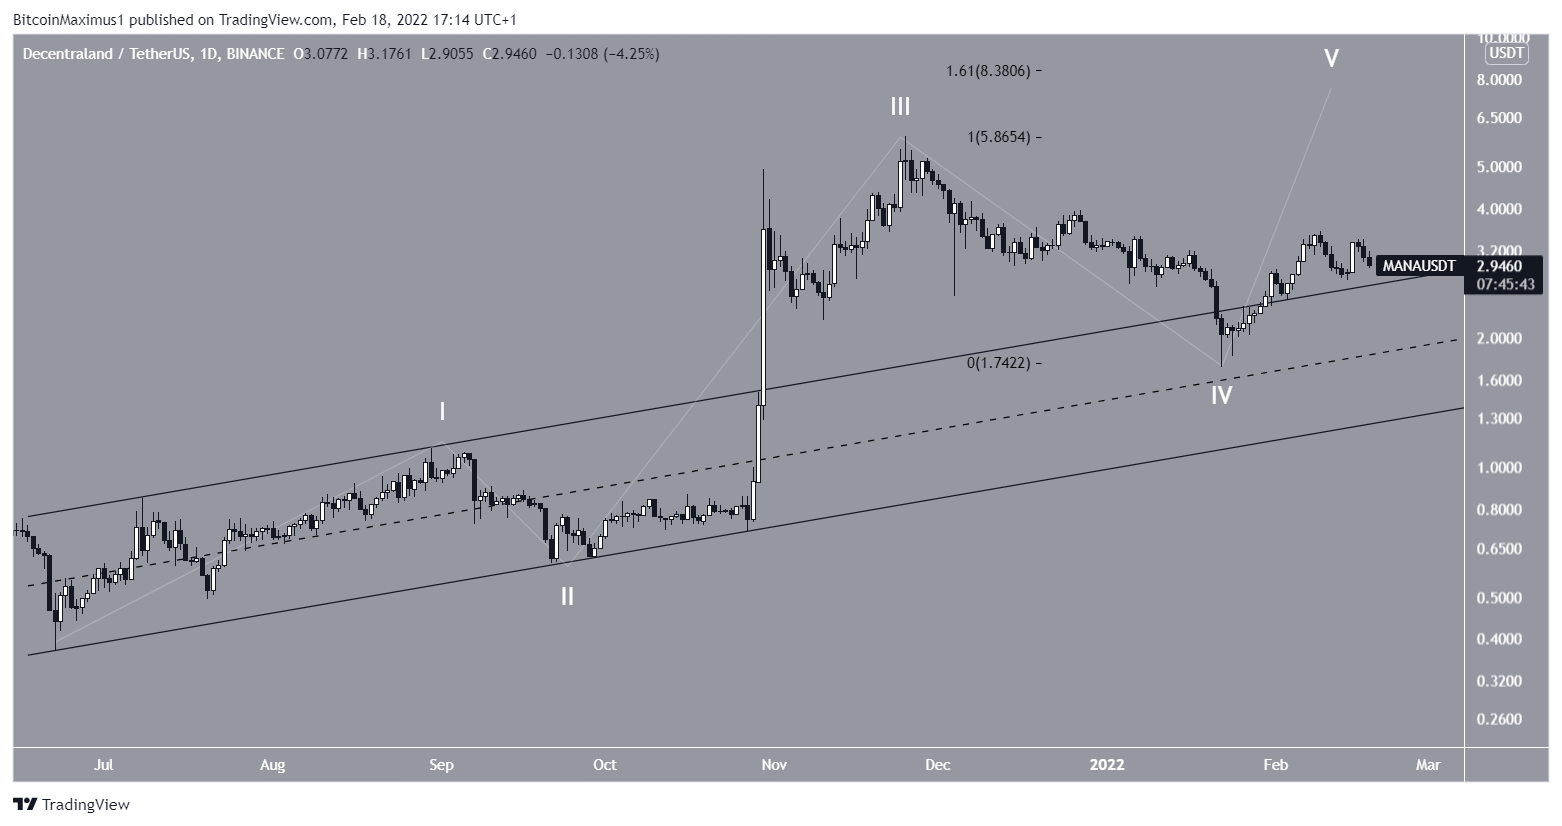
MANA has been decreasing since reaching an all-time high price of $5.90 on Nov 25. The decrease led to a low of $1.71 on Jan 22, which amounted to a drop of 71% measuring from the aforementioned all-time high price.
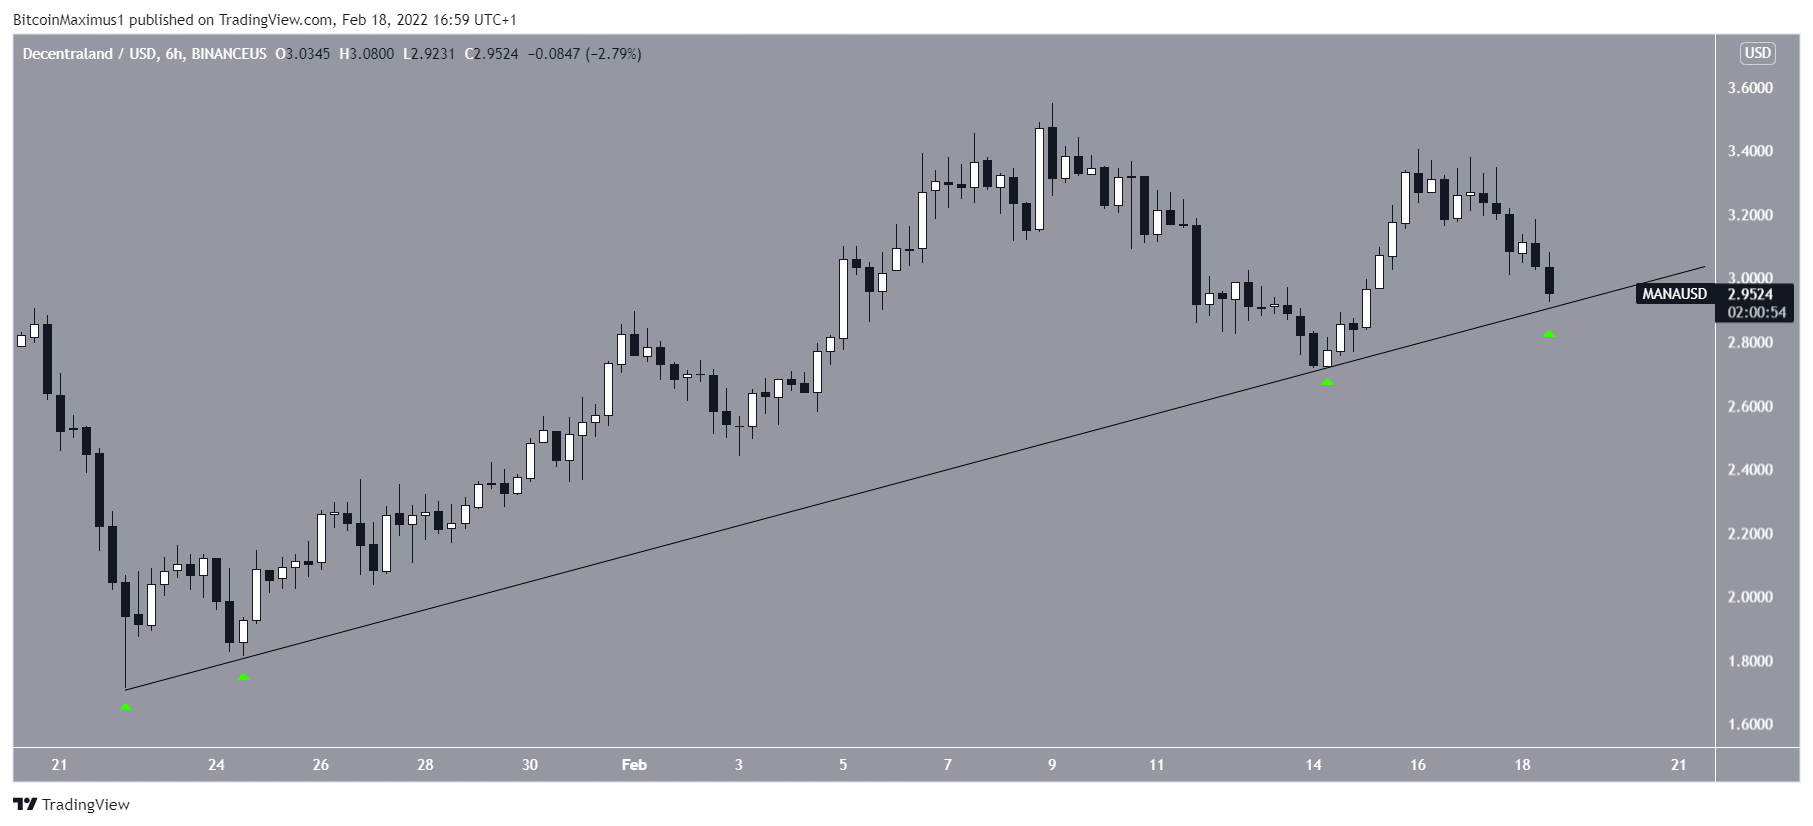
MANA has been increasing since and broke out from a descending resistance line on Jan 31. It validated the line as support two days later (green icon) before moving upwards once more, leading to a high of $3.55 on Feb 9.
The price has decreased slightly since.

Ongoing upward movement
The daily chart provides mixed signs.
On a bullish note, MANA has reclaimed the $2.85 horizontal area and is in the process of validating it as support. Previously, the area had acted as support since Nov 2021.
However, technical indicators are neutral.
The MACD, which is created by a short- and a long-term moving average (MA), is right at the 0 line. This indicates that the short- and long-term MAs are moving at the same speed.
Similarly, the RSI, which is a momentum indicator, is right at the 50 line. This is a sign of a neutral trend.
If the current support area holds, the next closest resistance area would be at $3.95.

The six-hour chart shows that MANA is following an ascending support line, which has so far been validated four times. The line coincides with the aforementioned $2.85 support area.
Therefore, as long as the price is trading above it, the bullish structure remains intact.
MANA wave count analysis
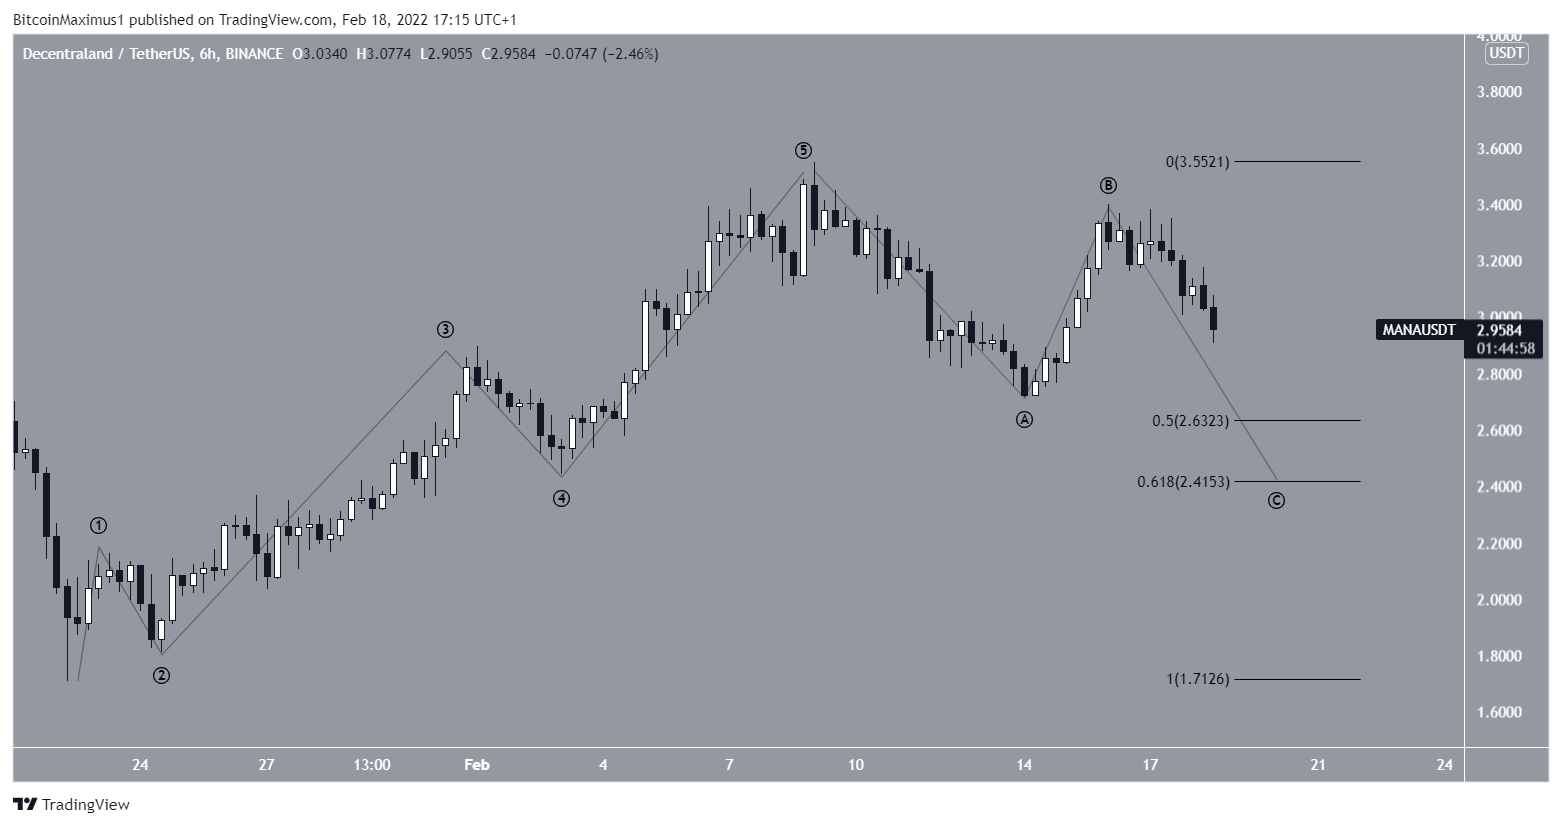
Cryptocurrency trader @Altstreetbet tweeted a chart of MANA, stating that the token is finishing an A-B-C corrective structure.

The long-term count suggests that the decrease measuring from the all-time high was part of wave four (white). It also completed a fourth wave pullback. The fact that the decrease was a three wave movement further supports this possibility.
If correct, MANA would gradually increase towards a new all-time high price.
The shorter-term outlook shows that MANA has completed a five wave upward movement and is now correcting.
The most likely level for this correction to end would be between $2.41 – $2.62, created by the 0.5-0.618 Fib retracement support levels.
For BeInCrypto’s latest Bitcoin (BTC) analysis, click here
Disclaimer
In line with the Trust Project guidelines, this price analysis article is for informational purposes only and should not be considered financial or investment advice. BeInCrypto is committed to accurate, unbiased reporting, but market conditions are subject to change without notice. Always conduct your own research and consult with a professional before making any financial decisions. Please note that our Terms and Conditions, Privacy Policy, and Disclaimers have been updated.
