


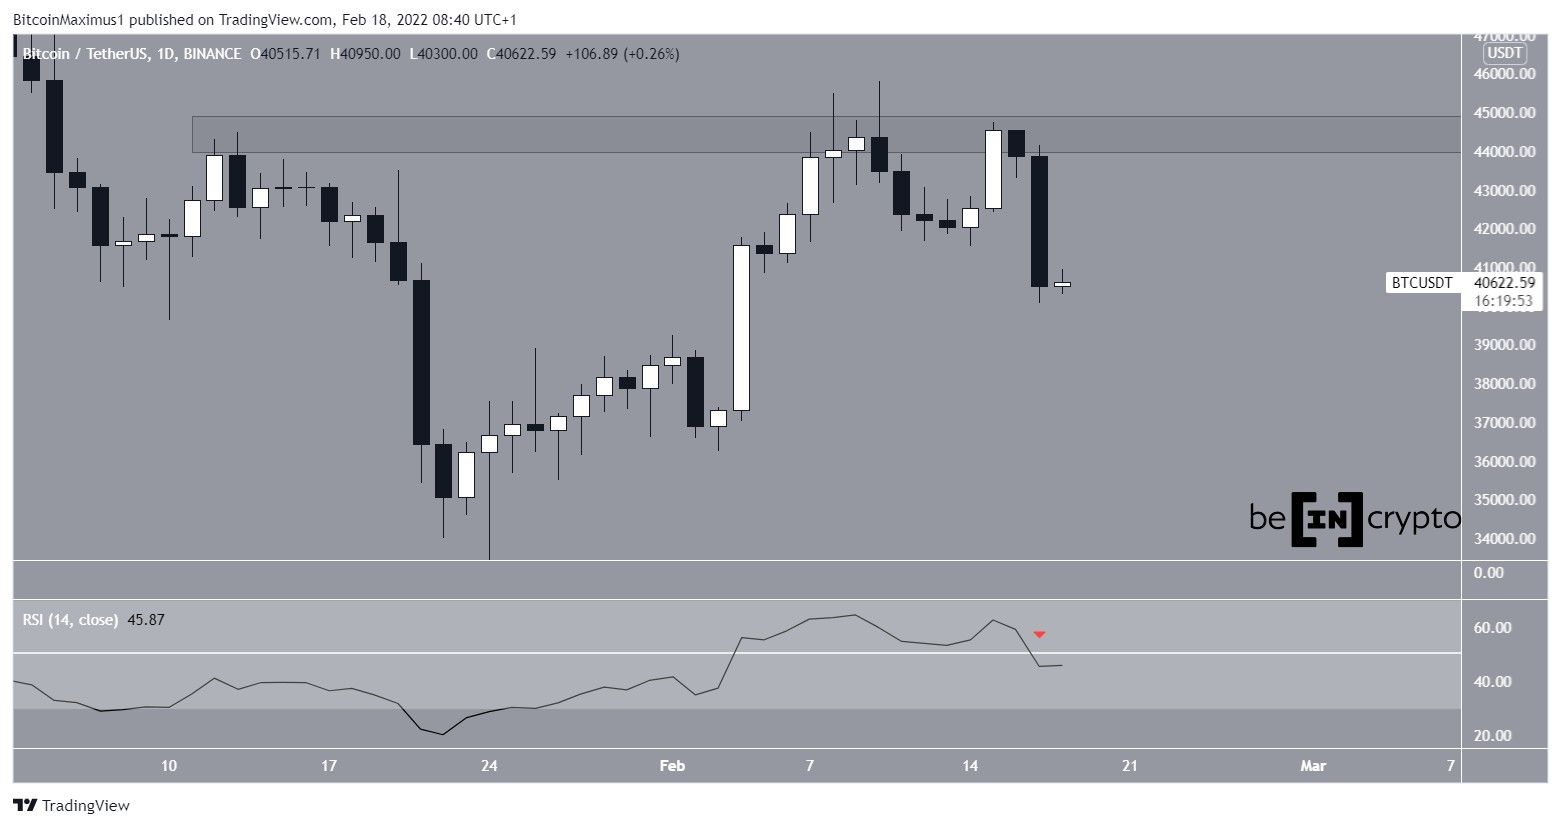
Bitcoin (BTC) fell sharply on Feb 17 and briefly traded below $40,000. However, it has bounced since and is attempting to hold on above its bullish structure.
Bitcoin decreased considerably on Feb 17, creating a bearish engulfing candlestick in the process. The downward move occurred after a rejection from the $44,300-$45,000 horizontal resistance range.
In addition to the significant drop, technical indicators are showing bearish signs. This is visible in the RSI (red icon), which has dropped below 50. The RSI is a momentum indicator and movements below 50 are considered bearish.
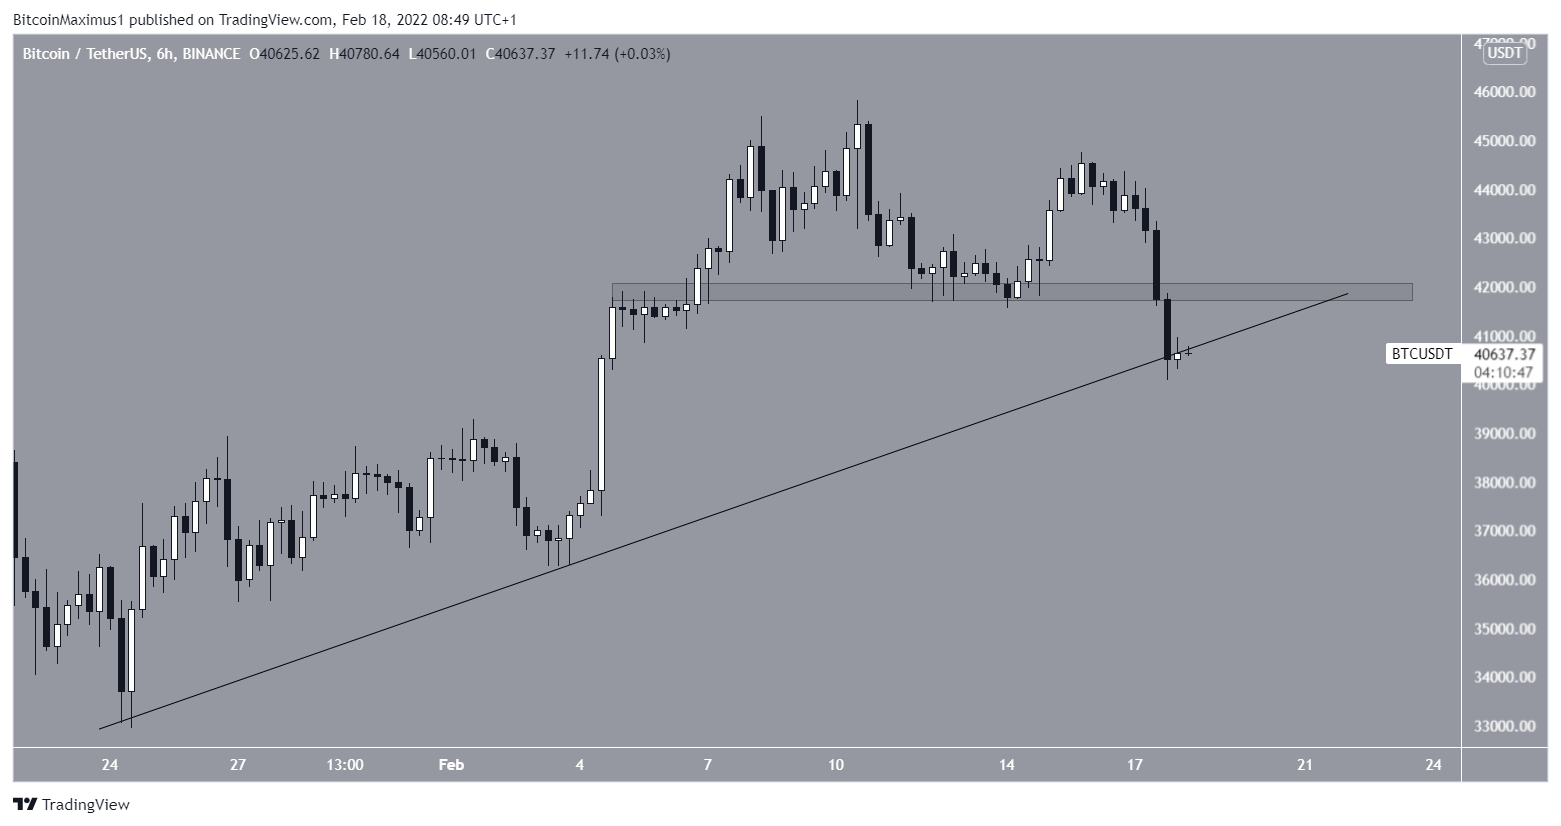
Short-term support
The six-hour chart shows that BTC is trying to hold on above an ascending support line that has been in place since Jan 24. A breakdown below it would put the entire bullish structure in doubt.
On another bearish note, BTC has failed to hold on above the minor $41,950 horizontal support area, which is now likely to act as resistance.
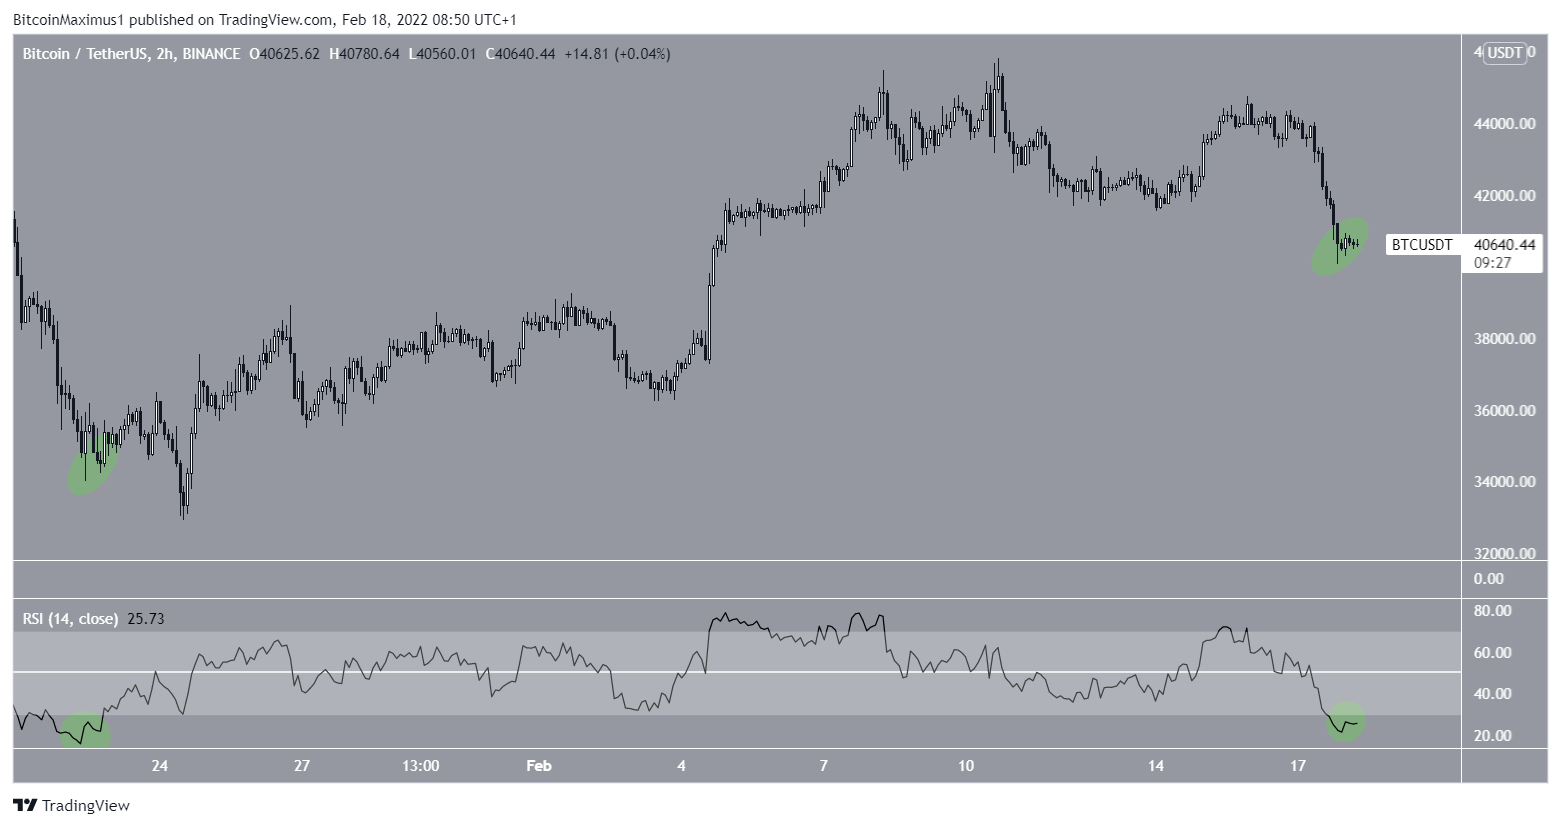
A look at the two-hour chart does not show any bullish divergences, which would be a sign that an upward move could still be on the horizon. However, it’s worth noting that the RSI has fallen into oversold territory (green circle). The previous time this occurred, BTC created an important local bottom.
BTC wave count analysis
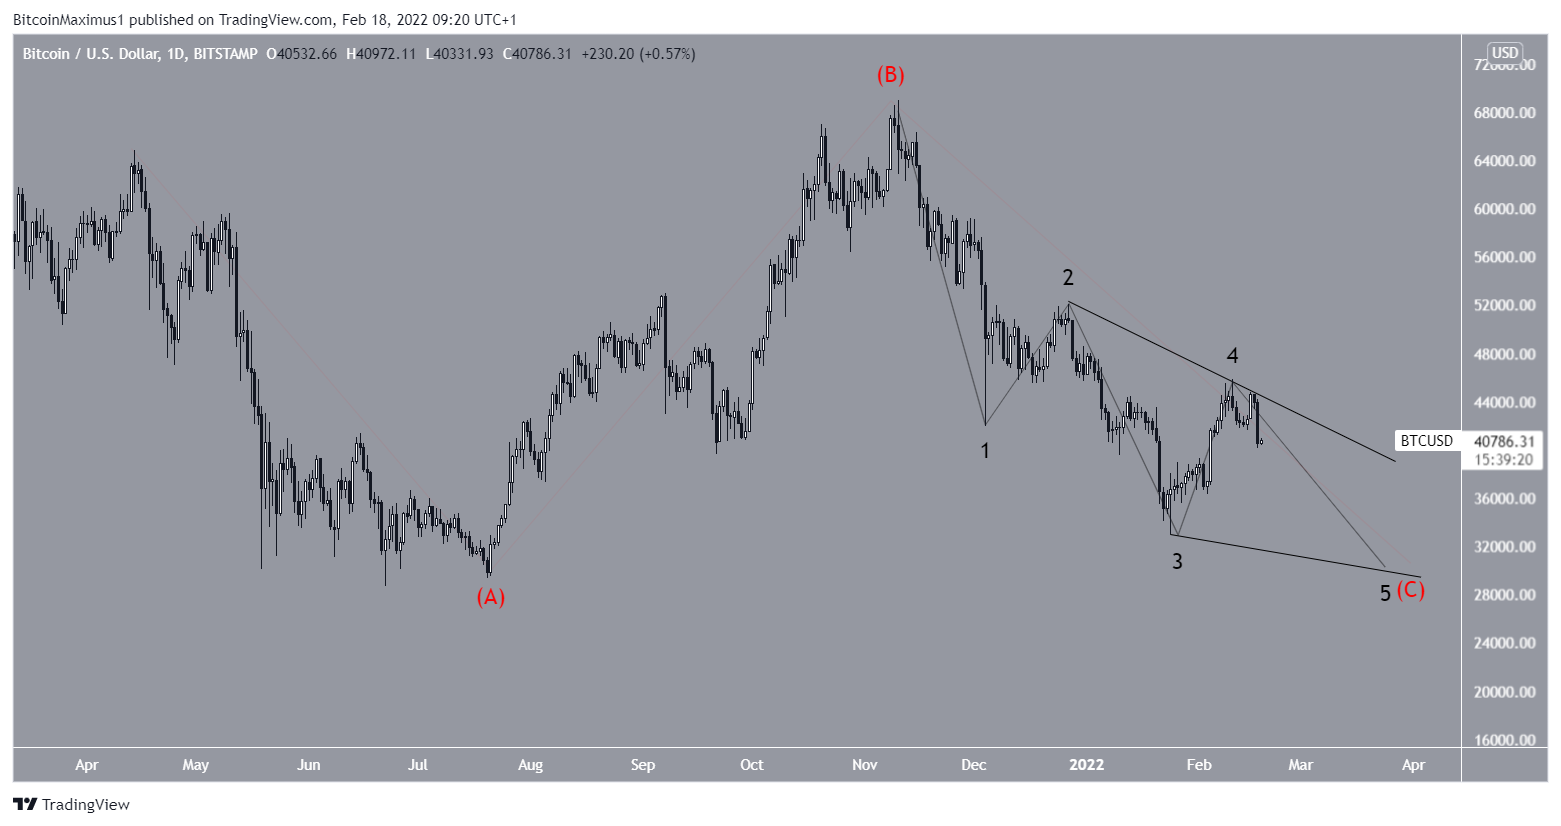
Due to yesterday’s drop, the possibility of the increase that began on Jan 24 being a five-wave upward movement is now at serious risk.
The reason for this is that the price is close to breaking down from the 1-2 trendline, which would invalidate this pattern.
Furthermore, if the ongoing decrease is the fourth wave (red), sub-waves A and C have had an exact 1:1 ratio (black).
Therefore, a continued drop would suggest that the decrease is corrective instead.
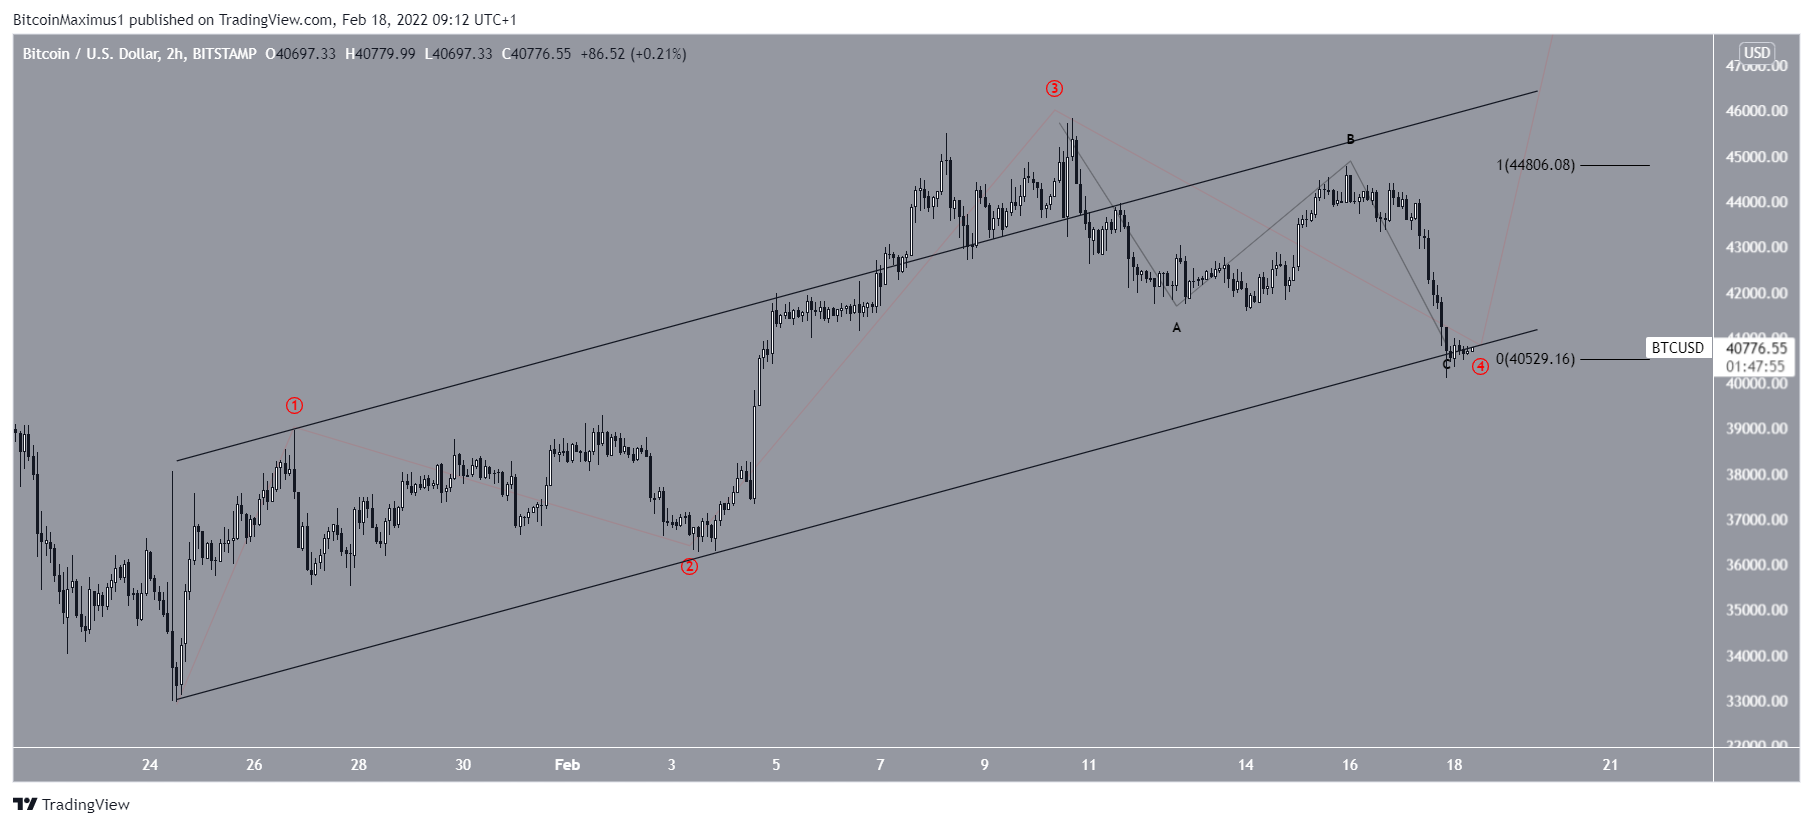
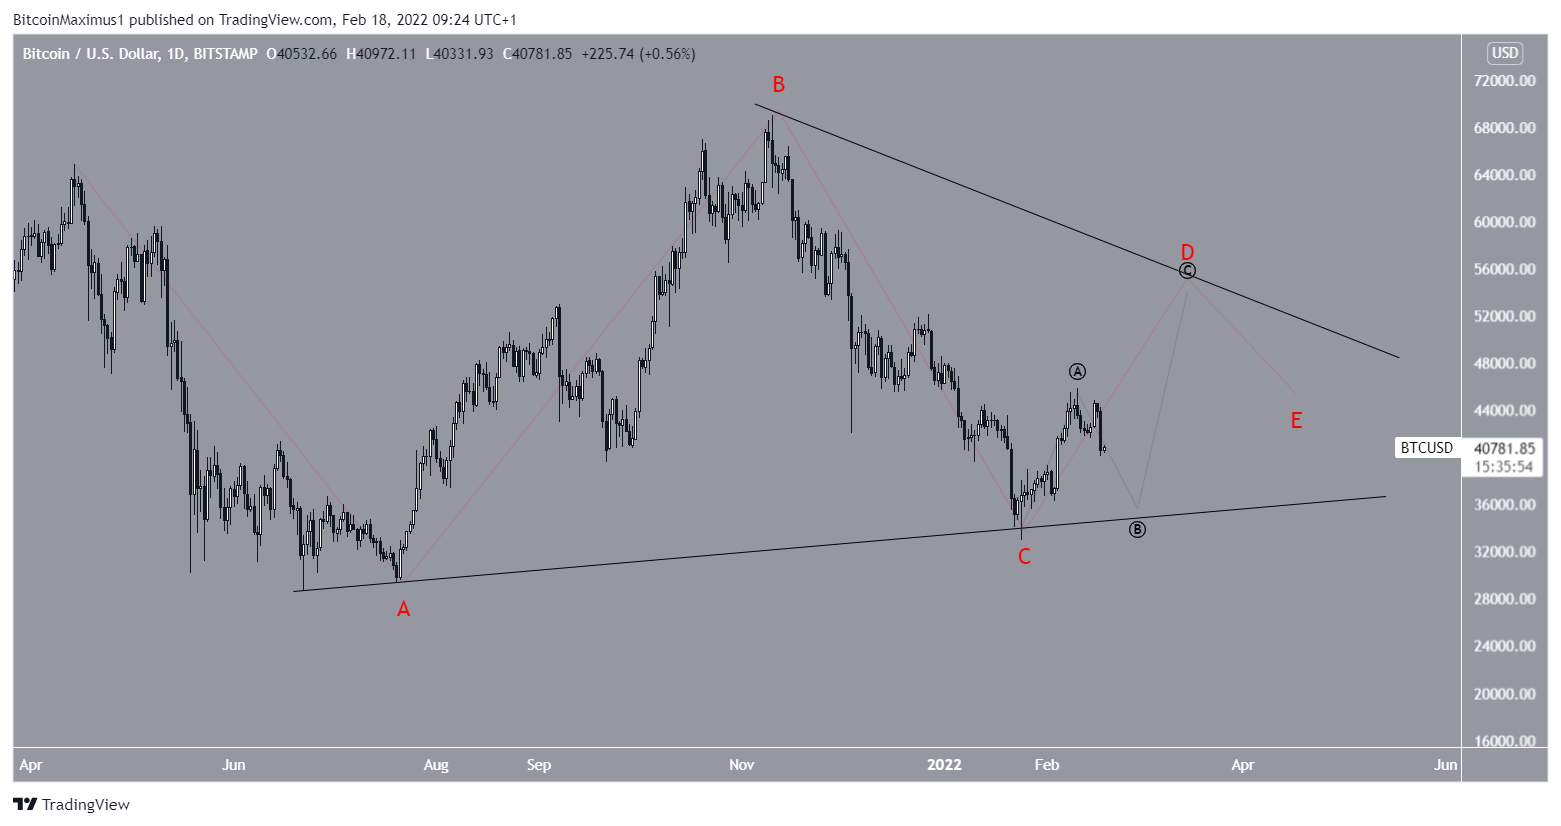
If this occurs, the long-term count would lean towards the entire movement being part of a large symmetrical fourth wave triangle.
In this scenario, BTC could fall towards $37,000 before increasing toward $50,000.
While the ending diagonal possibility is still valid, the sub-wave count is extremely irregular, casting serious doubt on its validity.
For BeInCrypto’s previous Bitcoin (BTC) analysis, click here


