
Decentraland (MANA) created a higher low relative to its May 12 bottom and broke out from a short-term pattern afterwards.
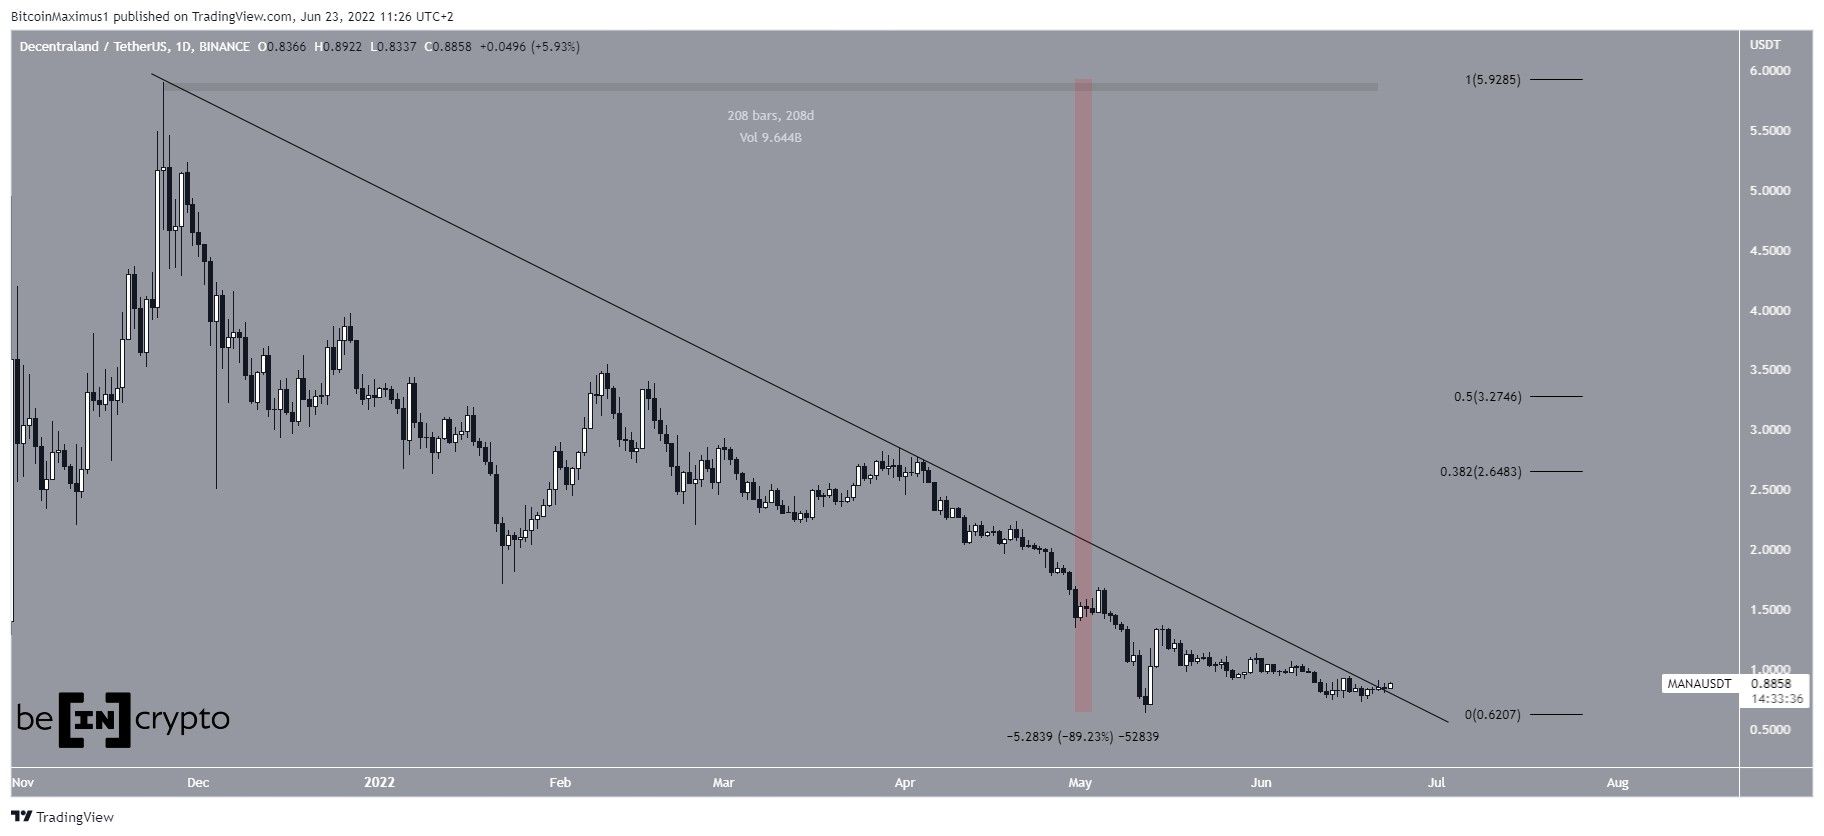
MANA has been falling underneath a descending resistance line since reaching an all-time high price of $5.90 in Nov. 2021. More recently, the line caused a rejection in March 2022, leading to a low of $0.62 on May 12. This amounted to a drop of 89% measuring from the all-time high.
The price has been increasing since and broke out from the resistance line on June 21. Prior to the breakout, the line had been in place for 208 days. If the upward movement continues, the next closest resistance area would be between $2.65 and $3.25. This is the 0.382 -0.5 Fib retracement resistance area.
Short-term breakout
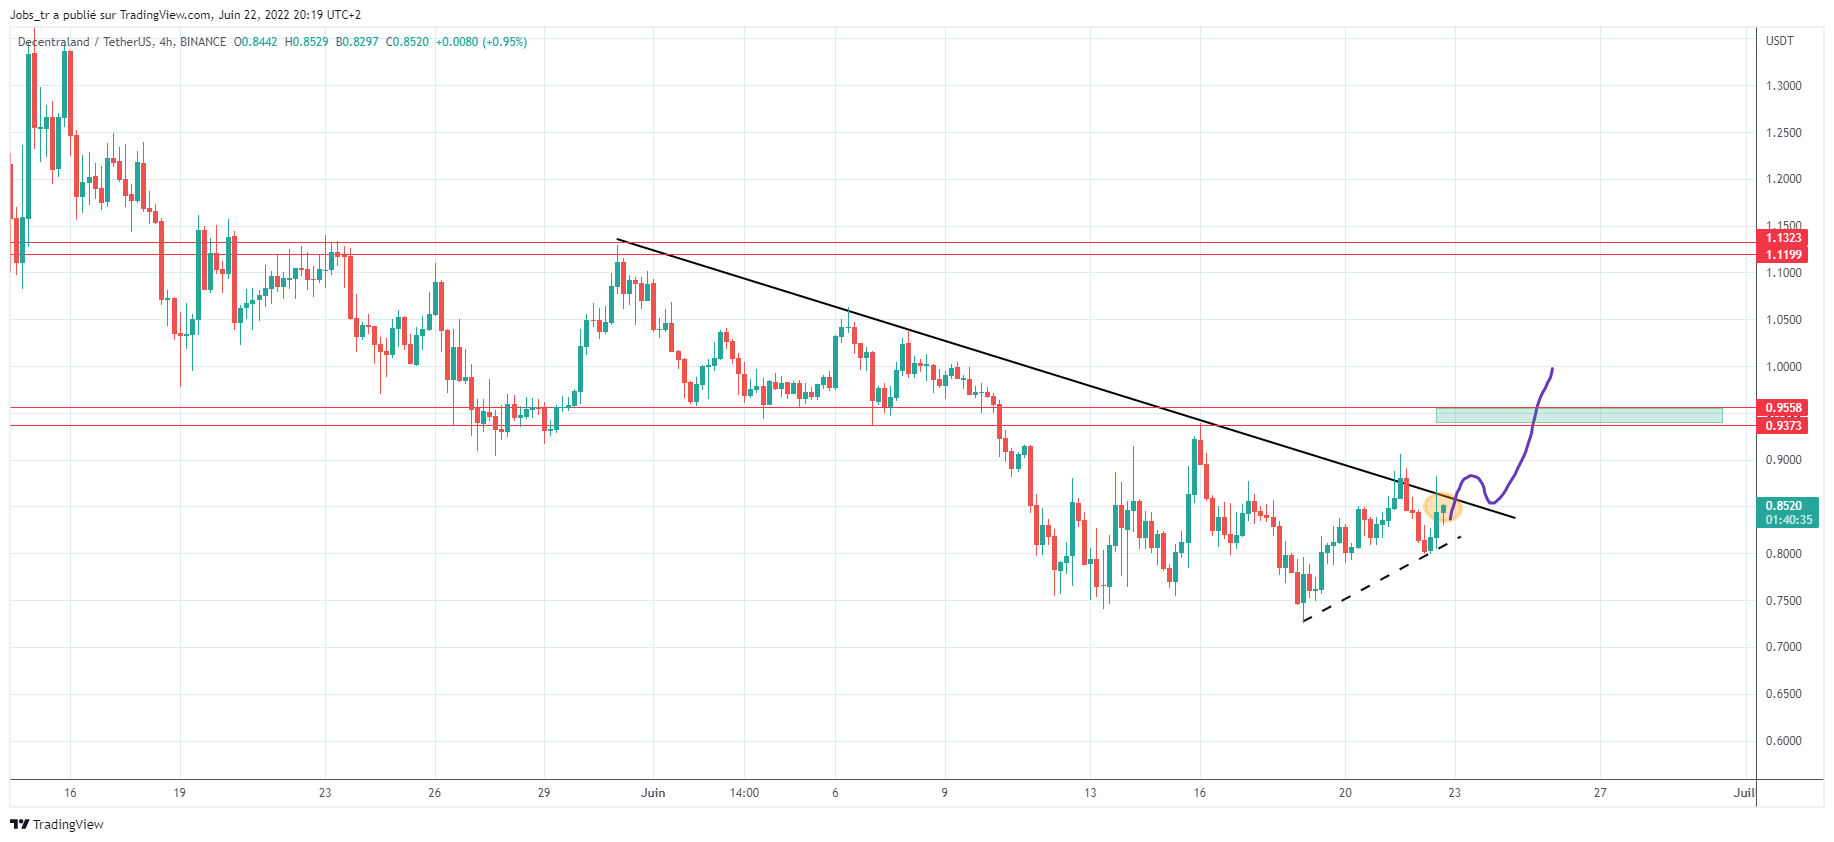
Cryptocurrency investor and trader @Cryptojobs3 tweeted a MANA chart, stating that the price has broken out from a descending resistance line and can increase towards $1.
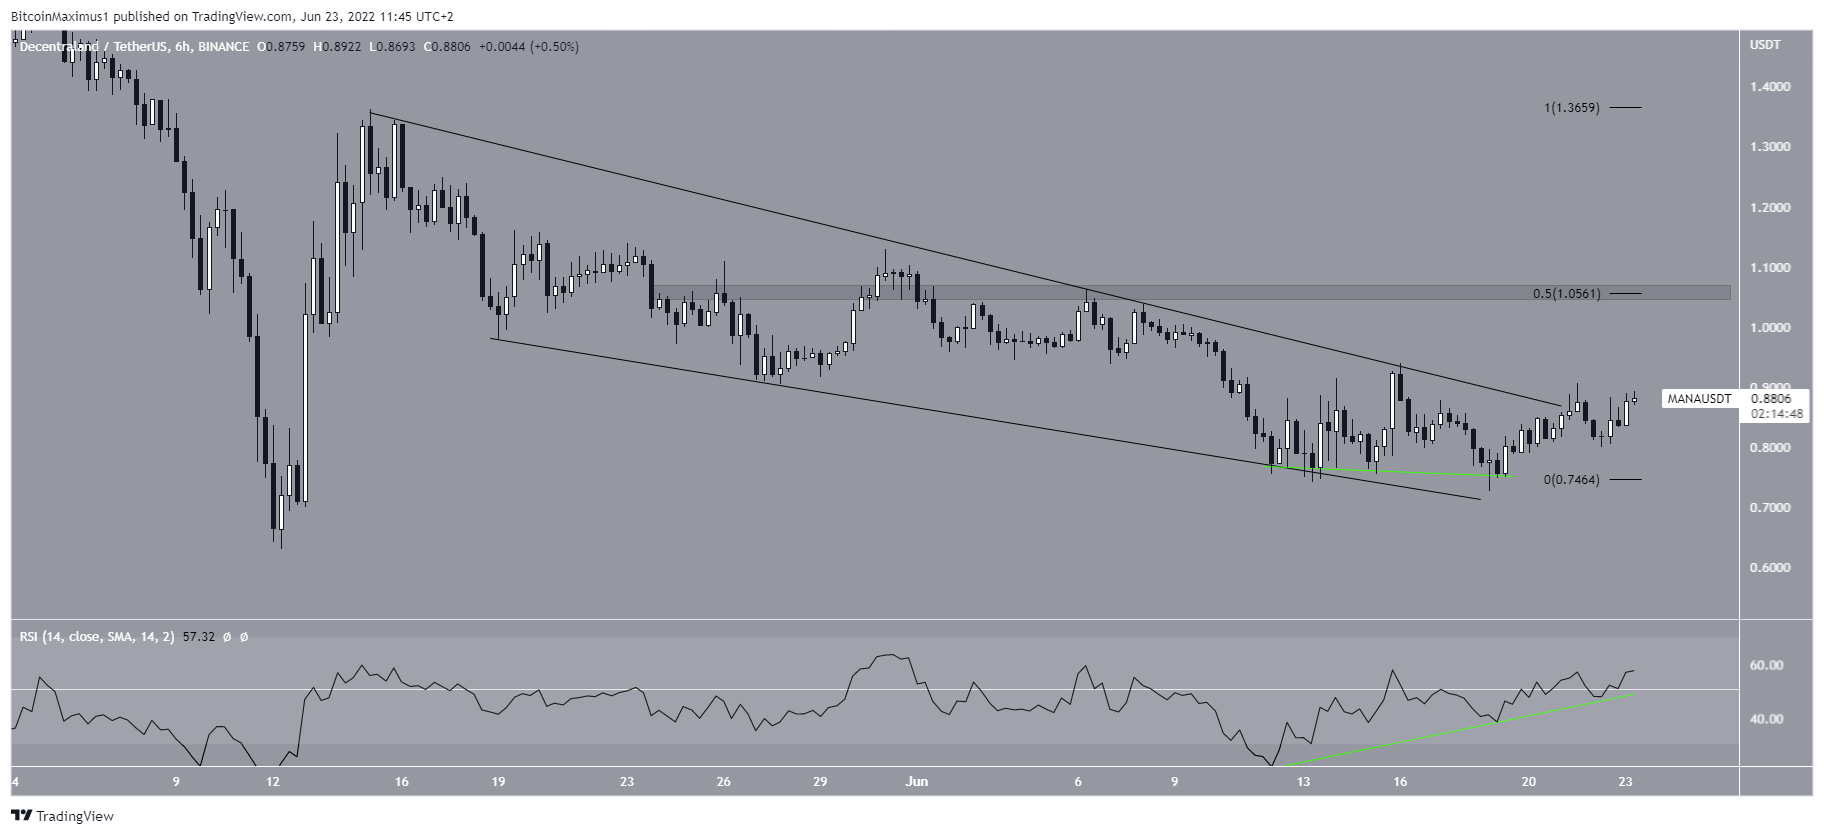
The six-hour chart shows that the price has already broken out from a descending wedge. The descending wedge is considered a bullish pattern, meaning that a breakout from it is the most likely scenario.
Moreover, the breakout transpired after the RSI generated bullish divergence, further increasing its legitimacy.
If the upward movement continues, the first minor resistance area would be at $1.05.
MANA wave count analysis
The wave count suggests that it is possible that the price completed an A-B-C corrective structure measuring from the all-time high.
While the sub-wave count is not clear, waves A:C has had a 1:0.618 ratio, supporting the possibility that this is the correct count.
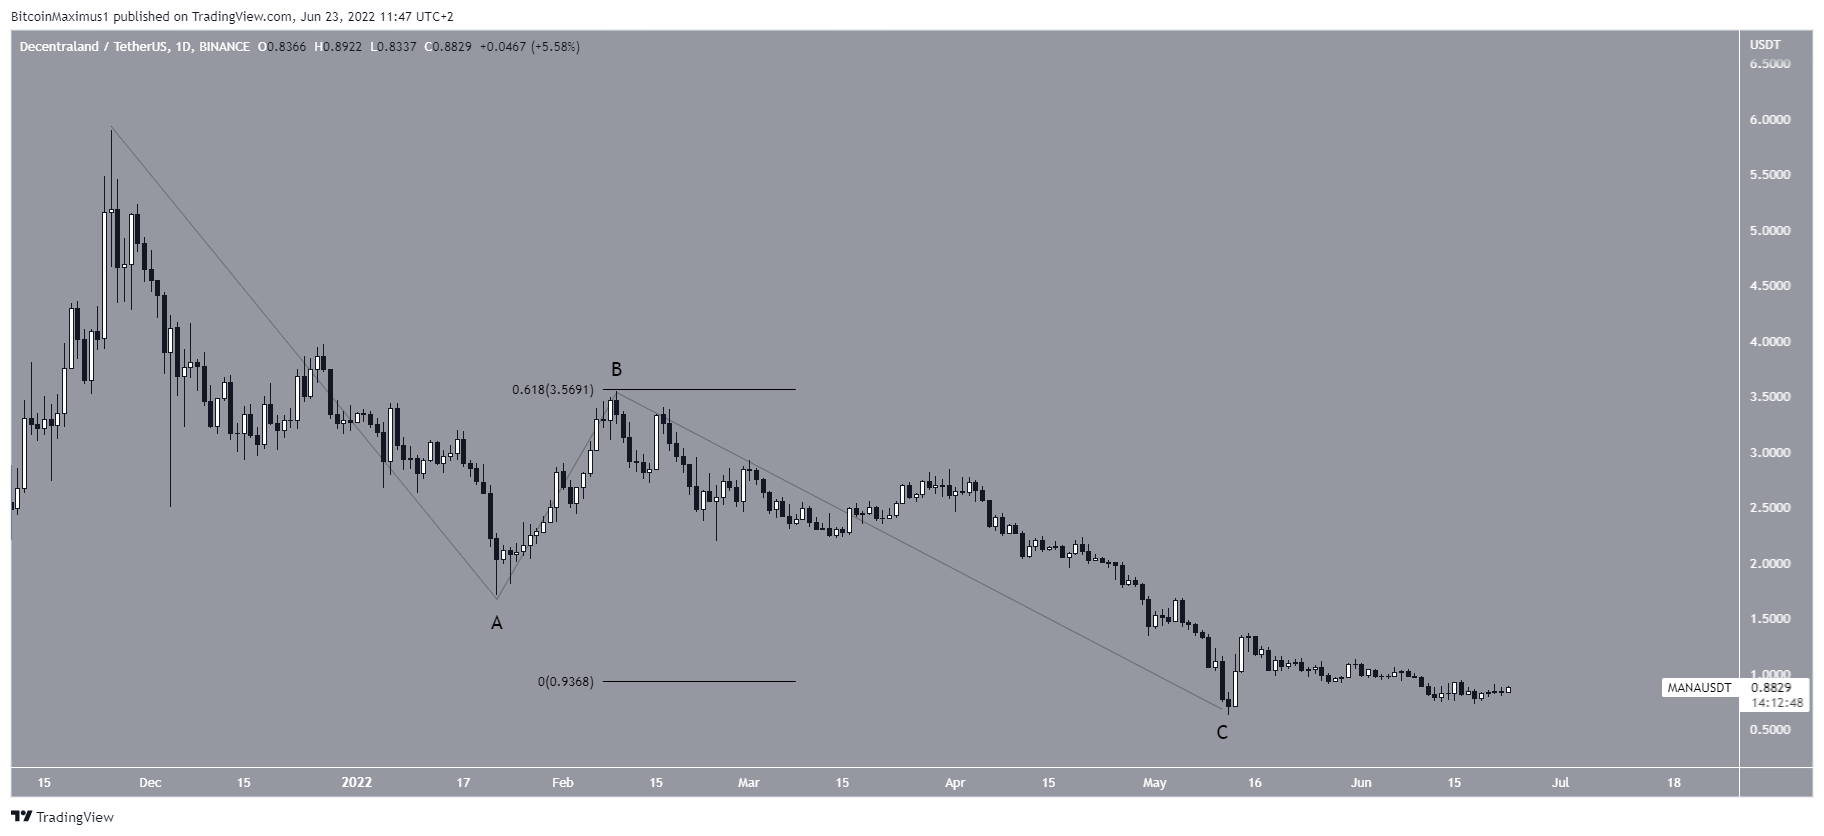
Additionally, the upward movement since May 12 does look like a five-wave structure. The fact that the price has made a higher low further supports this possibility.
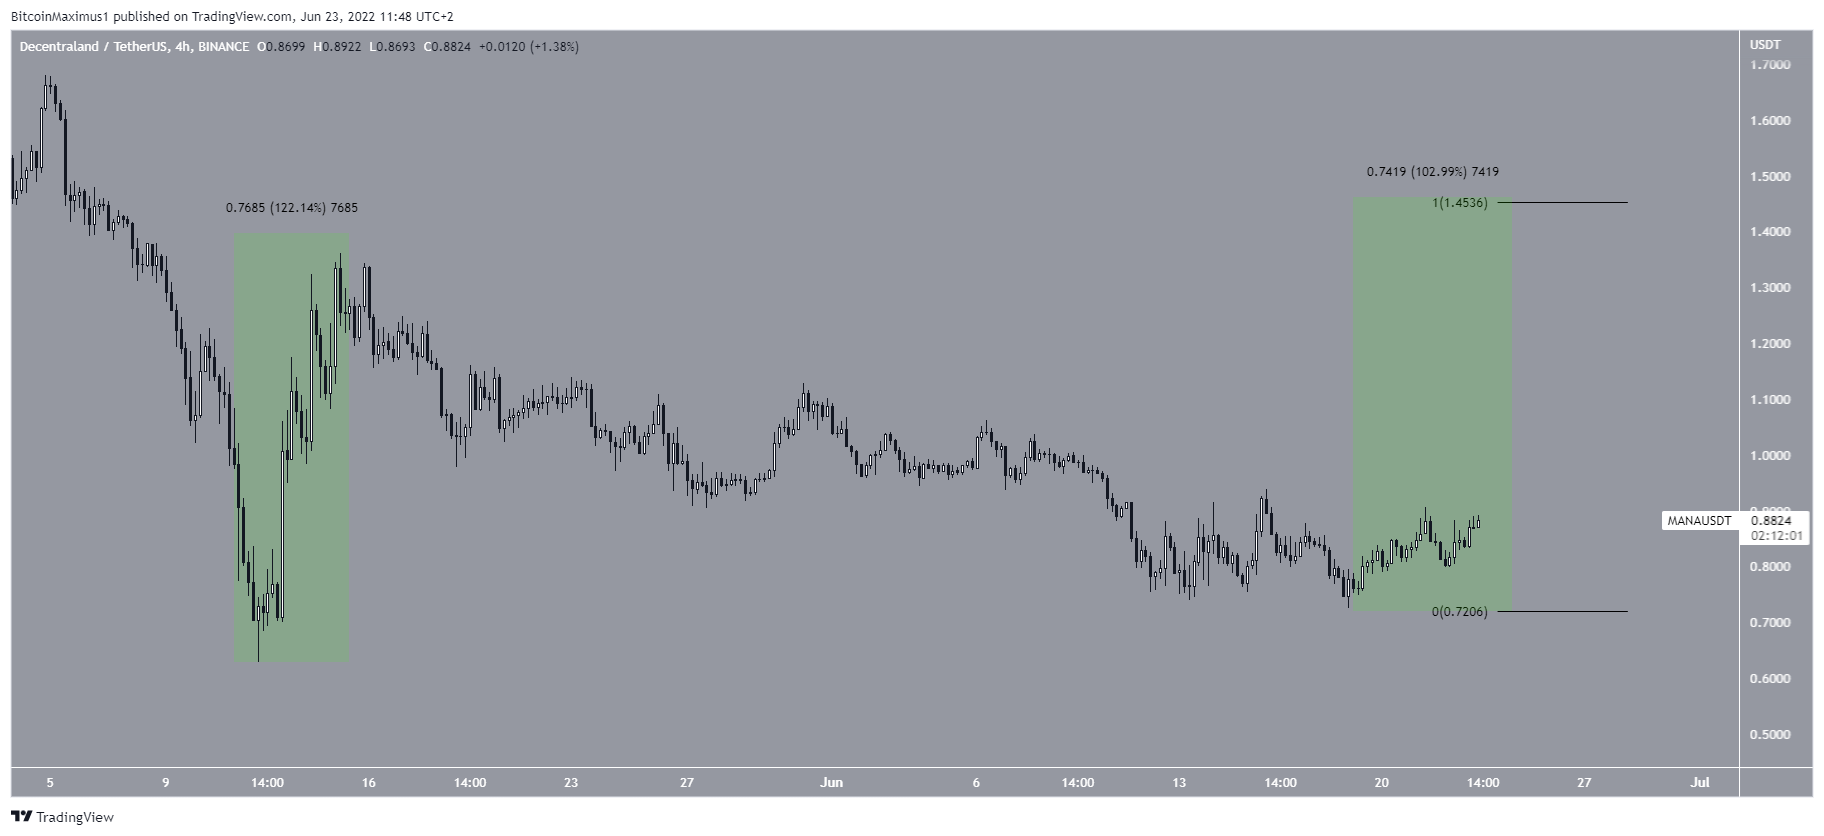
So, while it is not yet certain if the pump is a full bullish reversal or just a corrective bounce, an increase that has at least the same ratio would still be expected.
If this occurs, it would lead to a high of $1.45.
For Be[in]Crypto’s previous bitcoin (BTC) analysis, click here
