


The DASH price just broke out above a 164-day descending resistance line, possibly suggesting that the current downtrend has ended.
The breakout transpired with significant volume. However, the price has reached a confluence of resistance areas, making it unlikely that it will be successful in moving above them on the first try.
Full-time trader Nico (@CryptoNTez) stated that the DASH price has shown increasing volume while it attempts to break out from a long-term descending resistance line. Additionally, he stated that the current price level is full of potential resistance.
Showing nice volume activity on Binance (ATH) as it breaks from descending trendline…
UCTS showing buy signals on the 1D & 2D (not confirmed yet)
Current zone overcrowded of potential resistance levels, so look for R/S Flips or retests as potential entries..#DASH pic.twitter.com/Aau22gUwPT
— Nico (@CryptoNTez) January 6, 2020
Will DASH be successful in moving above this resistance area? Let’s take a closer look at the price movement and find out.
Trendline Breakout
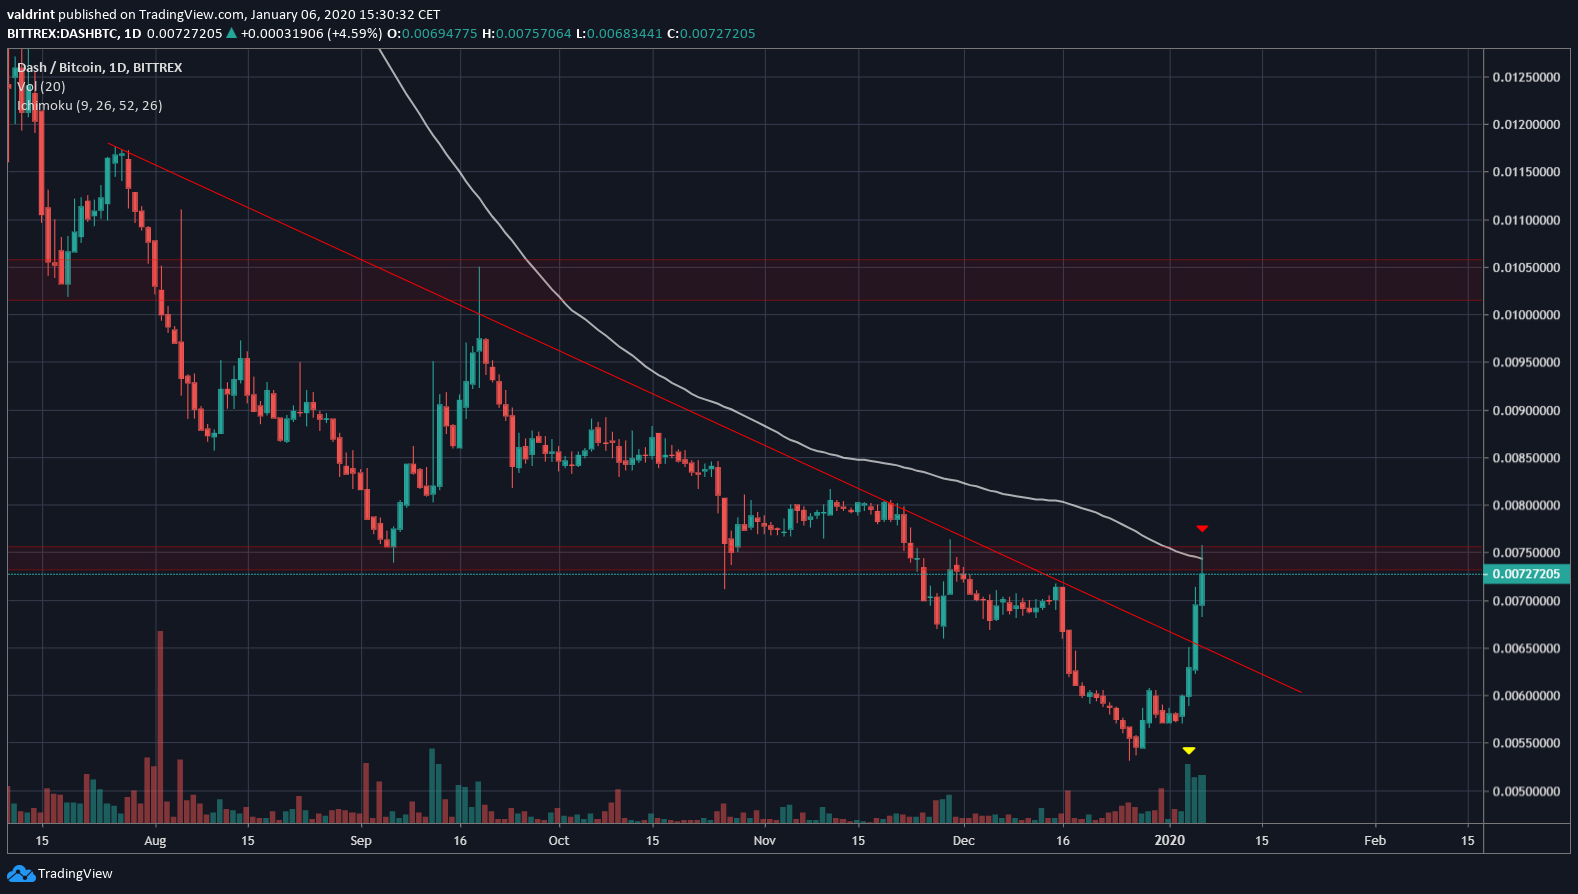
Beginning on June 27, the DASH price began to follow a descending resistance line that was validated four times.
The price broke out above this line on January 5 and did so with relatively high volume. The rally stopped once the price reached the ₿0.075 resistance area, which acted as support in the period between September-November. Additionally, this area coincides with the 100-day moving average (MA), further strengthening its significance.
2015 Fractal
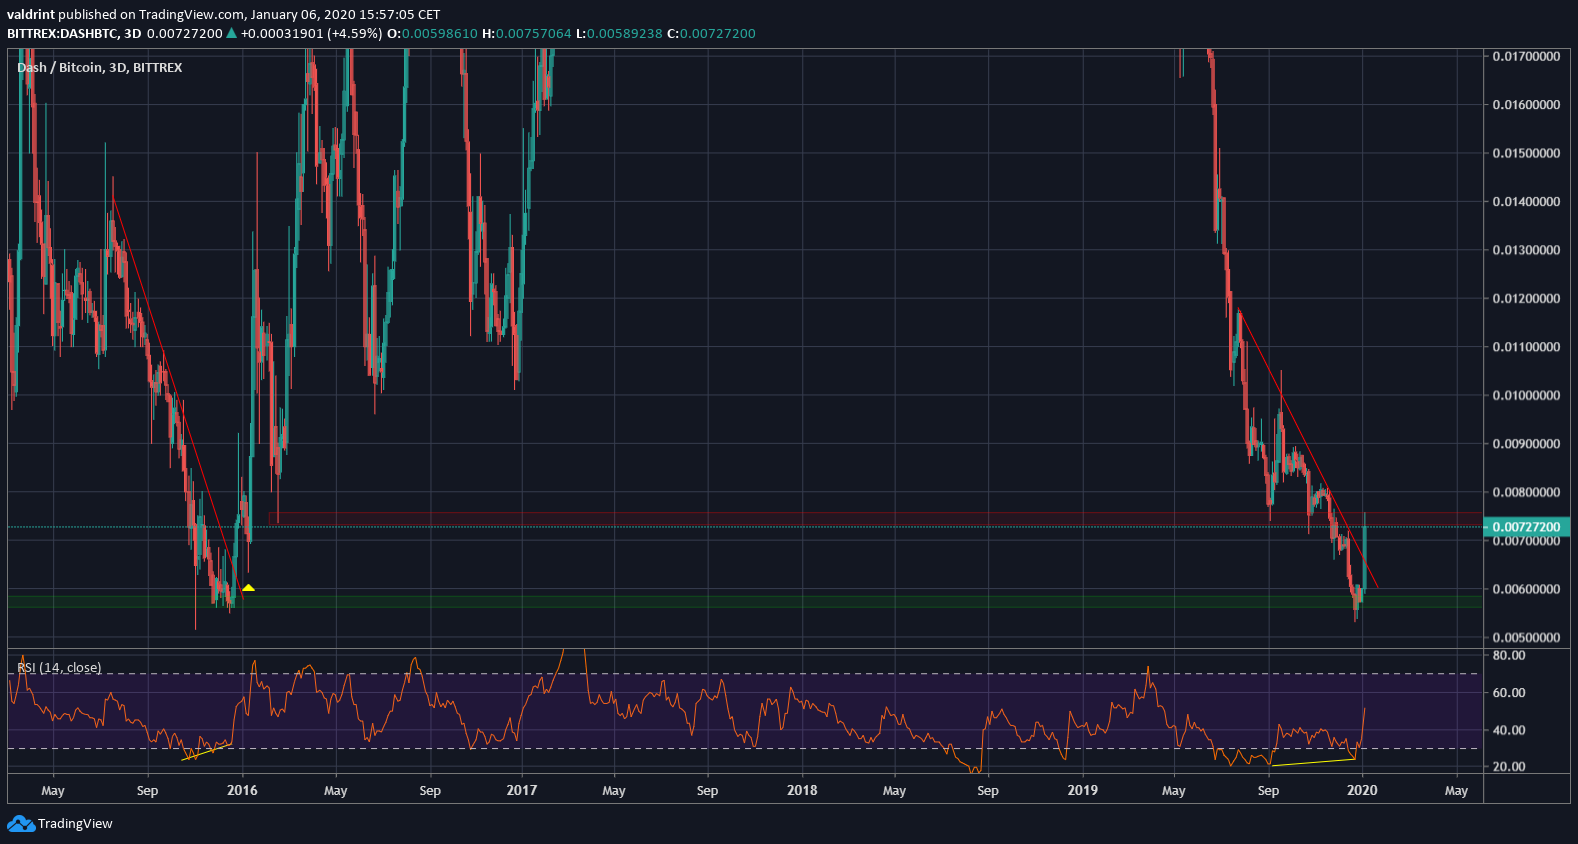
It is possible that the DASH price is in a similar position to what it was in December 2015. In both cases, the 3-day RSI was oversold and had generated bullish divergence.
Additionally, the price broke out above a long-term descending resistance line. The price decrease to validate it afterward in January 2016, before resuming its nearly two-year-long bullish market. If the price were to do so again, the potential validation of the descending resistance line would act as the most profitable level to potentially re-enter the market.
DASH Trading Opportunities
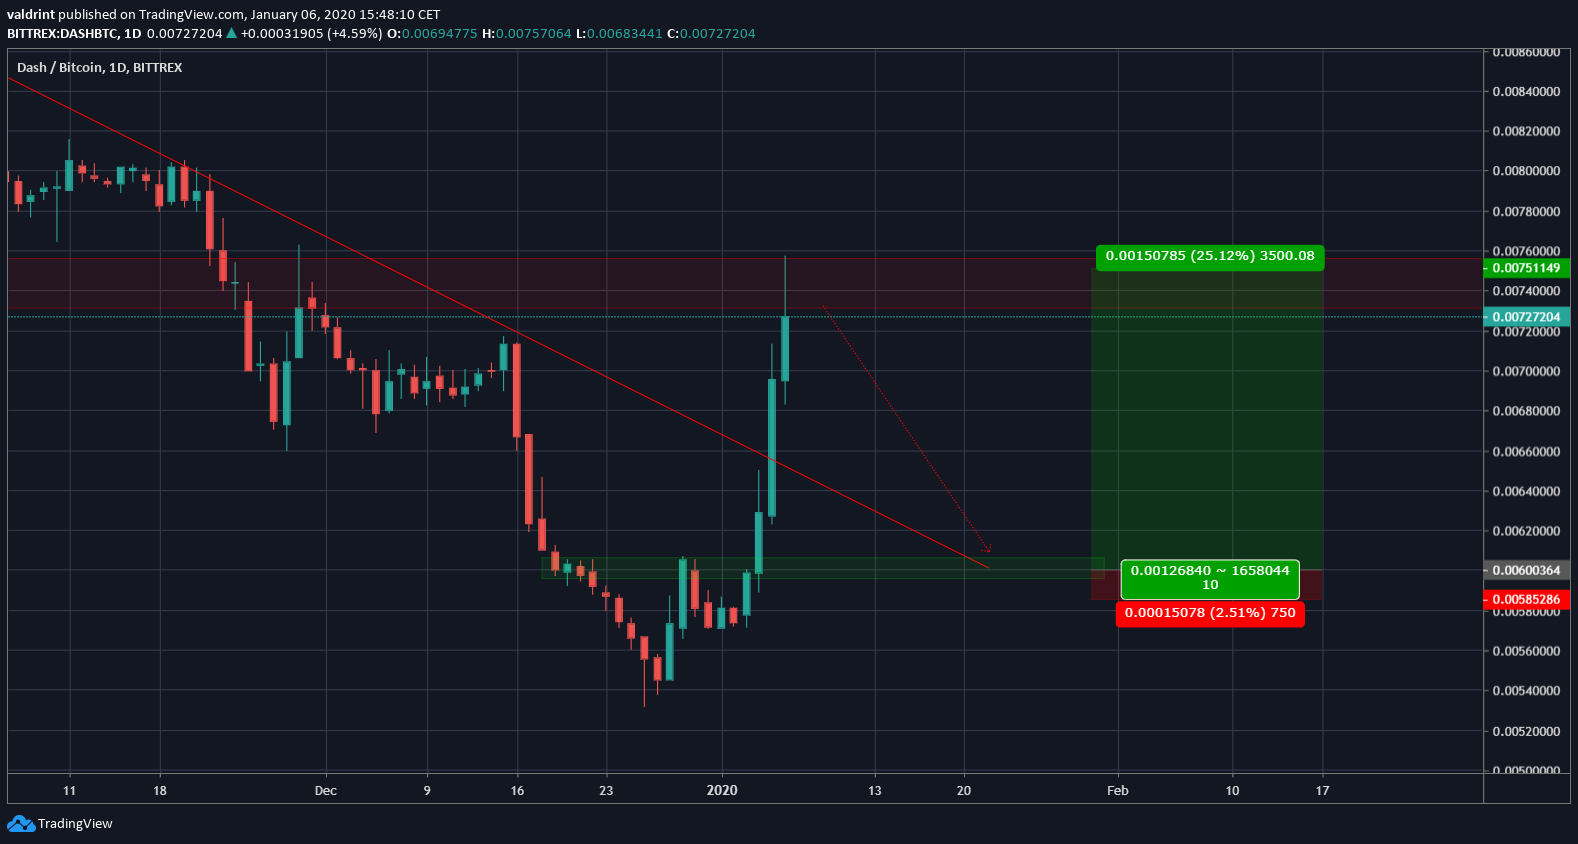
The tweet states that the best trading opportunities are likely to arise if the price retests a previously significant resistance area.
In order to validate the previous resistance line, the price could decrease to ₿0.06, which was also the previous resistance area. Initiating a long at that level with a stop loss around ₿0.058 would offer a 1:10 risk-to-reward ratio merely for a retest of the current resistance area at ₿0.075.
This is not to say that the price will decrease all the way there, rather an illustration of possibly profitable price levels for the initiation of a long trade.
To conclude, the DASH price recently broke out above a long-term descending resistance line. It is possible that this is the beginning of a long-term upward move. However, a short-term retracement is likely before the price makes another attempt at breaking out above the current resistance area.
