

Curve DAO Token (CRV) has bounced at both horizontal and diagonal long-term support levels. As long as it does not break down below them, the trend can be considered bullish.
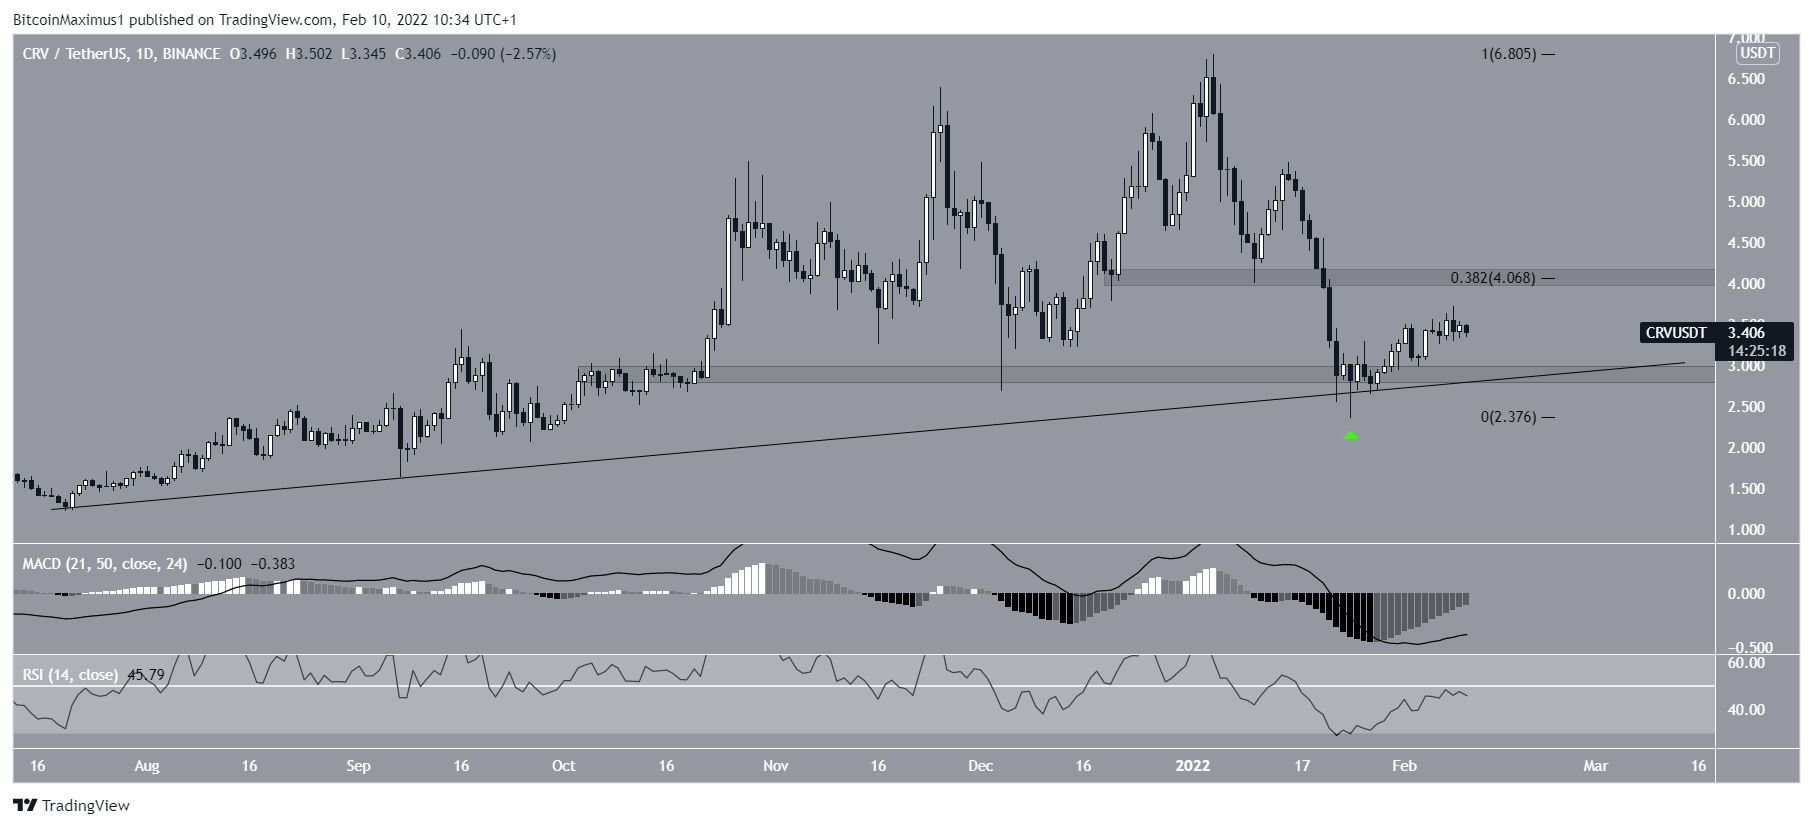
The weekly chart shows that CRV has been falling since reaching an all-time high price of $6.40 on Jan 4. The downward movement led to a low of $2.36 on Jan 24.
More importantly, this caused it to break down below the $3.50 horizontal area, which had intermittently acted as both resistance and support since September 2020.
Therefore, it’s imperative that the price reclaims this area in order for the trend to be considered bullish.

Cryptocurrency trader @CryptoTony_ tweeted a CRV chart stating that the entire downward movement could be part of a correction.

However, due to the price action on the weekly chart, a look at lower time frames is required in order to determine if the correction has come to an end.
Ongoing CRV bounce
The daily chart shows that CRV has bounced at the $2.90 horizontal support area. It had been trading above this level since October 2021. In addition to this, the area coincides with an ascending support line that has been in place since July 2021. The line was most recently validated with the Jan 24 low (green icon).
If the upward movement continues, the closest resistance would be found at $4.07. This is both a horizontal resistance area and the 0.382 Fib retracement resistance level.
However, technical indicators provide a relatively neutral picture. While both the MACD and RSI are increasing, the former is still negative while the latter is below 50. Both of these are signs of bearish trends.
If CRV were to reclaim the $4.07 resistance area, it would likely cause the MACD to move into positive territory and push the RSI above 50.
Conversely, a breakdown below the $2.90 area and the ascending support line would confirm that the trend is bearish instead.
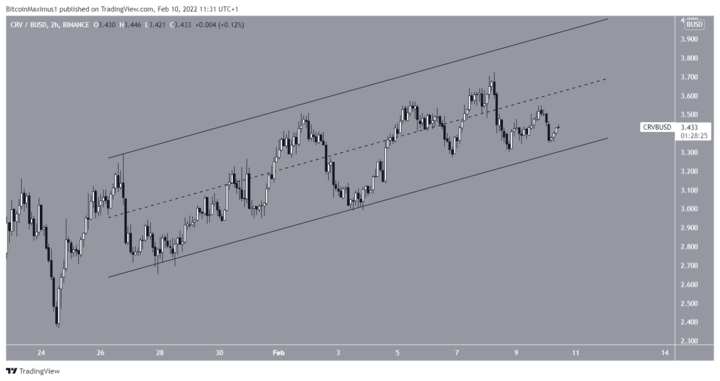
Short-term movement
The two-hour chart shows that CRV has been trading inside an ascending parallel channel since Jan 26. Such channels are usually considered corrective.
Furthermore, there is considerable overlap inside the channel, further supporting this possibility.
The short-term movement suggests that CRV will eventually break down from this pattern.
For BeInCrypto’s latest Bitcoin (BTC) analysis, click here
Disclaimer
In line with the Trust Project guidelines, this price analysis article is for informational purposes only and should not be considered financial or investment advice. BeInCrypto is committed to accurate, unbiased reporting, but market conditions are subject to change without notice. Always conduct your own research and consult with a professional before making any financial decisions. Please note that our Terms and Conditions, Privacy Policy, and Disclaimers have been updated.
