


Bitcoin (BTC) is in the process of validating the short-term resistance line from which it just broke out above. If successful, it could continue its upward trend towards $50,000.
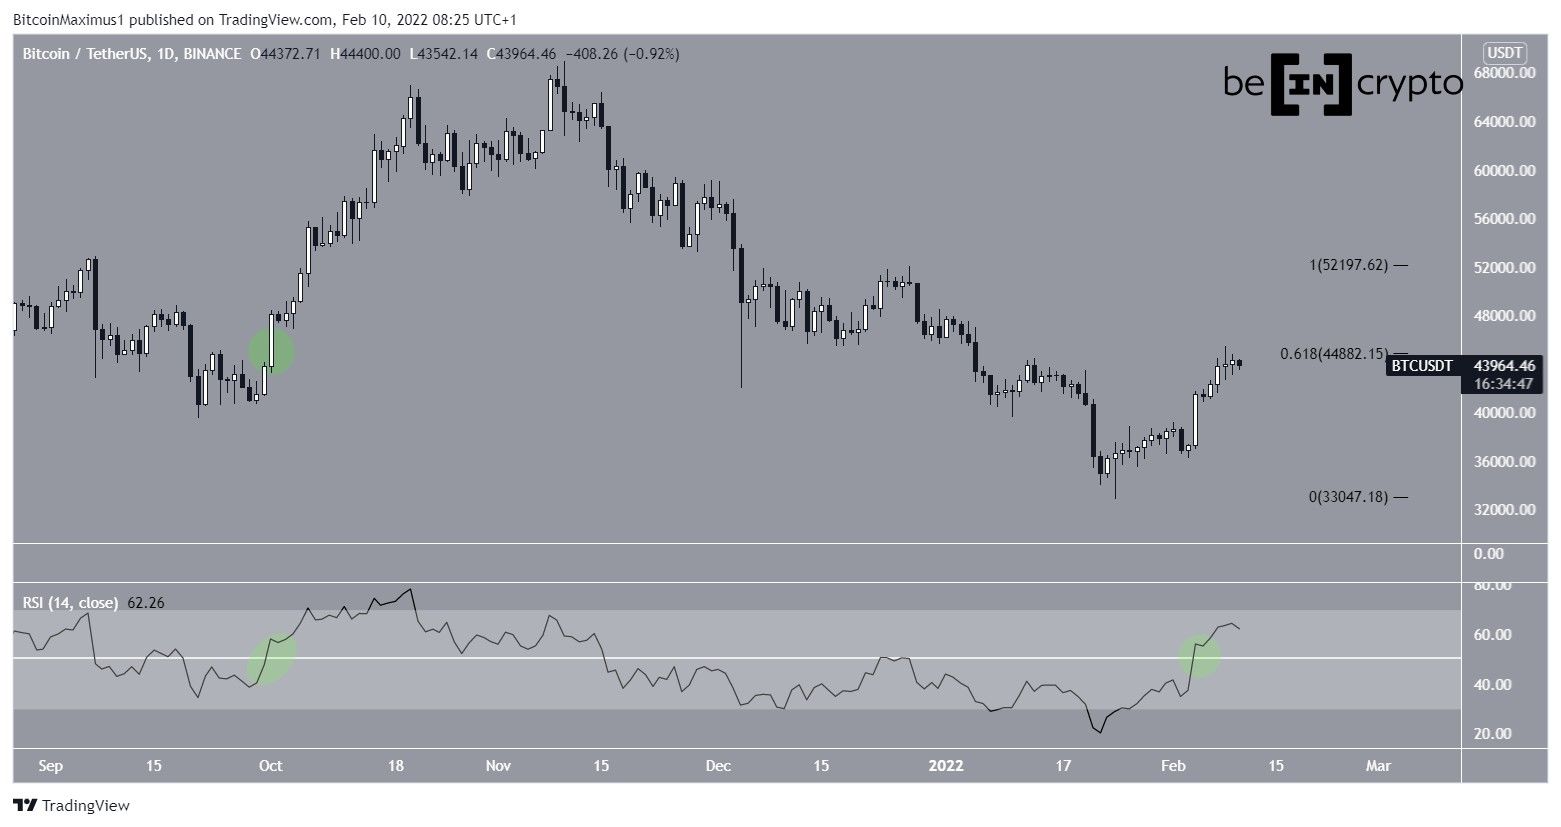
After reaching a local high of $45,492 on Feb 8, Bitcoin decreased slightly the next day but still managed to create a small bullish candlestick due to its positive close.
The high was made very close to the 0.618 fib retracement level at $44,880.
Despite the rejection, technical indicators are showing bullish signs. This is especially visible in the RSI, which has moved above 50 (green circle).
The RSI is a momentum indicator and readings above 50 are considered bullish. The previous time the RSI moved above 50 was at the beginning of October (green circle), prior to the beginning of the upward move towards the all-time high price.
Bitcoin breaks out
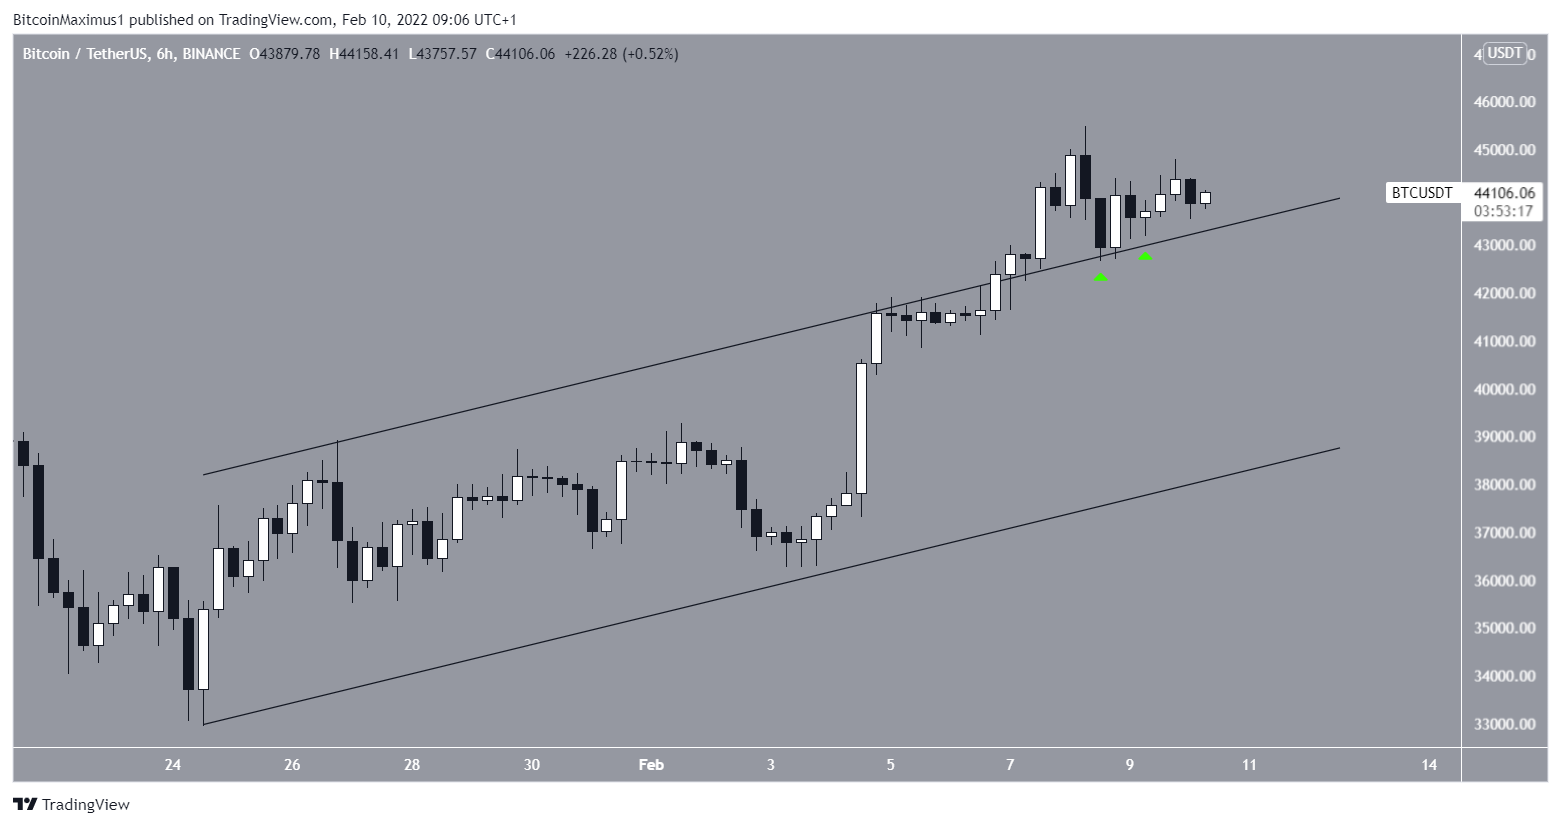
The six-hour chart shows that BTC has broken out from its short-term ascending parallel channel. This is a sign that the upward movement is impulsive and is expected to continue.
Furthermore, the price has validated the line as support twice. Therefore, the previous resistance line is now expected to provide support.
Wave count analysis
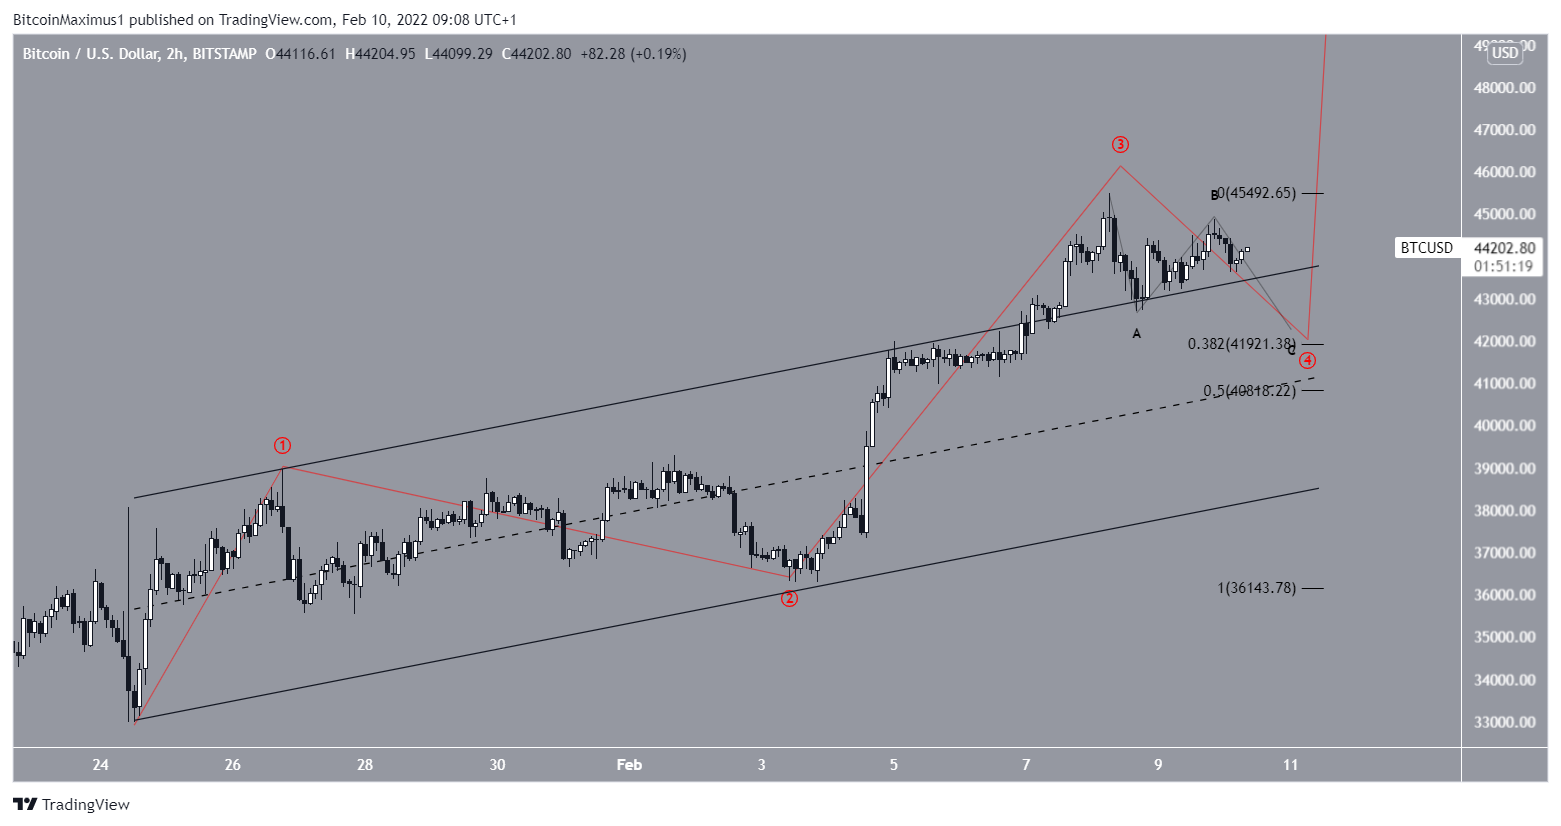
The most likely long-term wave count suggests that BTC has already reached a bottom. As for the short-term count, there are two main possibilities, both indicating that BTC is in wave four of a five-wave upward movement (red).
The first scenario indicates that the price is completing what is known as a fourth wave pullback. This means that BTC will fall towards the middle of the channel that connects waves 1-2 at $41,900 before another upward movement to complete wave five.
The sub-wave count is shown in black.
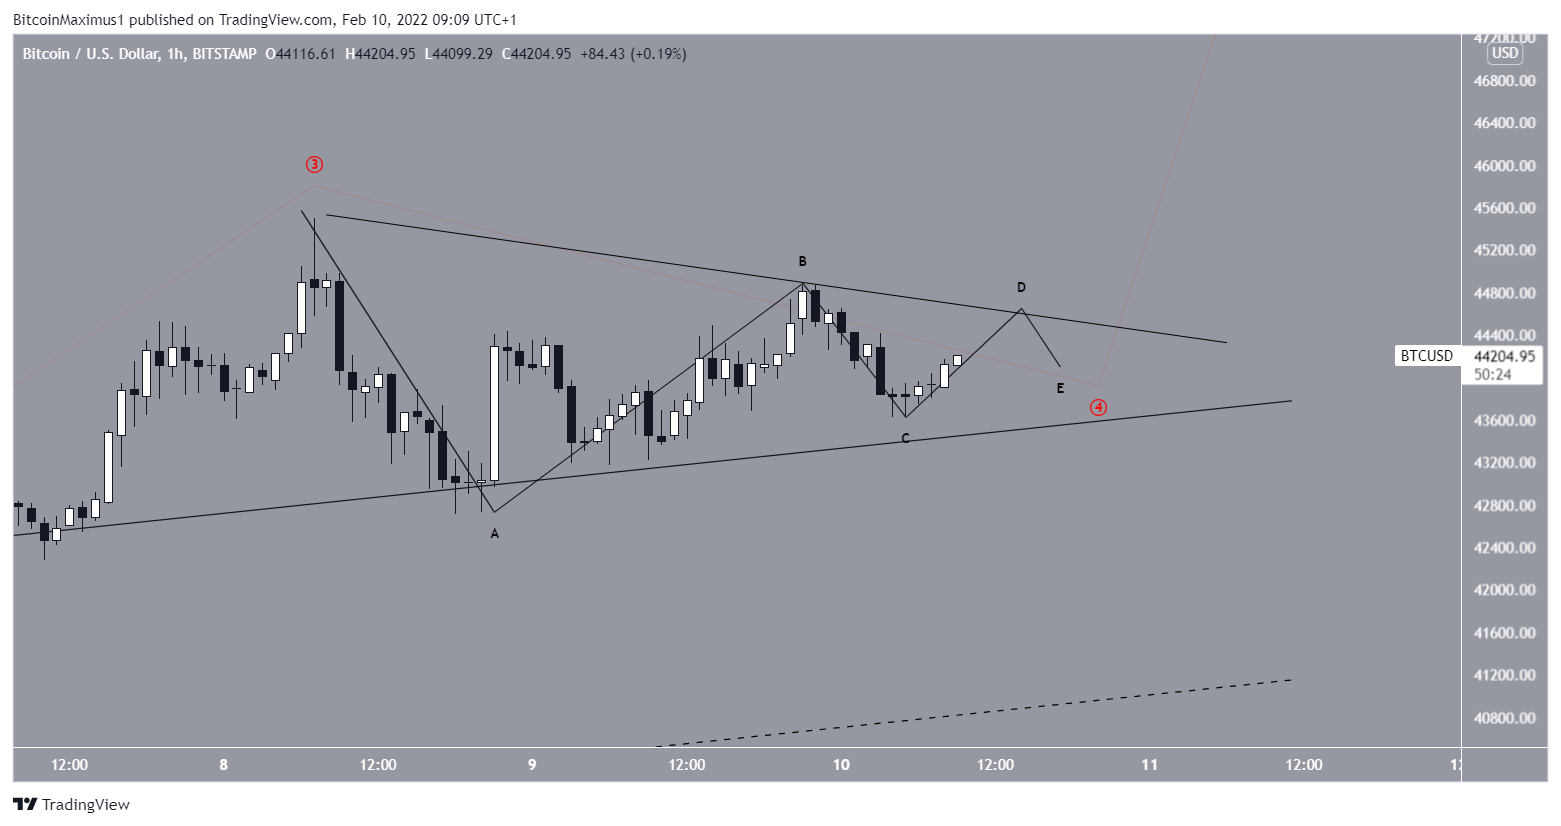
The second possibility indicates that BTC is completing a fourth wave triangle. In this pattern, instead of falling back to the midline of the channel, the price would continue consolidating above its resistance line and eventually move up from there.
For BeInCrypto’s previous Bitcoin (BTC) analysis, click here


