Block 627,900 of Bitcoin (BTC) was mined on April 29. Therefore, we are now officially 99 percent of the way towards the next halving, which is projected to occur on May 12.
Bitcoin has been gradually increasing since the March crash. Its fundamental outlook is also looking better, as evidenced by the fact that the open interest on the Chicago Mercantile Exchange (CME) is at the highest levels since prior to the crash. However, the price has reached a major resistance area that could reverse the current bullish trend.
In this article, we will take a look at the price movement for 10 cryptocurrencies and analyze their future outlook.
Bitcoin (BTC)
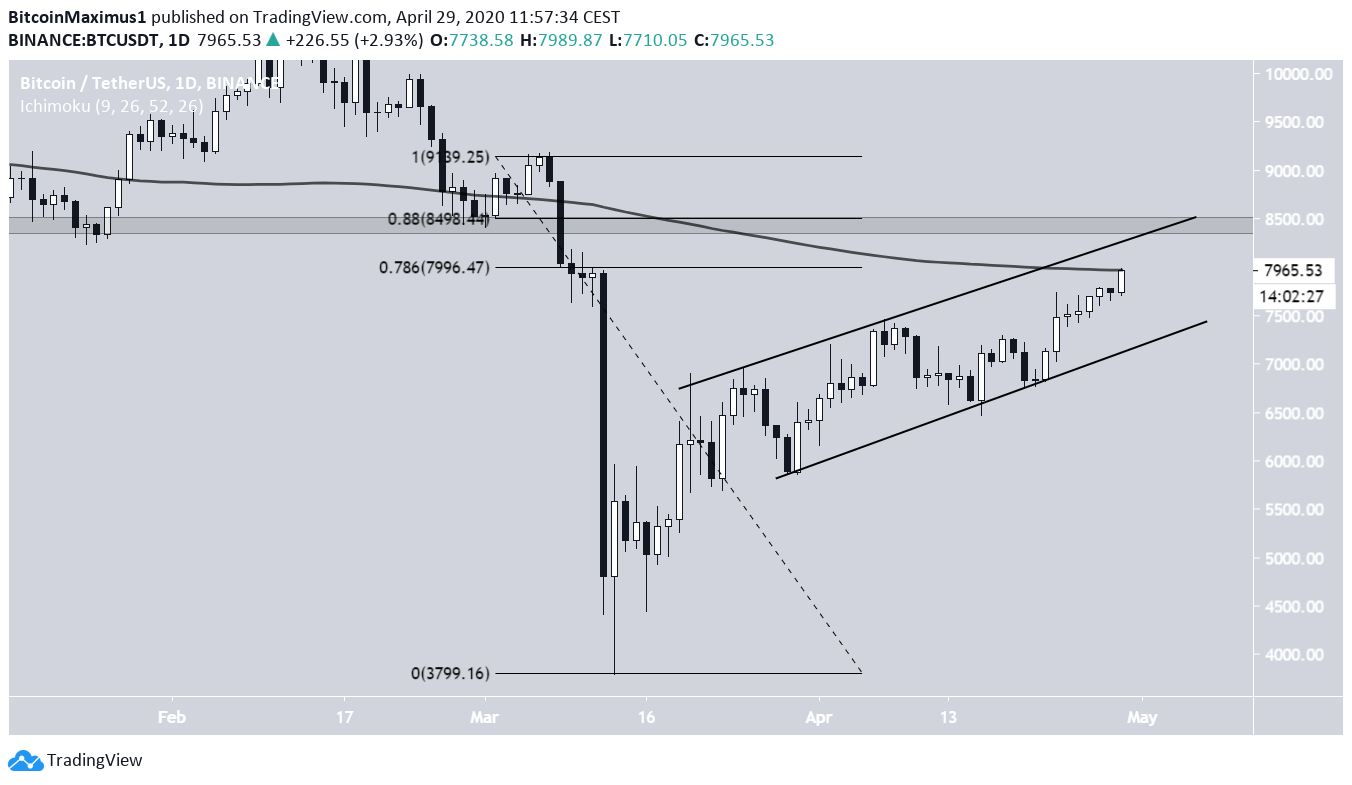
The Bitcoin price is trading inside an ascending channel and has been doing so since March 20. At the current time, it is trading slightly below the descending resistance line of the channel.
However, the price has reached a confluence of two other resistance levels, them being:
- 0.786 Fib level of the previous decrease
- 200-day MA
It is possible that the price will reverse at the current level and drop towards the support line. If not, the price could increase until the next resistance area, which is found between $8400-$8500. If the price increases above this level, it would break out from the channel and affirm that the current movement is not a retracement — rather it would be a new upward move.
Ethereum (ETH)
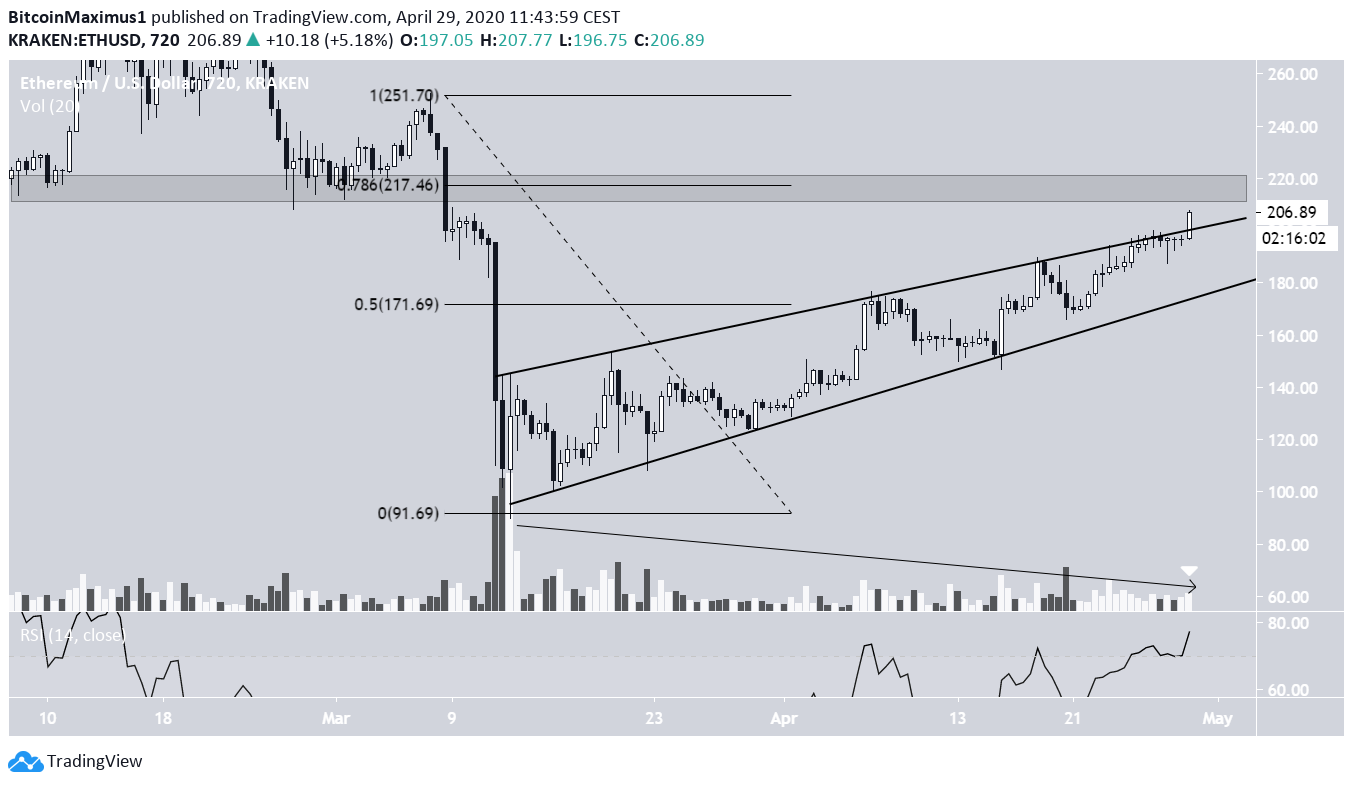
The Ethereum price has been increasing since reaching a bottom on March 13, trading inside an ascending wedge. Even though the wedge is considered a bearish reversal pattern, the price is in the process of breaking out above it.
However, there are several reasons that cast some doubt on the validity of the breakout. First, the volume has been consistently decreasing since the beginning of a wedge and is almost non-existent on the purported breakout.
Additionally, there is a very important resistance level at $217, which previously has twice offered support to the price. This resistance level is further strengthened due to the fact that it is the 0.786 Fib level of the previous downward move.
Therefore, there is a strong possibility that the current breakout is not valid, meaning that the price will continue to increase towards the aforementioned resistance area before dropping sharply. A definitive breakout above $220 would invalidate this hypothesis.
XRP (XRP)
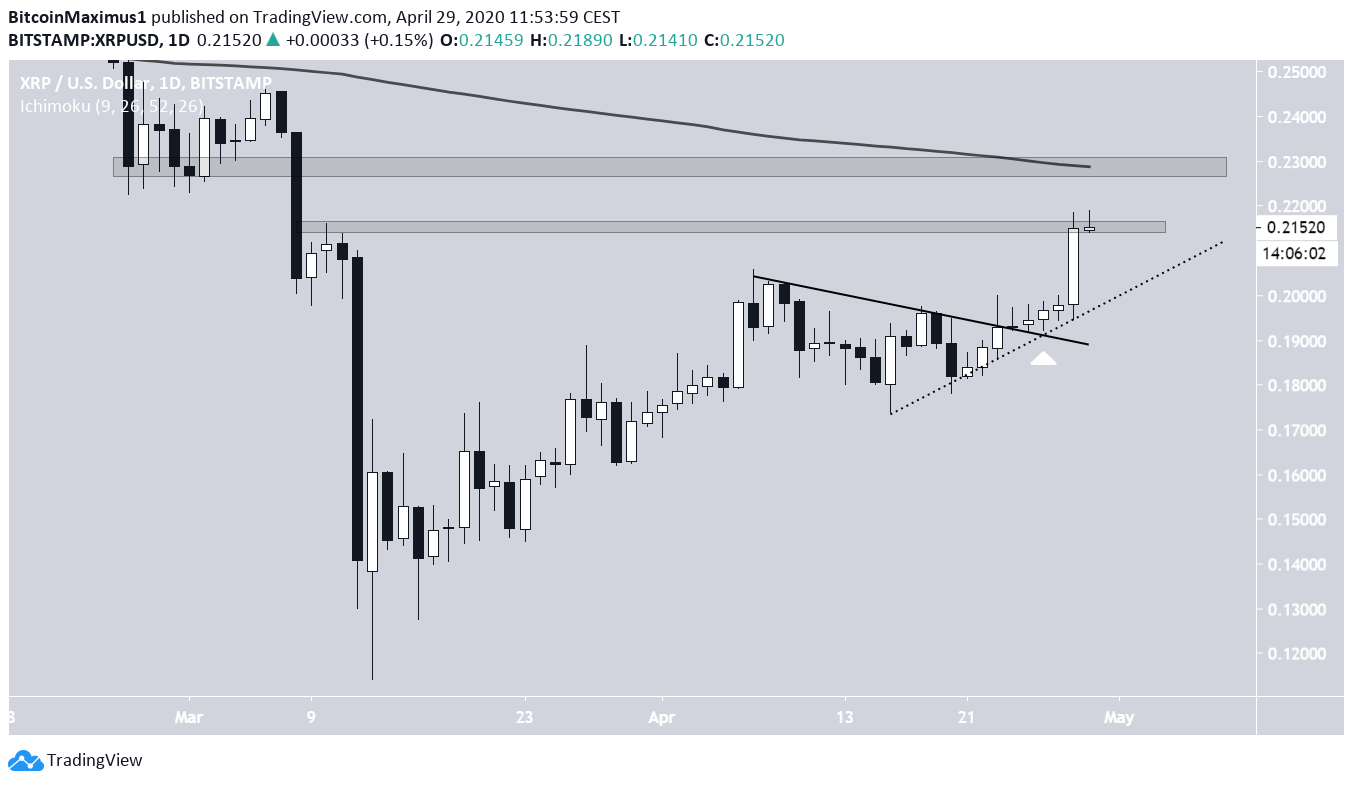
On April 24, the XRP price broke out from a descending resistance line that had been in place for the past 17 days. After validating it as support, the price began an upward move that is still ongoing. Furthermore, it seems that XRP is following an ascending support line (dotted).
The closest resistance areas are found at $0.215 and $0.23. The price is currently trading inside the former. However, this is only a minor resistance area. In contrast, the $0.23 area is also strengthened by the presence of the 200-day moving average (MA), making it a very likely level for a reversal.
Since there is no bearish divergence in the RSI, the price is expected to reach it.
Bitcoin Cash (BCH)
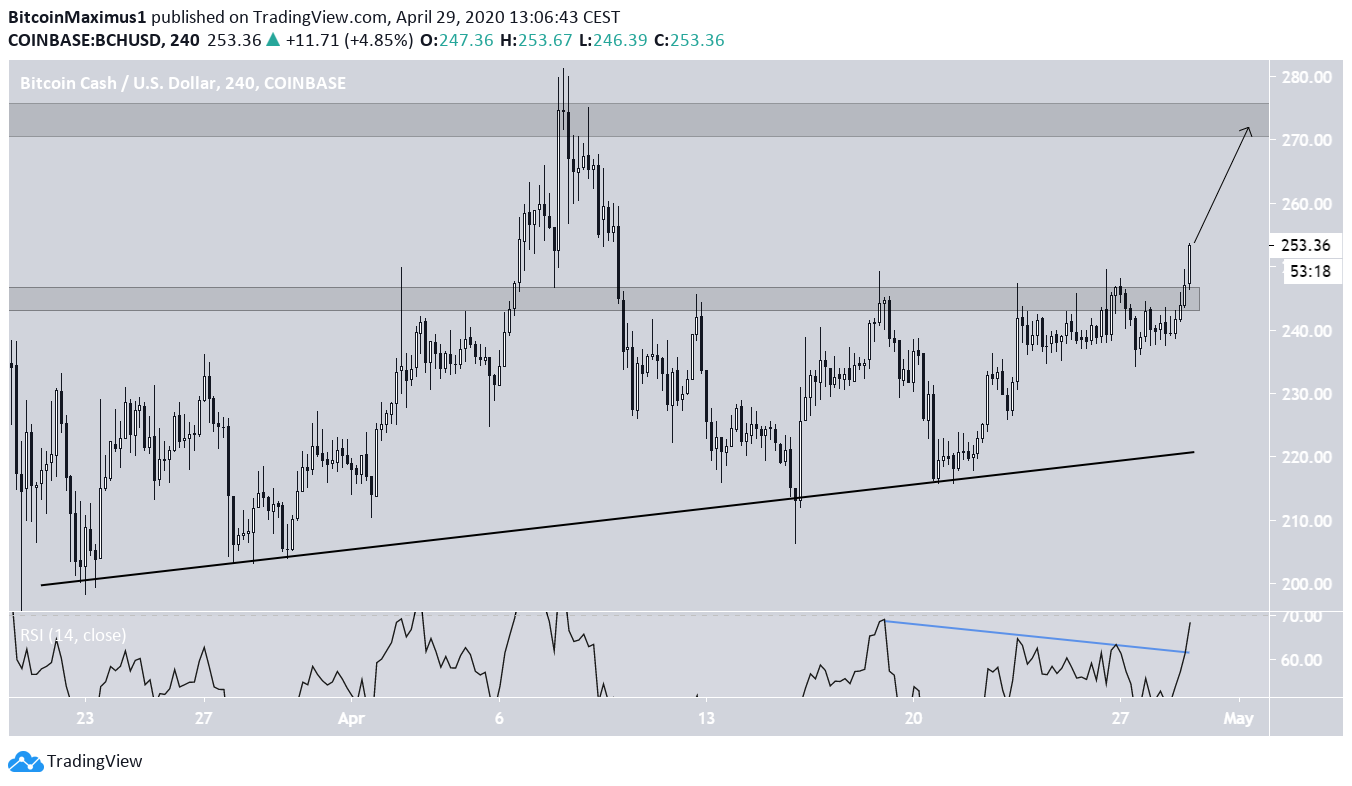
The Bitcoin Cash price has been following an ascending support line since March 22. On April 22, it bounced on this line for the final time before beginning an upward move that is still ongoing.
Initially, the BCH price was having trouble moving above the main resistance area, which is found at $246. However, it was finally successful in doing so on April 29. In addition, this movement caused a break of the trend-line of the bearish divergence that had been developing in the RSI.
Therefore, the price is expected to continue moving upwards towards the closest resistance area, which is found at $275.
Bitcoin SV (BSV)
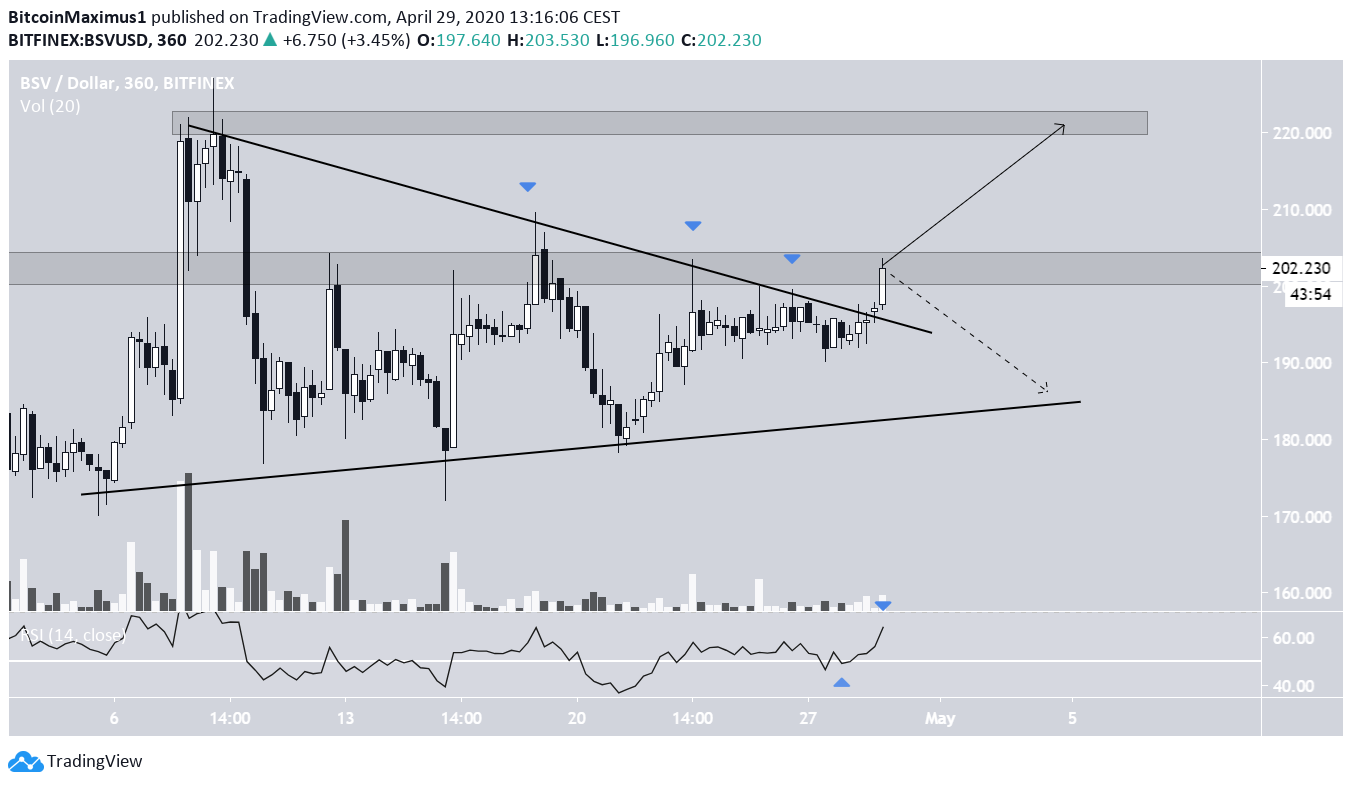
The Bitcoin SV price had been trading inside either a descending or symmetrical triangle since April 6. Due to the breakout that is still ongoing, it is more likely that this was a symmetrical triangle, since it often acts as a continuation pattern that causes a breakout when it is transpiring after an upward move.
The BSV price is trading inside a minor resistance area at $205. If the price manages to close above it, it is likely to move upward towards the next resistance area at $220. This possibility is supported by the fact that the RSI has bounced at the 50 line and is moving upwards.
However, volume on the breakout has been virtually non-existent, casting some doubt in the validity of the breakout. Therefore, if the price fails to close above $205, we could see a drop towards the ascending support line of the triangle.
Litecoin (LTC)
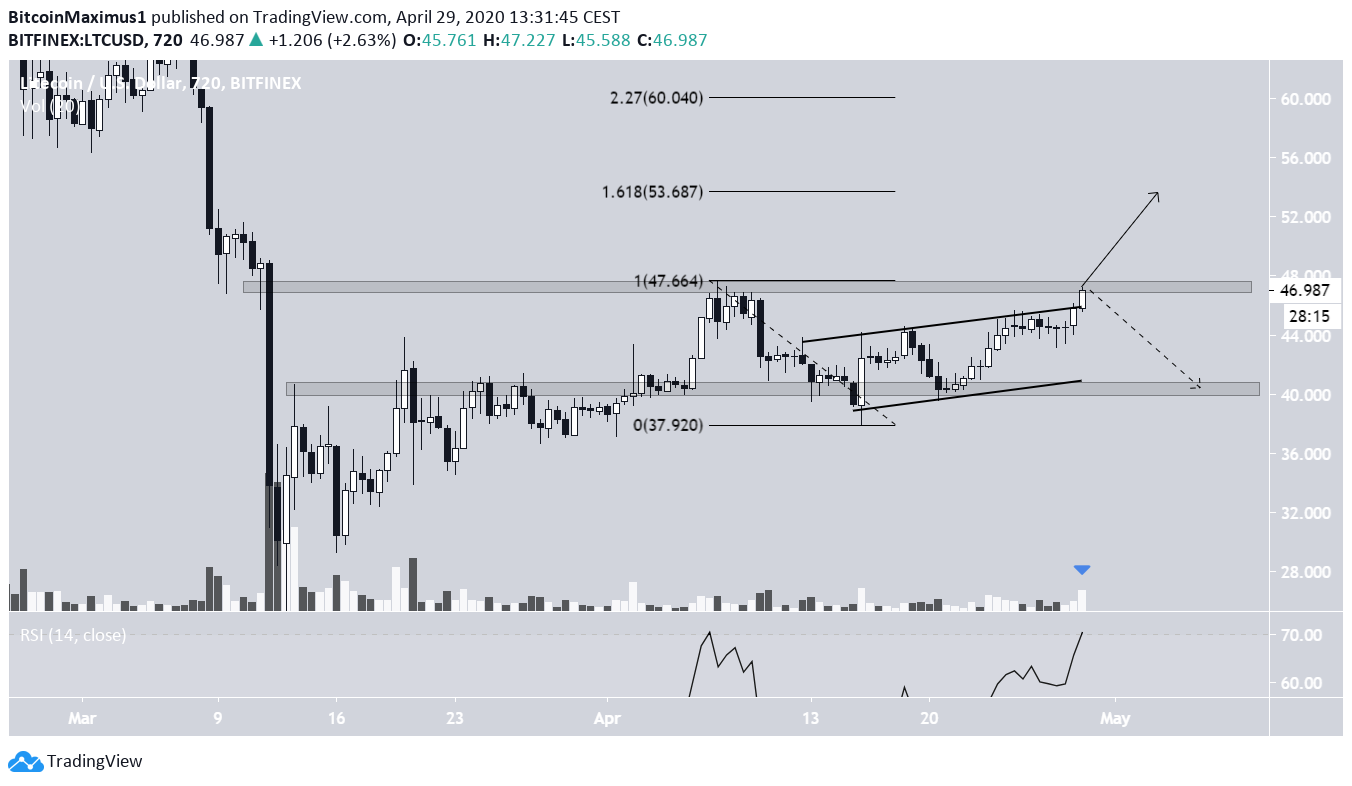
The Litecoin price has been trading inside an ascending channel since April 13. However, on April 29, the price broke out from this channel and has been moving upwards. At the time of writing, it was trading inside a minor resistance area at $47 — right where the April 7 top was reached.
Volume on the breakout was decent and there is no bearish divergence in the RSI. This suggests that the breakout could be legitimate. If LTC manages to move above $47, it is likely to continue its upward movement towards $53.50 and even $60.
If the price gets rejected, we could see a sharp drop towards $40. At the time of writing, the first option remains more likely, since the price has yet to show any type of weakness.
Binance Coin (BNB)
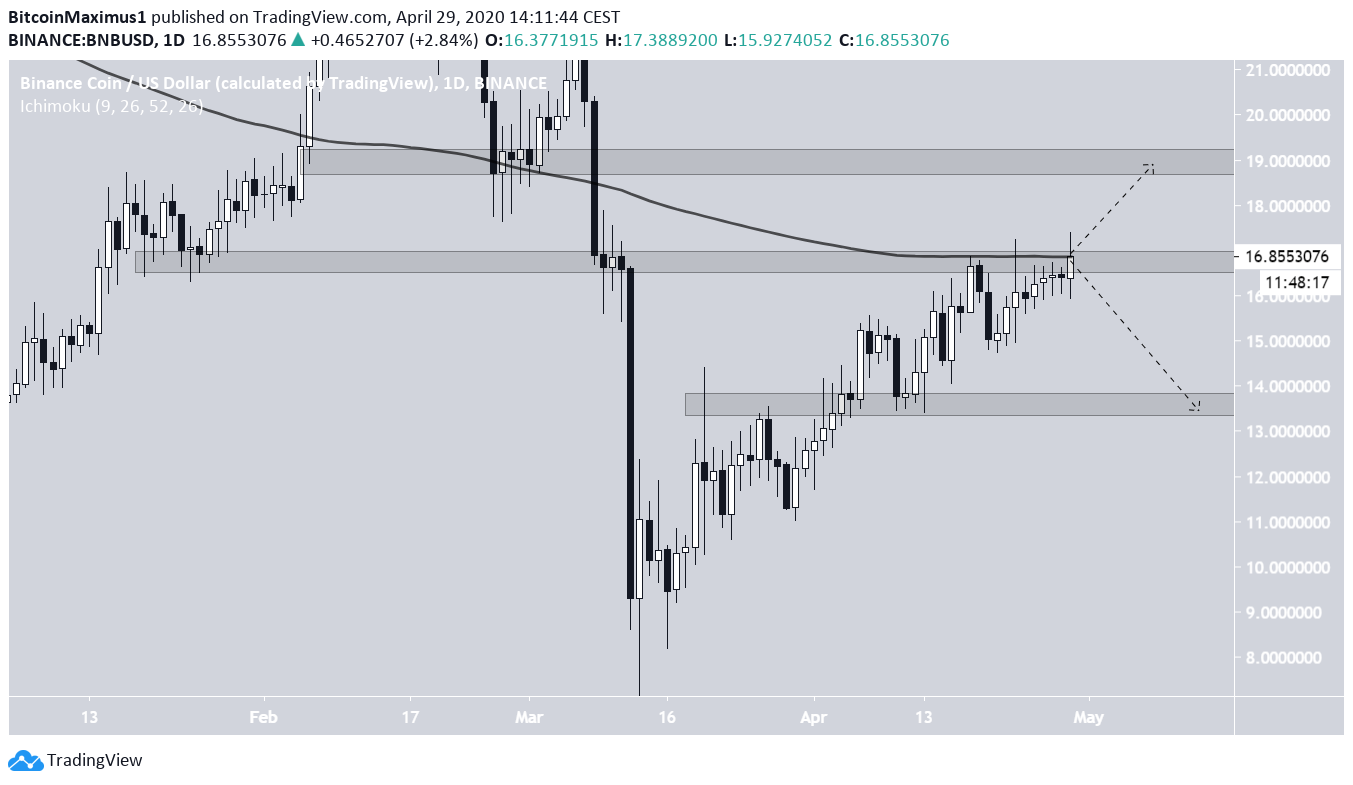
The Binance Coin (BNB) price has reached a crucial resistance level, found at $17. This area is a previous support area that has turned to resistance and is supported by the 200-day MA. The price reached a high inside this resistance on April 18 and has been struggling to break out since — currently being on its fourth try.
In lower time-frames, there is no bearish divergence to warn of an impending drop. However, this is a very strong resistance area that the price is having considerable difficulty moving above.
Therefore, both a breakout and a rejection remain possible. In the case of the former, the price would be likely to head towards $19, while a drop could send it to $13.5.
Whether the daily close is above or below this level will be crucial in determining which movement is more likely.
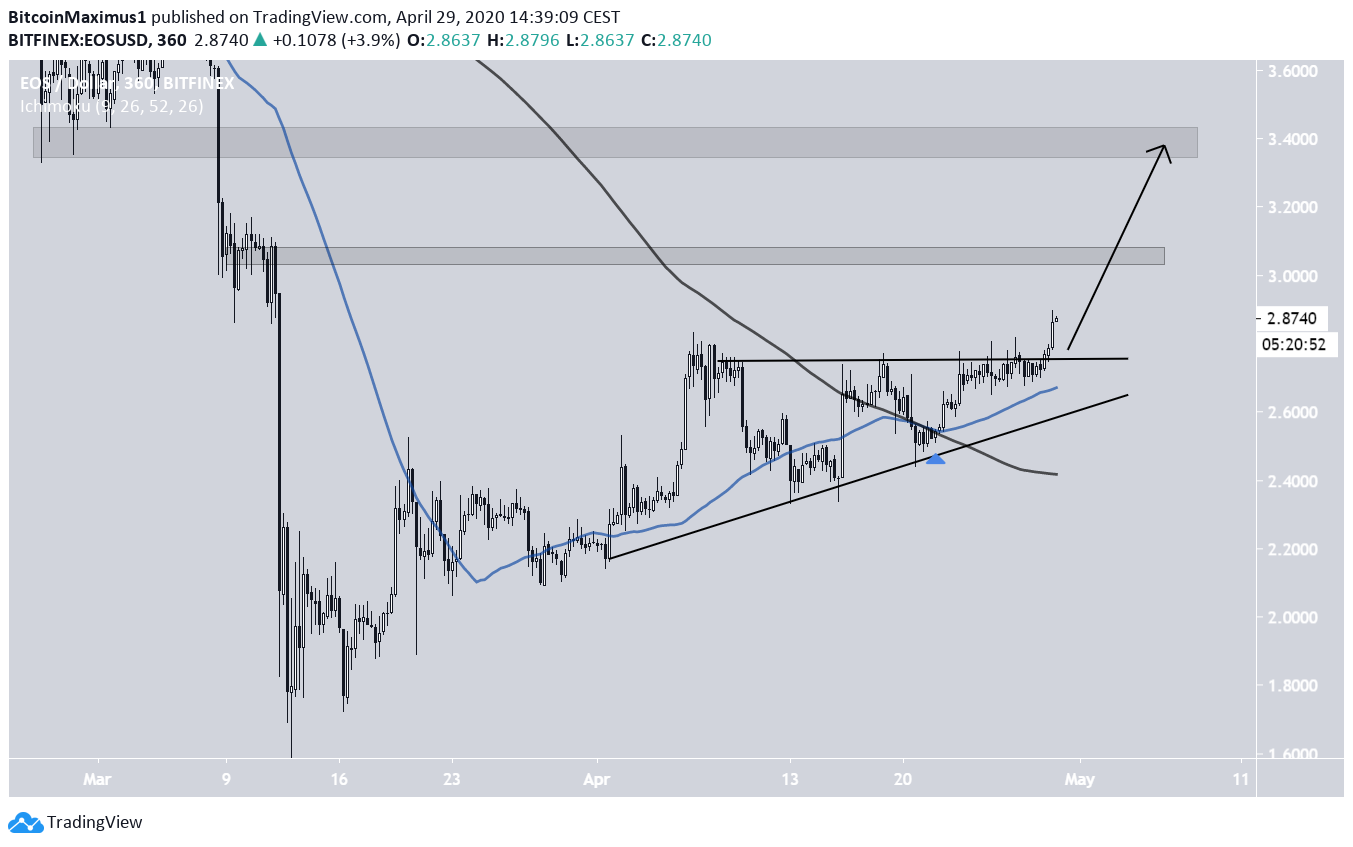
EOS (EOS)
On April 29, the EOS price broke out from an ascending triangle that had been in place for the past two weeks. The breakout was preceded by a golden cross in the six-hour time-frame.
There are two resistance areas, a minor one at $3.05 and a major one at $3.4. A breakout that travels the entire height of the pattern would take the price all the way to the later. However, a slight retracement is expected — possibly occurring after the price reaches the minor resistance area.
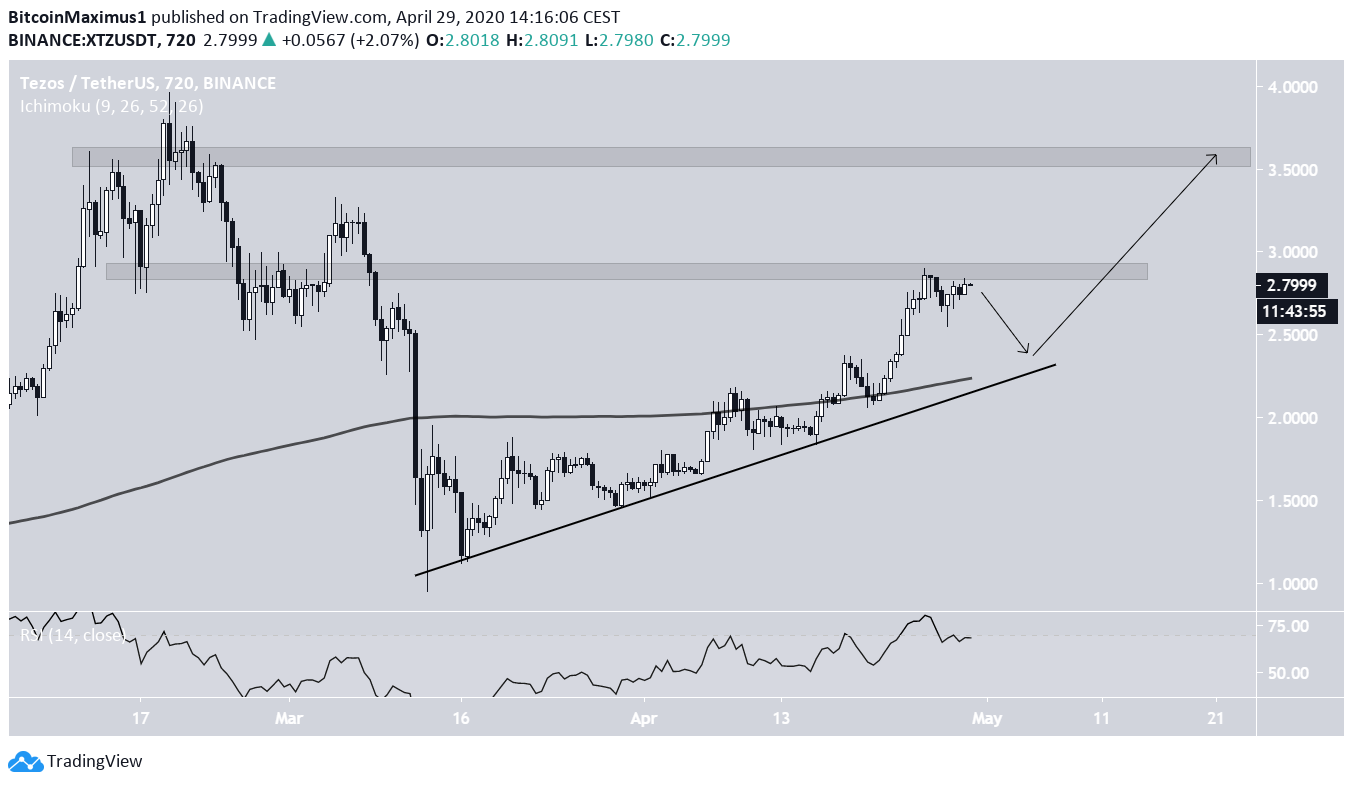
Tezos (XTZ)
The Tezos (XTZ) price has been increasing since reaching a bottom on March 13. The increase has followed the slope of an ascending support line that was last reached on April 17. The price has been moving upwards at an accelerated rate since.
On April 26, the XTZ price reached the $2.8 resistance area and was rejected, initiating a small downward move. However, BNB has regained almost all of its losses and has reached this area once again. While the RSI is overbought, there is no bearish divergence.
Due to the fact that the price has not retraced considerably since April 17, it would make sense for the price to drop towards the ascending support line and validate it once more before continuing its upward movement towards the next resistance area at $3.5. This hypothetical movement would also serve to validate the 100-day MA as support.
In a more bullish scenario, the price would increase all the way to $3.50 without validating the support line at all.
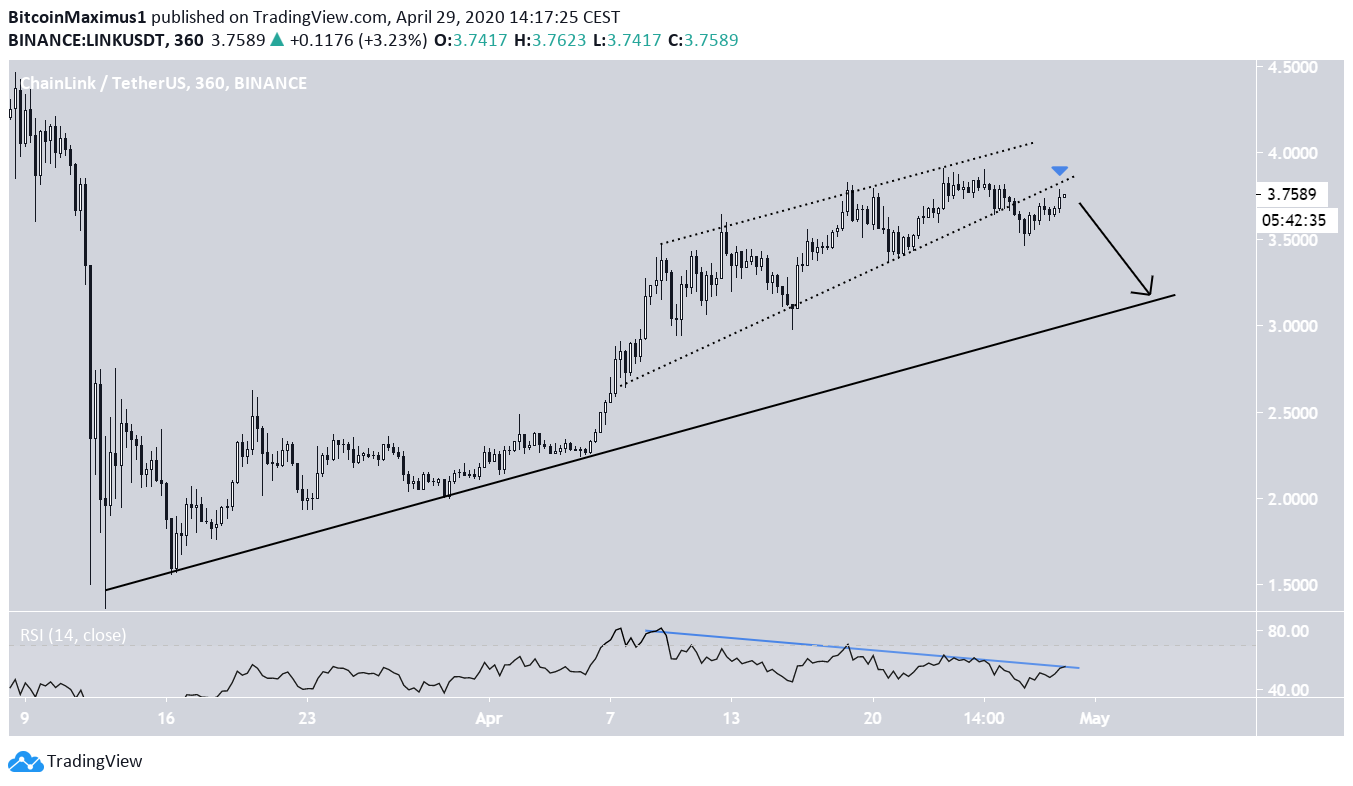
Chainlink (LINK)
On April 25, the LINK price broke down from an ascending wedge that had been in place since April 8. After the breakdown, LINK has moved upwards and is in the process of validating the wedge as resistance.
This is a common movement after breakdowns that often leads to a sustained downward move. If so, the price could decrease and validate the long-term ascending support line once more — which has been in place since the bottom on March 13.