


The magnitude of the effect from the current pandemic on the global economy has yet to be fully realized. However, most projections expect a considerably negative impact that could trigger a recession.
One such prediction, made by the Goldman Sachs Group, indicated that advanced economies could shrink by as much as 35%. However, predictions for the Bitcoin price are not as grim. On the contrary, the upcoming halving event could provide a boost to the price. While predictions vary, the majority are expecting a substantial price increase.
Without further ado, let’s take a look at some Bitcoin and altcoin charts to try and figure out where the markets will be moving.
Bitcoin (BTC)
The Bitcoin price was trading inside an ascending wedge in the period from March 13-April 9. After the April 9 breakdown, the price increased to validate the wedge as resistance and dropped sharply afterward. This type of movement suggests that the bears are in control and the current trend is about to move bearish.
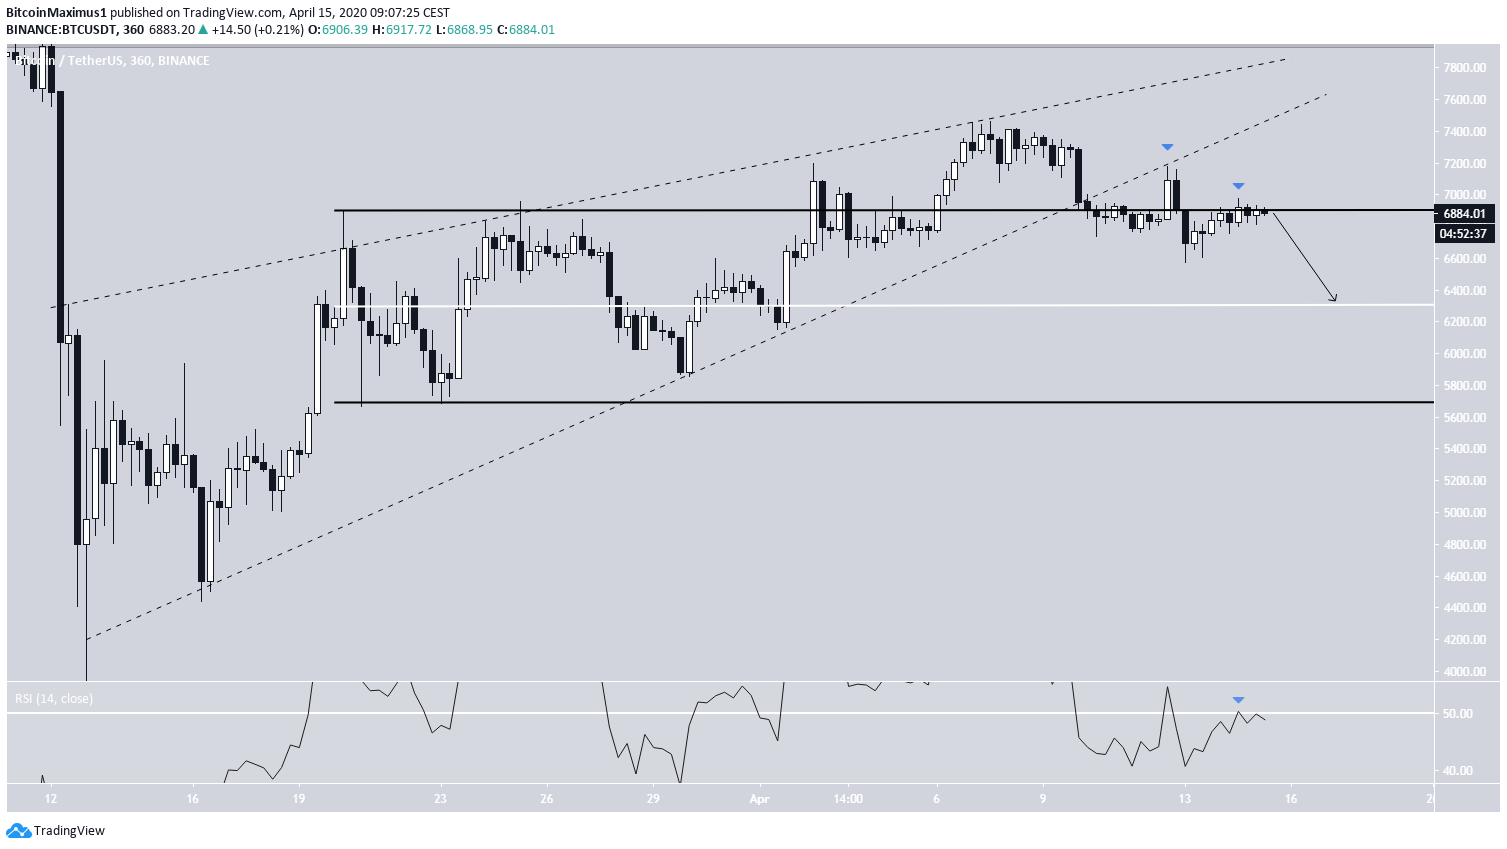
As for the current pattern, there is a trading range between $6,900-$5,700 which the price has previously traded in throughout March and the beginning of April. The price has fallen back inside this range after the breakdown and is currently struggling to move above the resistance line. The current resistance is further solidified by the RSI resistance at the 50 line.
If the price is unsuccessful in breaking out above the resistance line, which looks likely, it would be expected to fall towards the midpoint (EQ) of the range at $6,300. A breakout above this resistance line could take the price to validate the ascending wedge once more. A movement above the support line of the wedge and recent high at $7,400 would invalidate the bearish outlook.
- Short-Term Outlook – Bearish
- Medium-Term Outlook – Bearish
- Long-Term Outlook – Bullish
Ethereum (ETH)
Similar to BTC, the Ethereum price has been increasing since the rapid downward move o March 13. However, the decrease has taken the shape of an ascending channel instead of a wedge, which is a neutral pattern, while the wedge is considered bearish.
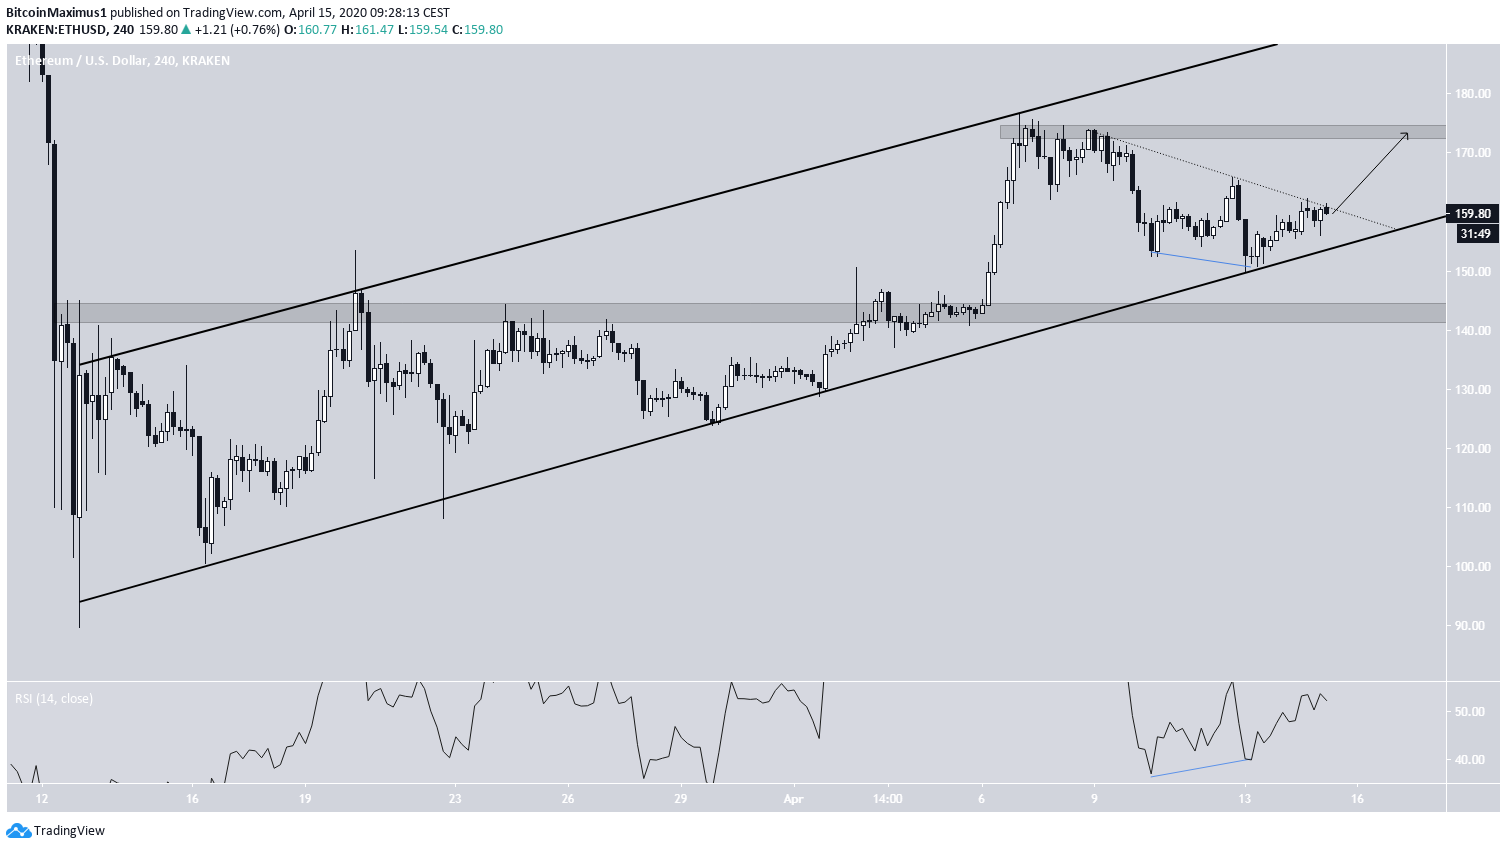
The price is also following a short-term descending resistance line. Combined with the bullish divergence that has been developing in the RSI, this suggests that the price will break out from this line. If it does so, it is likely to move towards the resistance area at $172.
On the other hand, a breakdown would take the price towards the $145 support. While the technical outlook for Ethereum looks bullish, or at least neutral, the risk remains that a rapid decrease in the BTC price could cause the same for ETH.
- Short-Term Outlook – Neutral (Because of BTC)
- Medium-Term Outlook – Bullish
- Long-Term Outlook – Bullish
XRP (XRP)
Similar to BTC but unlike Ethereum, the XRP price has broken down from an ascending support line that had been in place since March 13. The increase ended as soon as the price reached the closest resistance area, which was found at $0.205. The price broke down from the ascending support line shortly afterward.
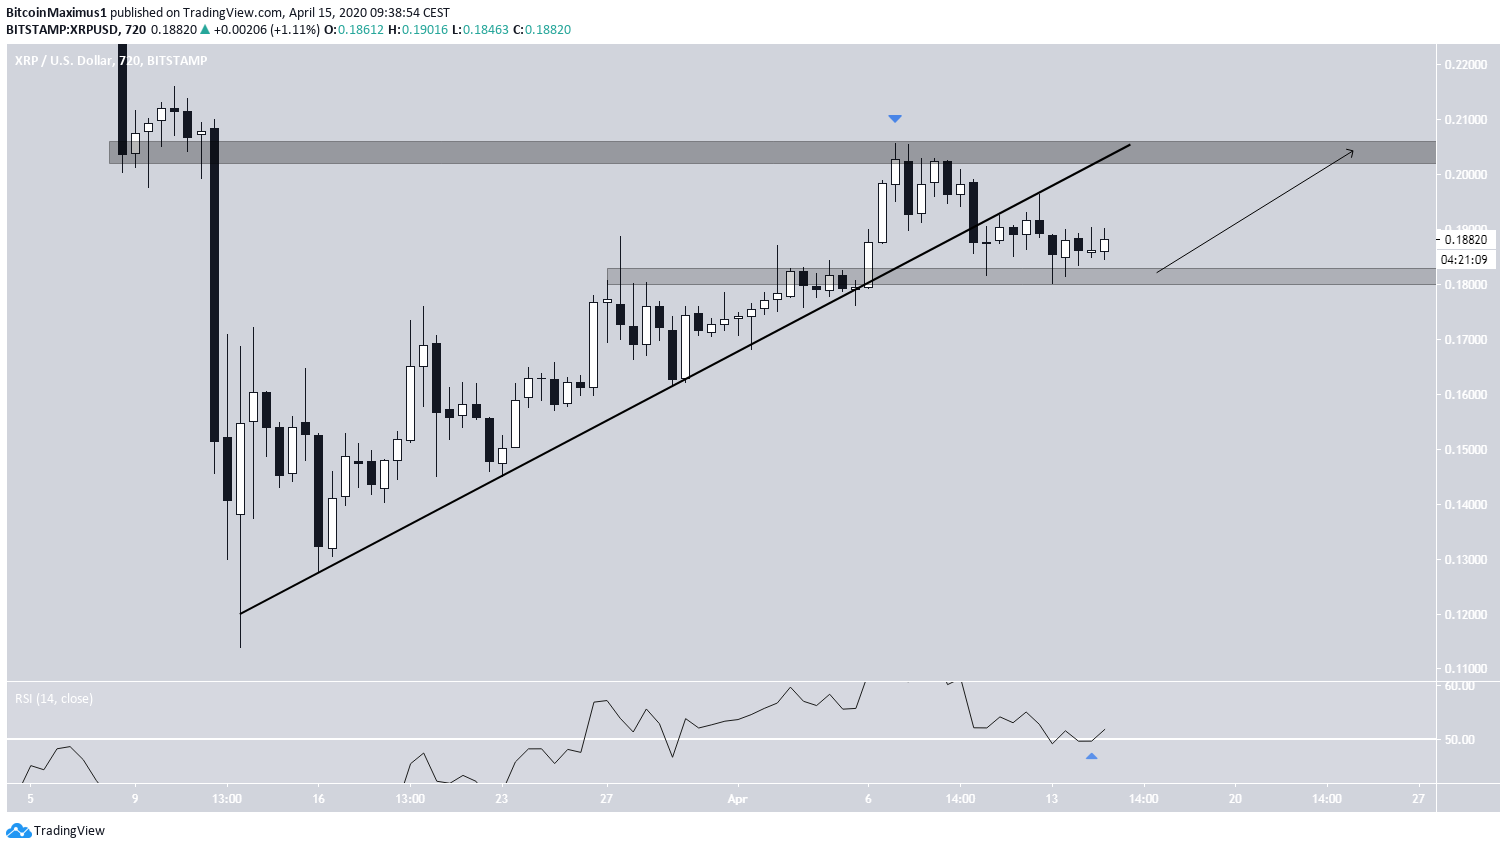
The price is currently inside the $0.18 support area, which previously acted as a resistance. As long as the price stays above this area and the RSI stays above 50, XRP is expected to increase towards the $0.205 resistance area once more. A period of consolidation between these two areas could be in the cards until the price decides on its next move. A breakout/breakdown from these areas would change the bias to bullish/bearish.
- Short-Term Outlook – Neutral
- Medium-Term Outlook – Bearish
- Long-Term Outlook – Bullish
Bitcoin Cash (BCH)
The BCH price has also broken down from an ascending support line. It did so once it reached the $270 resistance area along with the 50-day moving average (MA), which is also providing resistance.
At the time of publishing the price was trading between resistance and support at $240 and $210, respectively.
Interestingly, after breaking down from the support line, BCH did not have enough strength to increase and validate this line as resistance afterward, indicative of a lack of buying power by the bulls.
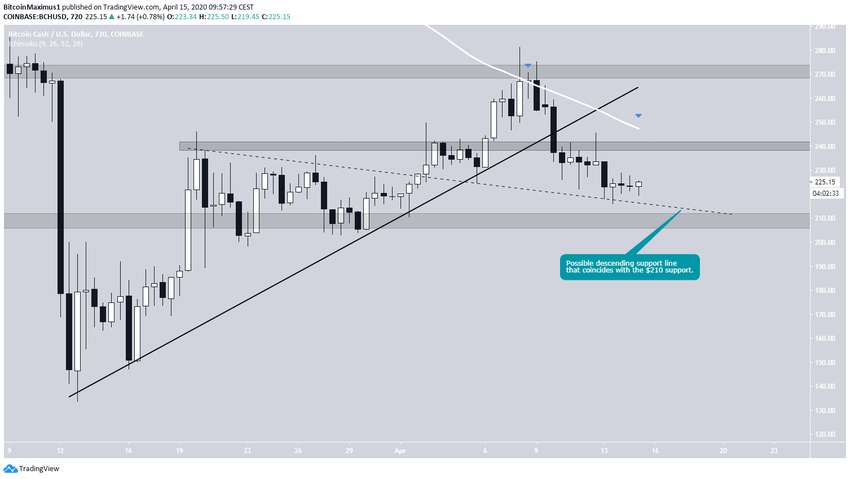
In addition, BCH is possibly following a descending support line, which will coincide with the $210 support area by the end of the week. It would make sense for the price to continue following this line until it falls in line with this support before eventually beginning an upward move.
- Short-Term Outlook – Bearish
- Medium-Term Outlook – Bearish
- Long-Term Outlook – Bullish
Bitcoin Cash SV (BSV)
The BSV movement is characterized by two lines instead of one. First, there is the ascending support line that the price has broken down from, which is very similar to the rest of the cryptocurrency market.
In addition, the price is following a descending resistance line that has been in place since Jan 20. The price has validated this line thrice at this point — most recently on April 9. This was the catalyst of the ensuing downward move.
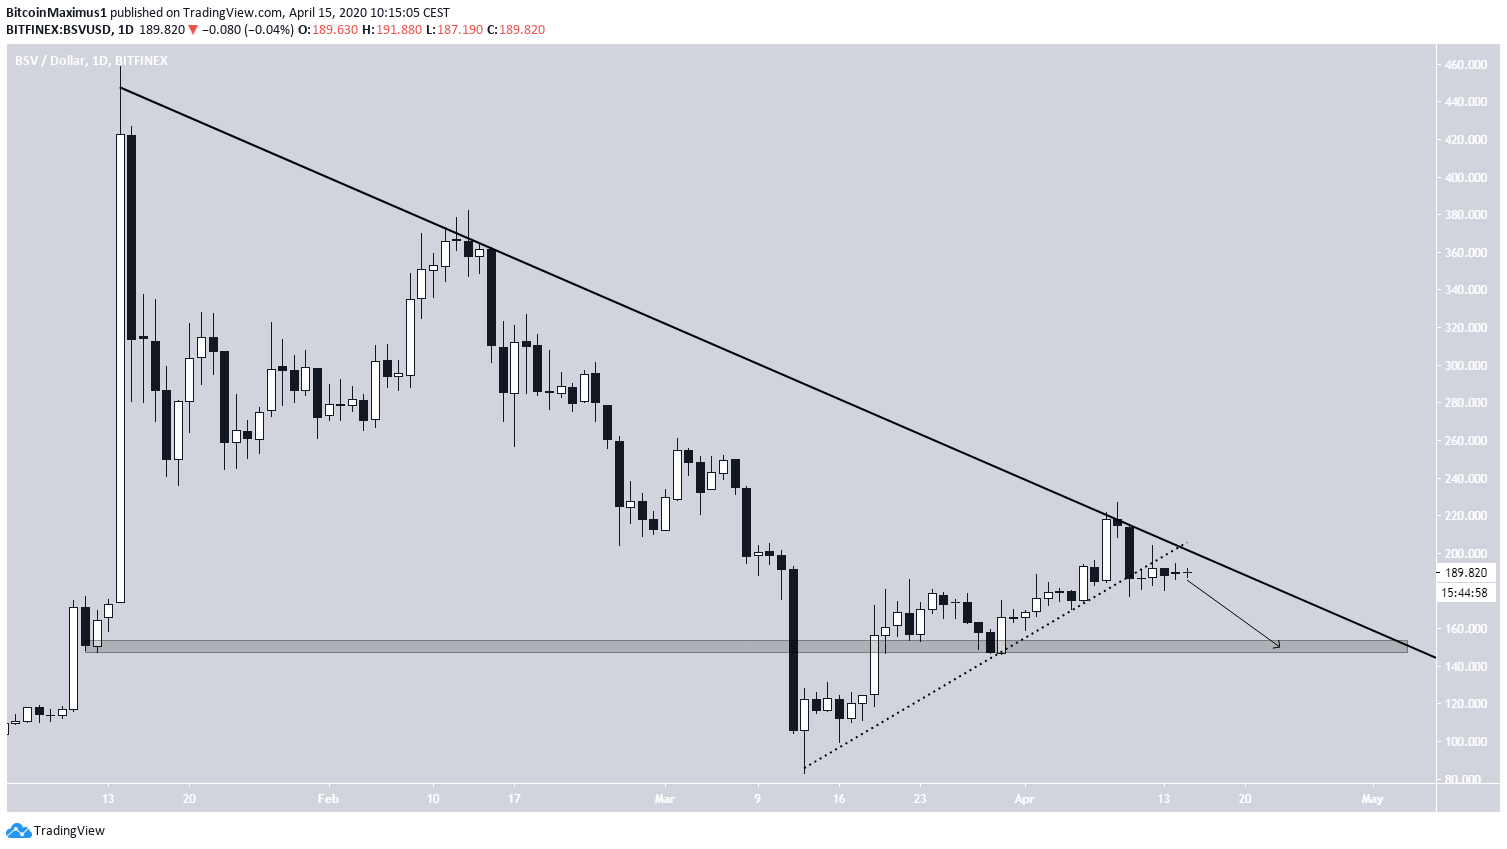
Since the price has broken down below the ascending support line and is very close to the descending resistance line, it is expected to move downwards from here. Once it does, the closest support area is found at $150.
- Short-Term Outlook – Bearish
- Medium-Term Outlook – Bearish
- Long-Term Outlook – Bullish
Litecoin (LTC)
The Litecoin price has also broken down from an ascending support line and is currently resting on the $40 support area. As long as this level holds, LTC could begin an upward move in order to validate the line it has just broken down from. If the area fails to support the price, the next support area can be found at $37.
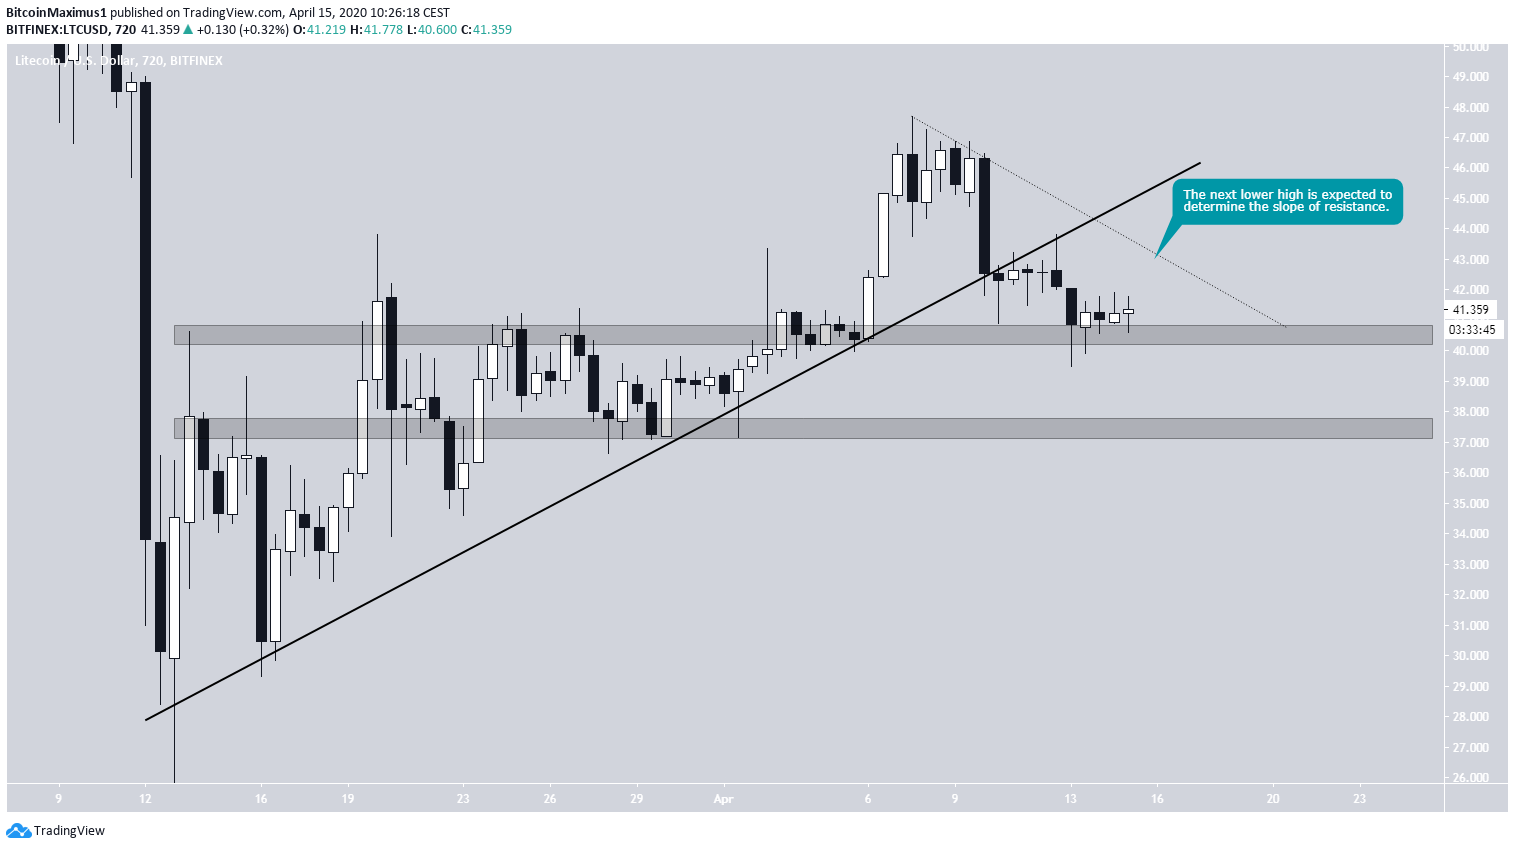
In addition, the price is possibly following a descending resistance line that has been in place since April 7. The next validation of this resistance line is expected to confirm its slope. As long as the price is following this resistance line, it is expected to continue decreasing. A breakout above it would invalidate the bearish bias, at least in the short-term.
- Short-Term Outlook – Neutral
- Medium-Term Outlook – Bearish
- Long-Term Outlook – Bullish
EOS (EOS)
The EOS chart looks quite bullish when compared to that of most other major altcoins. The price might have not yet broken down from the ascending support line, but its slope is unclear, as can be seen in the chart below.
However, the price has broken out from a long-term descending resistance line, similar to that of BCH and has validated it as support.
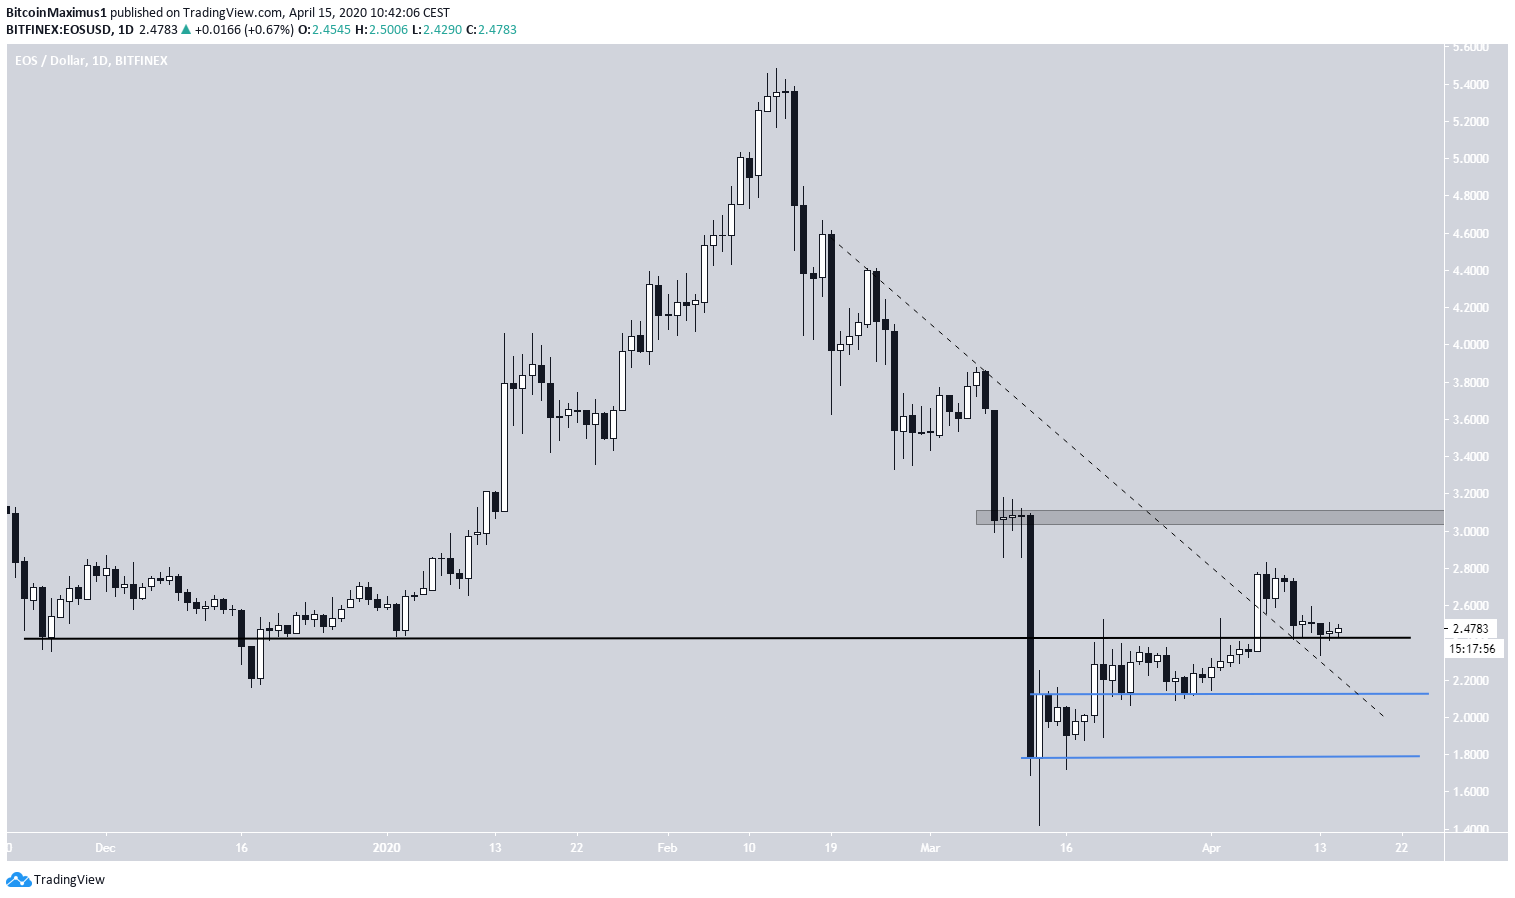
The most important area for EOS is found at $2.45. This area acted as support throughout the end of 2019, and resistance after the March 13 drop. The price is currently in the process of validating it as support. Combined with the breakout from the descending resistance line, this is a bullish sign.
As long as the price stays above this area, it is likely to eventually increase towards the next resistance area at $3.05. A breakdown below this area would put into play the support at $2.10.
- Short-Term Outlook – Neutral (because of BTC)
- Medium-Term Outlook – Bullish
- Long-Term Outlook – Bullish
Binance Coin (BNB)
The BNB chart does not yet show a breakdown. There is definitely an ascending support line that is clearly intact.
However, there is a possible resistance line, whose slope is not yet confirmed, that would create an ascending wedge when combined with the current support line.
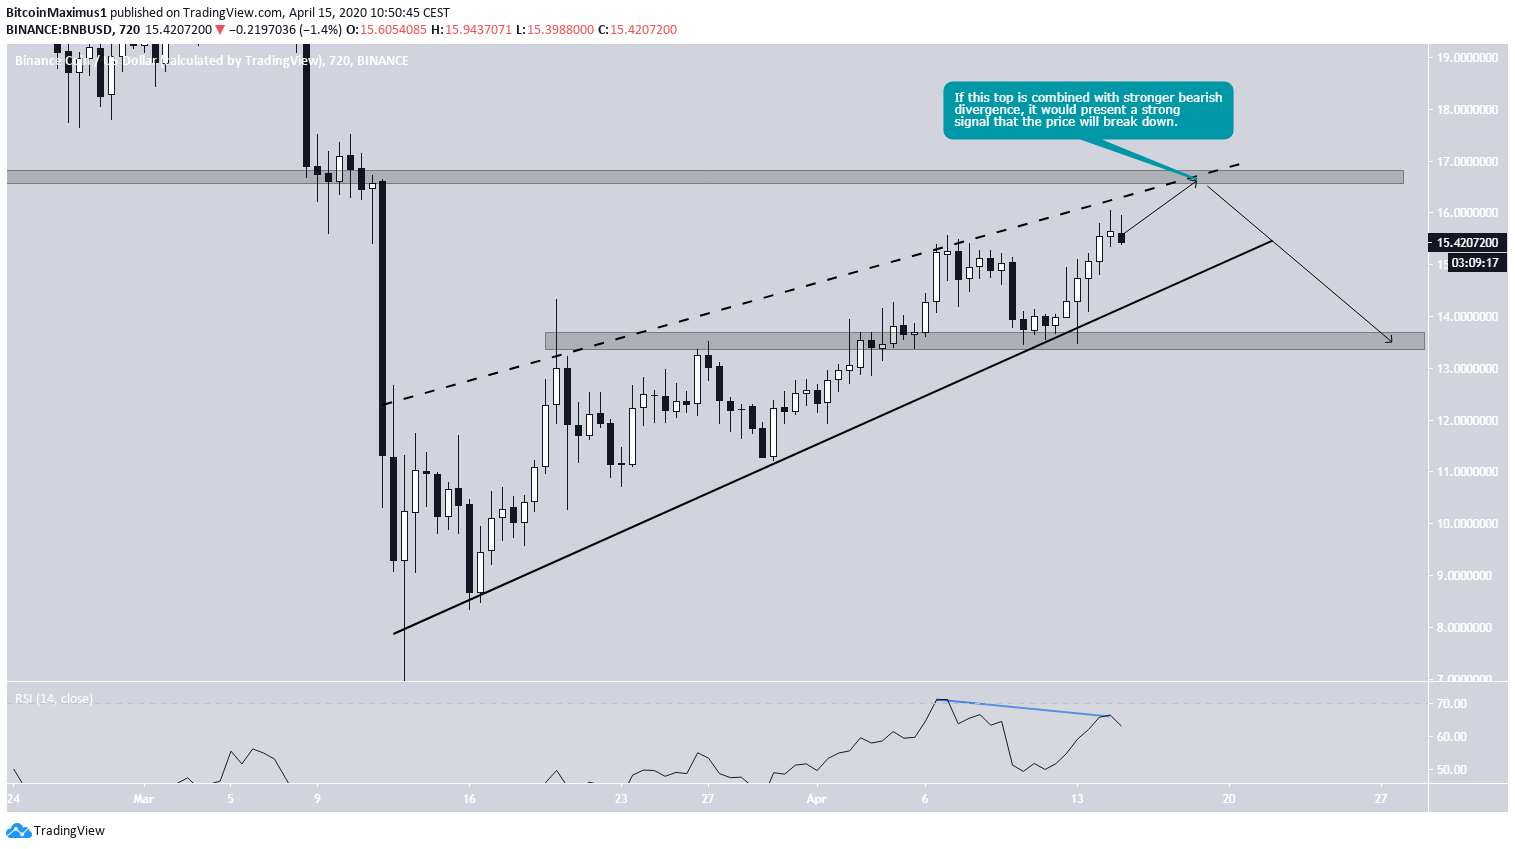
The ascending wedge is considered a bearish reversal pattern. If the price were to make another high, which would validate both the $17 resistance area and the slop of the resistance line, it would be a very likely place for a reversal.
This is further supported by the bearish divergence in the RSI. If a breakdown transpires, the price could decrease all the way to $13.50.
- Short-Term Outlook – Bullish
- Medium-Term Outlook – Neutral
- Long-Term Outlook – Bullish
ChainLink (LINK)
Since March 13, the LINK price has seen the best gains of the other altcoins analyzed here. The increase has been so rapid that the price has moved way above the ascending support line, which it has not validated since March 29.
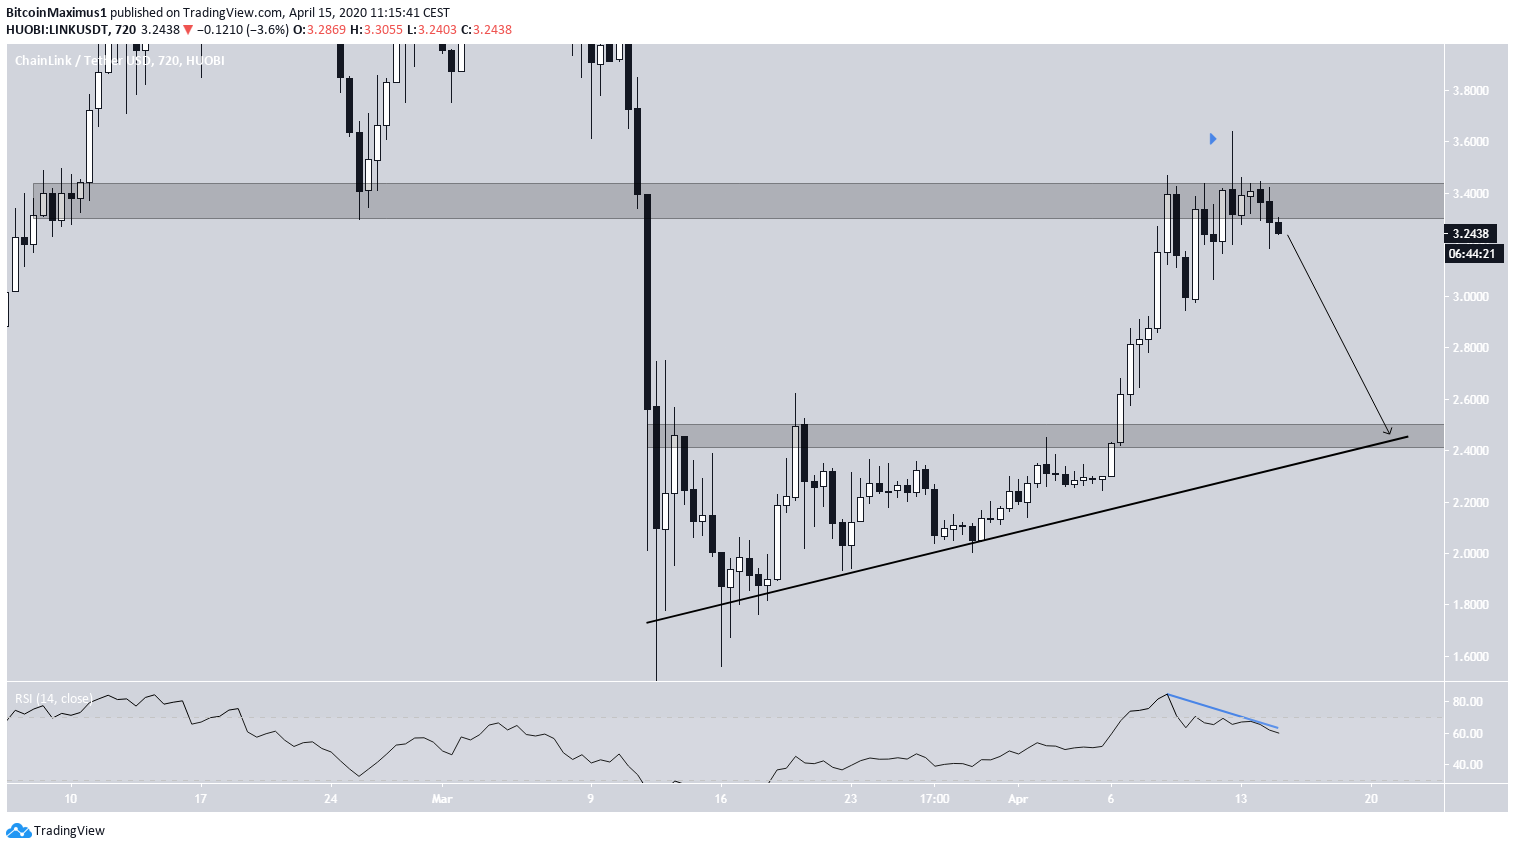
However, the price has reached the $3.40 resistance area and is in the process of being rejected, having created a long upper-wick and generated significant bearish divergence in the RSI.
If the price begins a downward move, which seems likely, it is expected to decrease all the way to $2.45, where it would validate both the ascending support line and the previous resistance area.
- Short-Term Outlook – Bearish
- Medium-Term Outlook – Bearish
- Long-Term Outlook – Bullish
Tezos (XTZ)
The XTZ price movement is very similar to that of Ethereum, in which the ascending support line is still intact and the price seems to be trading inside an ascending channel. To further confirm these similarities, XTZ also seems to be following a short-term descending resistance line.
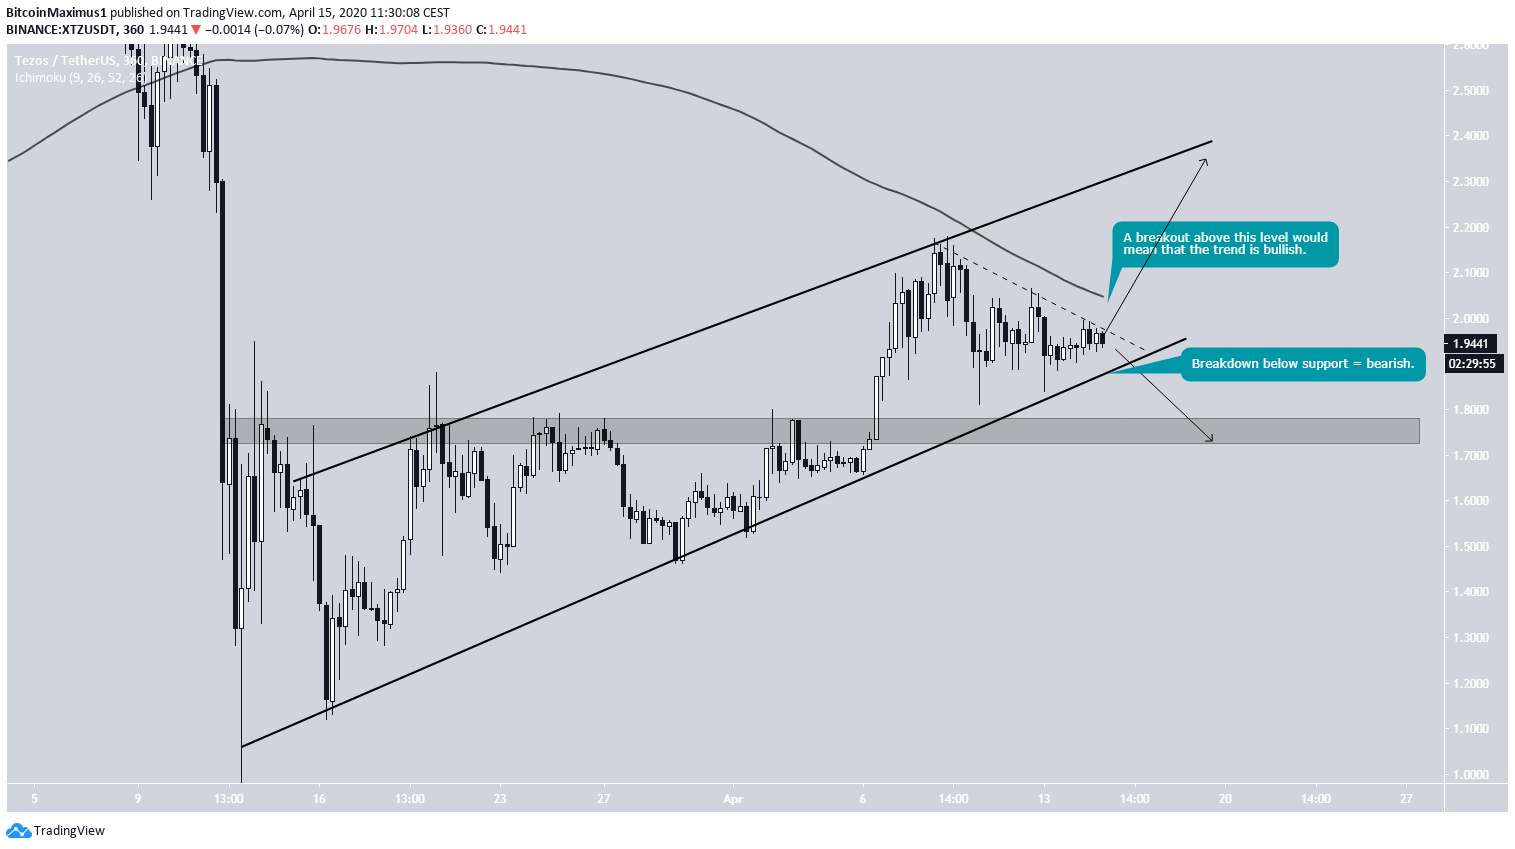
However, unlike Ethereum, there is no bullish divergence in the RSI to indicate that the price will break out above this line.
The current price movement is quite neutral. A breakout from the descending resistance line and the 50-day MA would most likely take the price towards $2.40, while a breakdown would likely cause XTZ to reach the support area at $1.75.
- Short-Term Outlook – Neutral
- Medium-Term Outlook – Neutral
- Long-Term Outlook – Neutral


