
Fractals are recurring patterns in which a price acts in a similar way as it did in a previous instance. While these movements are not identical and often do not transpire in the same length of time, they share several similarities, more specifically having comparable ratios between movements.
Repetitive patterns have very often been used in the price of Bitcoin in order to make price predictions for the future.
Cryptocurrency trader and enthusiast @SmartContracter identified a fractal that compares the breakdown in October 2018 which led to the low of $3200 to the recent breakdown on September 24, 2019.
keep shorting brave beras, your sacrifice will be remembered for the greater good 🙏 pic.twitter.com/Ru8MlkoVob
— Bluntz (@Bluntz_Capital) October 10, 2019
Additionally, the price movement after the breakdown shares several similarities.
If the price continues following the same pattern, it will very soon increase above $10,000.
Let’s see how likely this is to occur.
October 2018
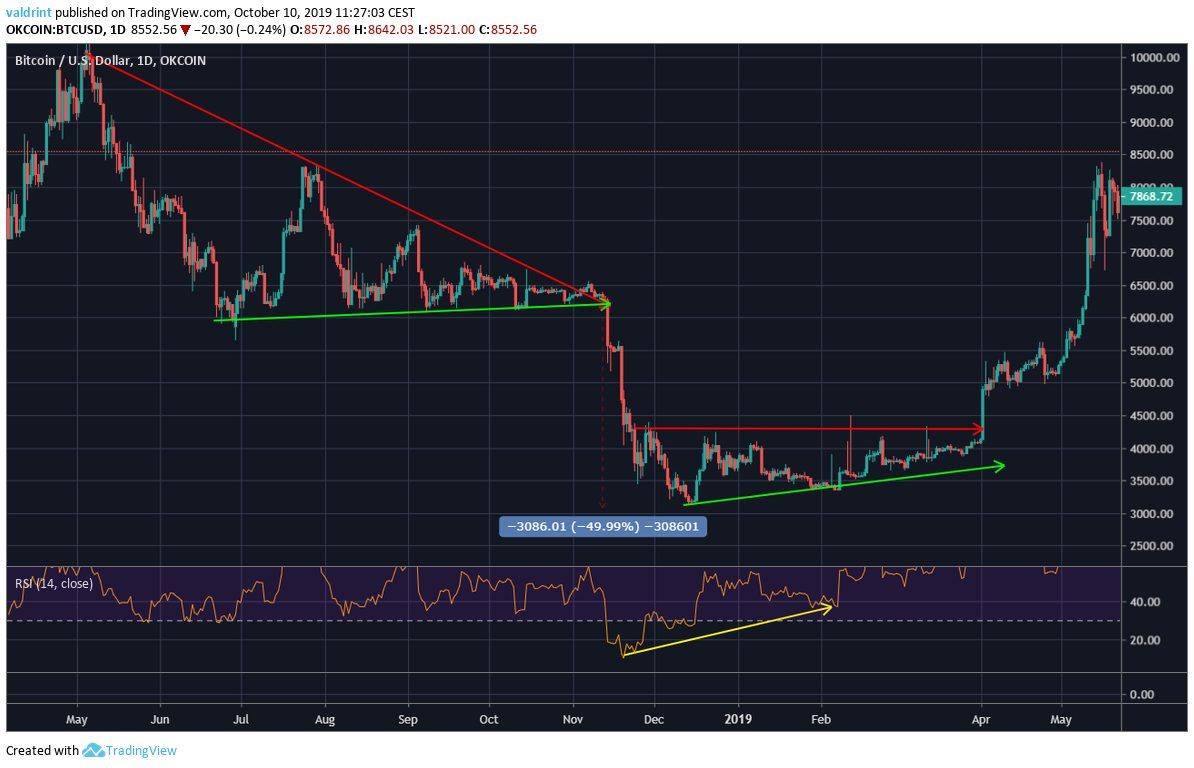
The Bitcoin price traded inside a symmetrical triangle for roughly 160 days in the period between June-October 2018.
Once it broke down, the price quickly decreased by roughly 50%.
After the breakdown, the price created an ascending triangle, trading inside it for roughly 130 days before breaking out.
The movement inside the triangle was combined with a bullish divergence in the RSI.
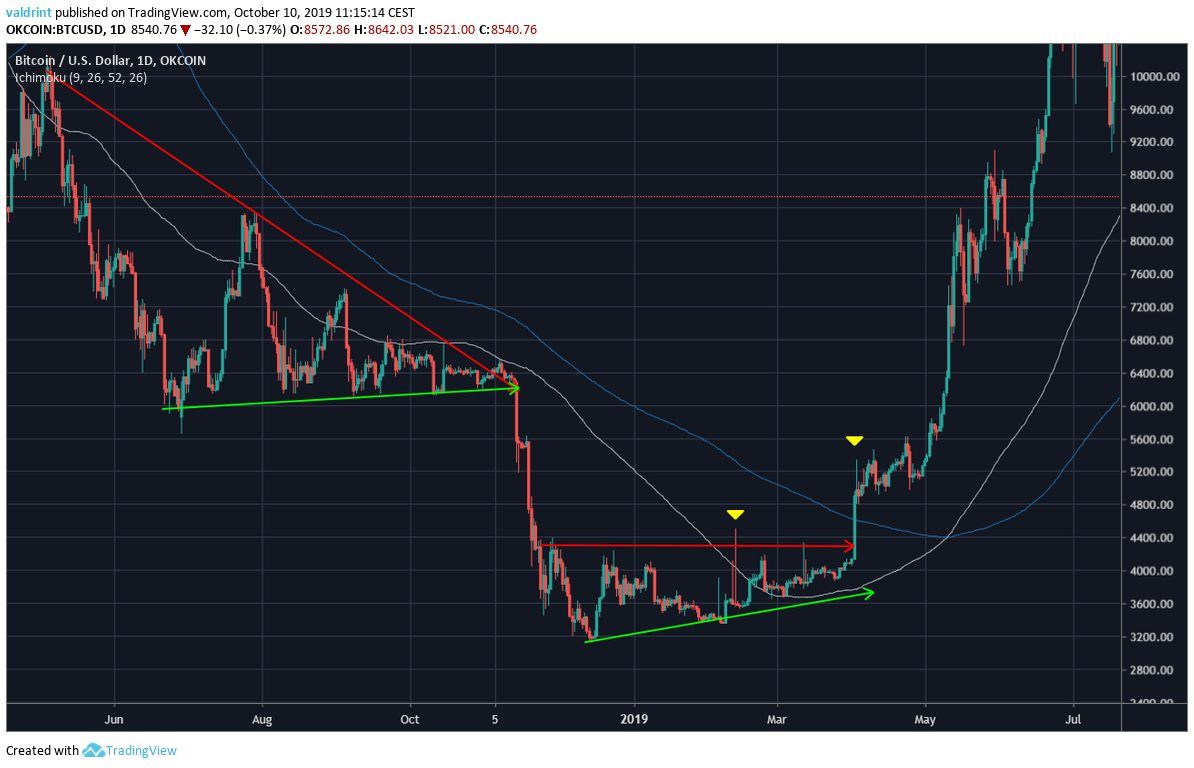
When we look at the moving averages (MA), we can see that the price traded below both the 100- and 200-day MAs throughout the breakdown.
It eventually moved above the 100-day MA in February 2019, and above the 200-day MA after breaking out above the triangle in the beginning of April.
September 2019
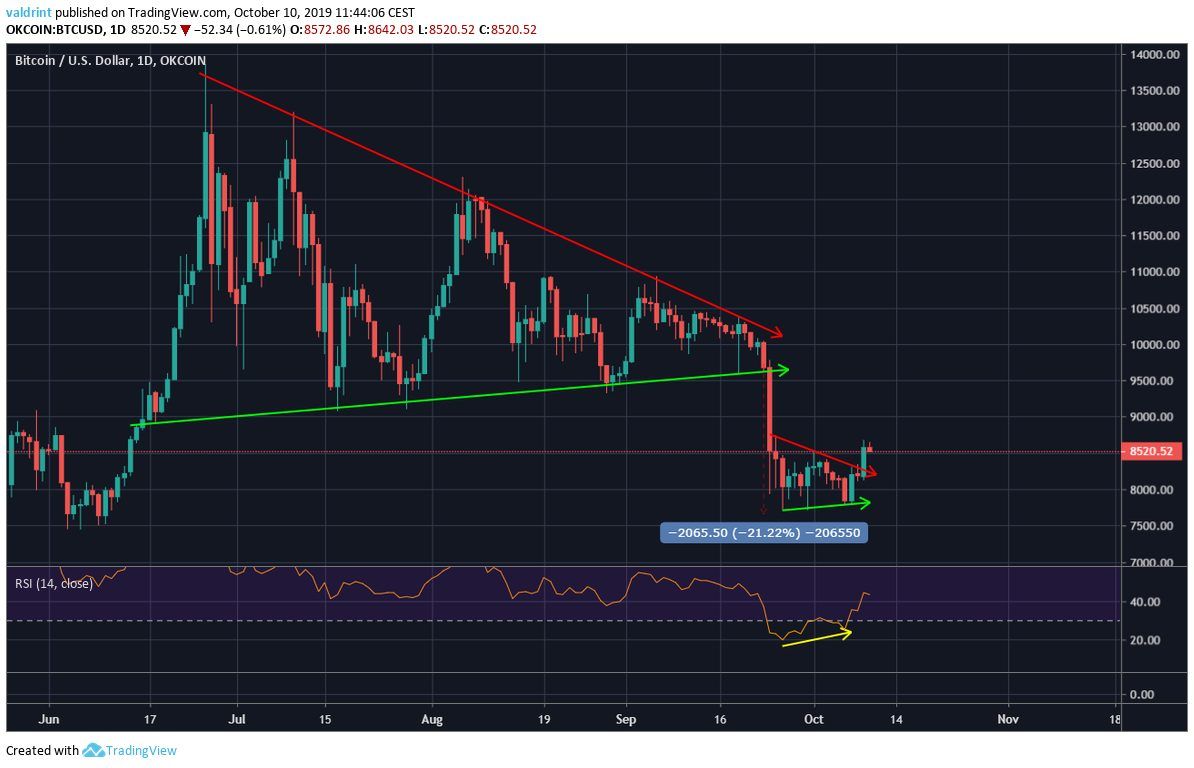
The price traded in a symmetrical triangle for roughly 100 days in the period from June – September 2019.
After the breakdown, the price decreased by slightly more than 20% and created another symmetrical triangle.
It traded inside it for 15 days, creating bullish divergence in the RSI before breaking out.
Also, looking at the moving averages, we can see that until the breakdown, the price traded above the 200-day MA.
The price fell below it afterwards and has been there since.

Similarities And Differences
There are notable differences and similarities between these two movements.
The similarities mostly come from the movement before the breakdown. Both times, the price traded inside symmetrical triangles for a long period of time (180 vs 100 days) before breaking down.
However, the movement after the breakdown has been very dissimilar.
First, the rate of decrease was 50% in 2018 and 21% in 2019.
In 2018, the price created an ascending triangle that lasted for 130 days, almost the same amount of time as the original triangle.
On the other hand, the discrepancy between the first and second triangle was much more pronounced in 2019, since the latter only lasted for 15 days after the price broke out.

Finally, the position of the MAs is very different.
In 2018, the 100-day MA was below the 200-day one, indicating that this movement was preceded by a downtrend.
On the other hand, in the 2019 movement, the 100-day MA was above than the 200-day one, indicating that the movement succeeded an uptrend.
Therefore, while these two movements have similarities, we do not believe that we can use the movement after the 2018 breakdown to predict the current movement.
Do you think the current Bitcoin price movement will mirror that of 2018? Drop your thoughts in the comments below.
Disclaimer: This article is not trading advice and should not be construed as such. Always consult a trained financial professional before investing in cryptocurrencies, as the market is particularly volatile.
Images are courtesy of Shutterstock, TradingView.
