


These two crypto analysts failed to make accurate predictions for the crypto market in July, particularly regarding the Bitcoin (BTC) price.
It can be difficult to time or predict the correct movements in the market; even some of the best in the business get it wrong. BeInCrypto looks at crypto analysts who were unfortunately incorrect in their analysis of Bitcoin in July.
Sweep of Range Lows Does Not Lead to a BTC Price Increase
On July 18, well-known cryptocurrency trader @Tradermayne tweeted a BTC price chart that shows a sweep of the range lows that had been in place since June 14. Previously, a sweep of the range lows combined with a reclaim led to a significant movement in the other direction and numerous touches of the range high at $31,000.
More specifically, it led to a new yearly high of $31,800 on July 13.
Tradermayne noted that an increase to the range’s midline or even the top of the range could occur as a result of this sweep (green icon).
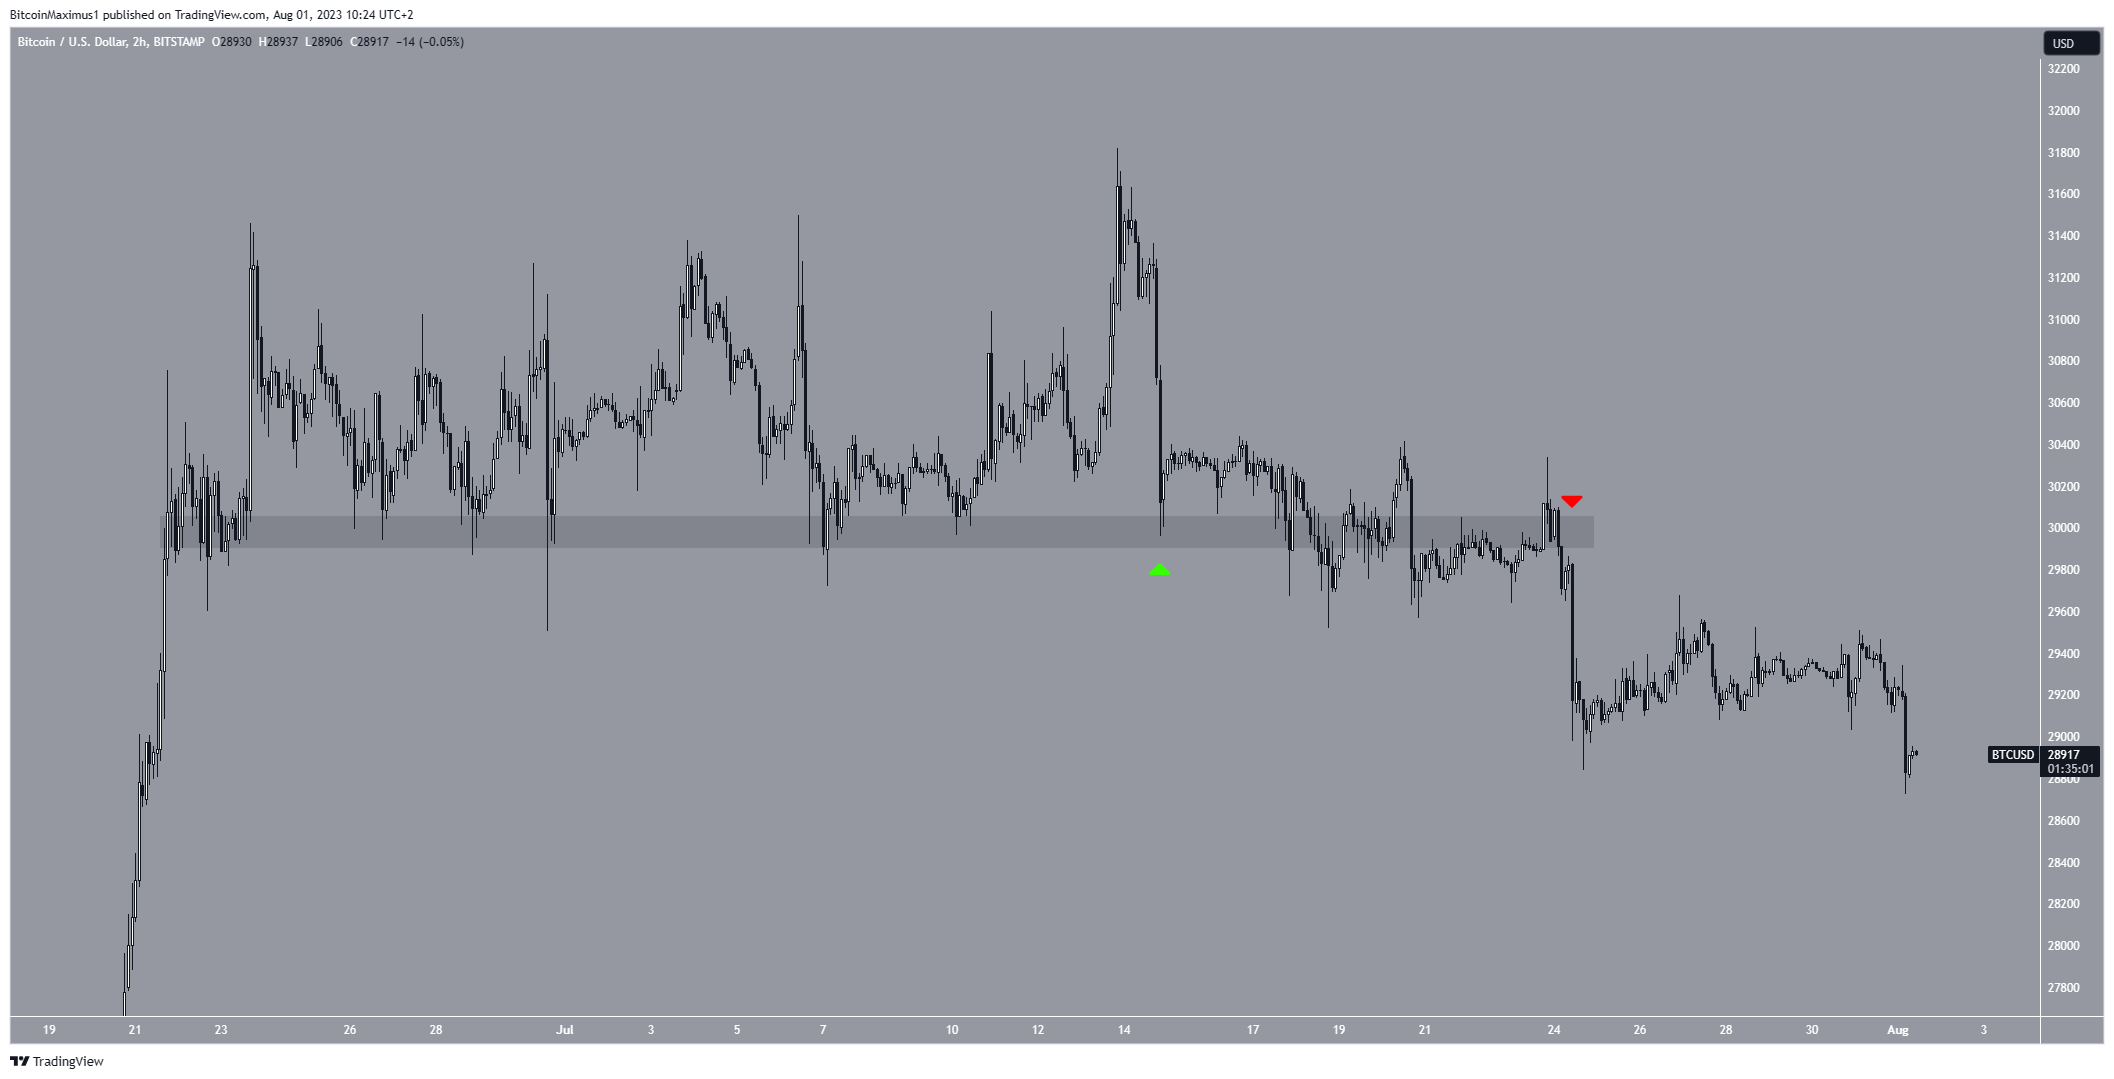
However, this was not the case. After a weak bounce, the BTC price fell and closed below the range lows. The rate of decrease accelerated on July 24 (red icon) and the BTC price now trades at $28,900.
Therefore, the sweep and reclaim of the range lows was not accurate in predicting the BTC price movement in July.
Empower your investments with price predictions: Bitcoin (BTC) Price Prediction
Cup And Handle Pattern Does Not Materialize
Well-known crypto analyst @TheMoonCarl tweeted a Bitcoin chart a massive cup and handle pattern. This is considered a bullish pattern that often leads to significant upward movements.
Additionally, a breakout and increase that travels the entire height of the pattern (white icon) would take the BTC price to $45,000, a level not seen since early 2022.
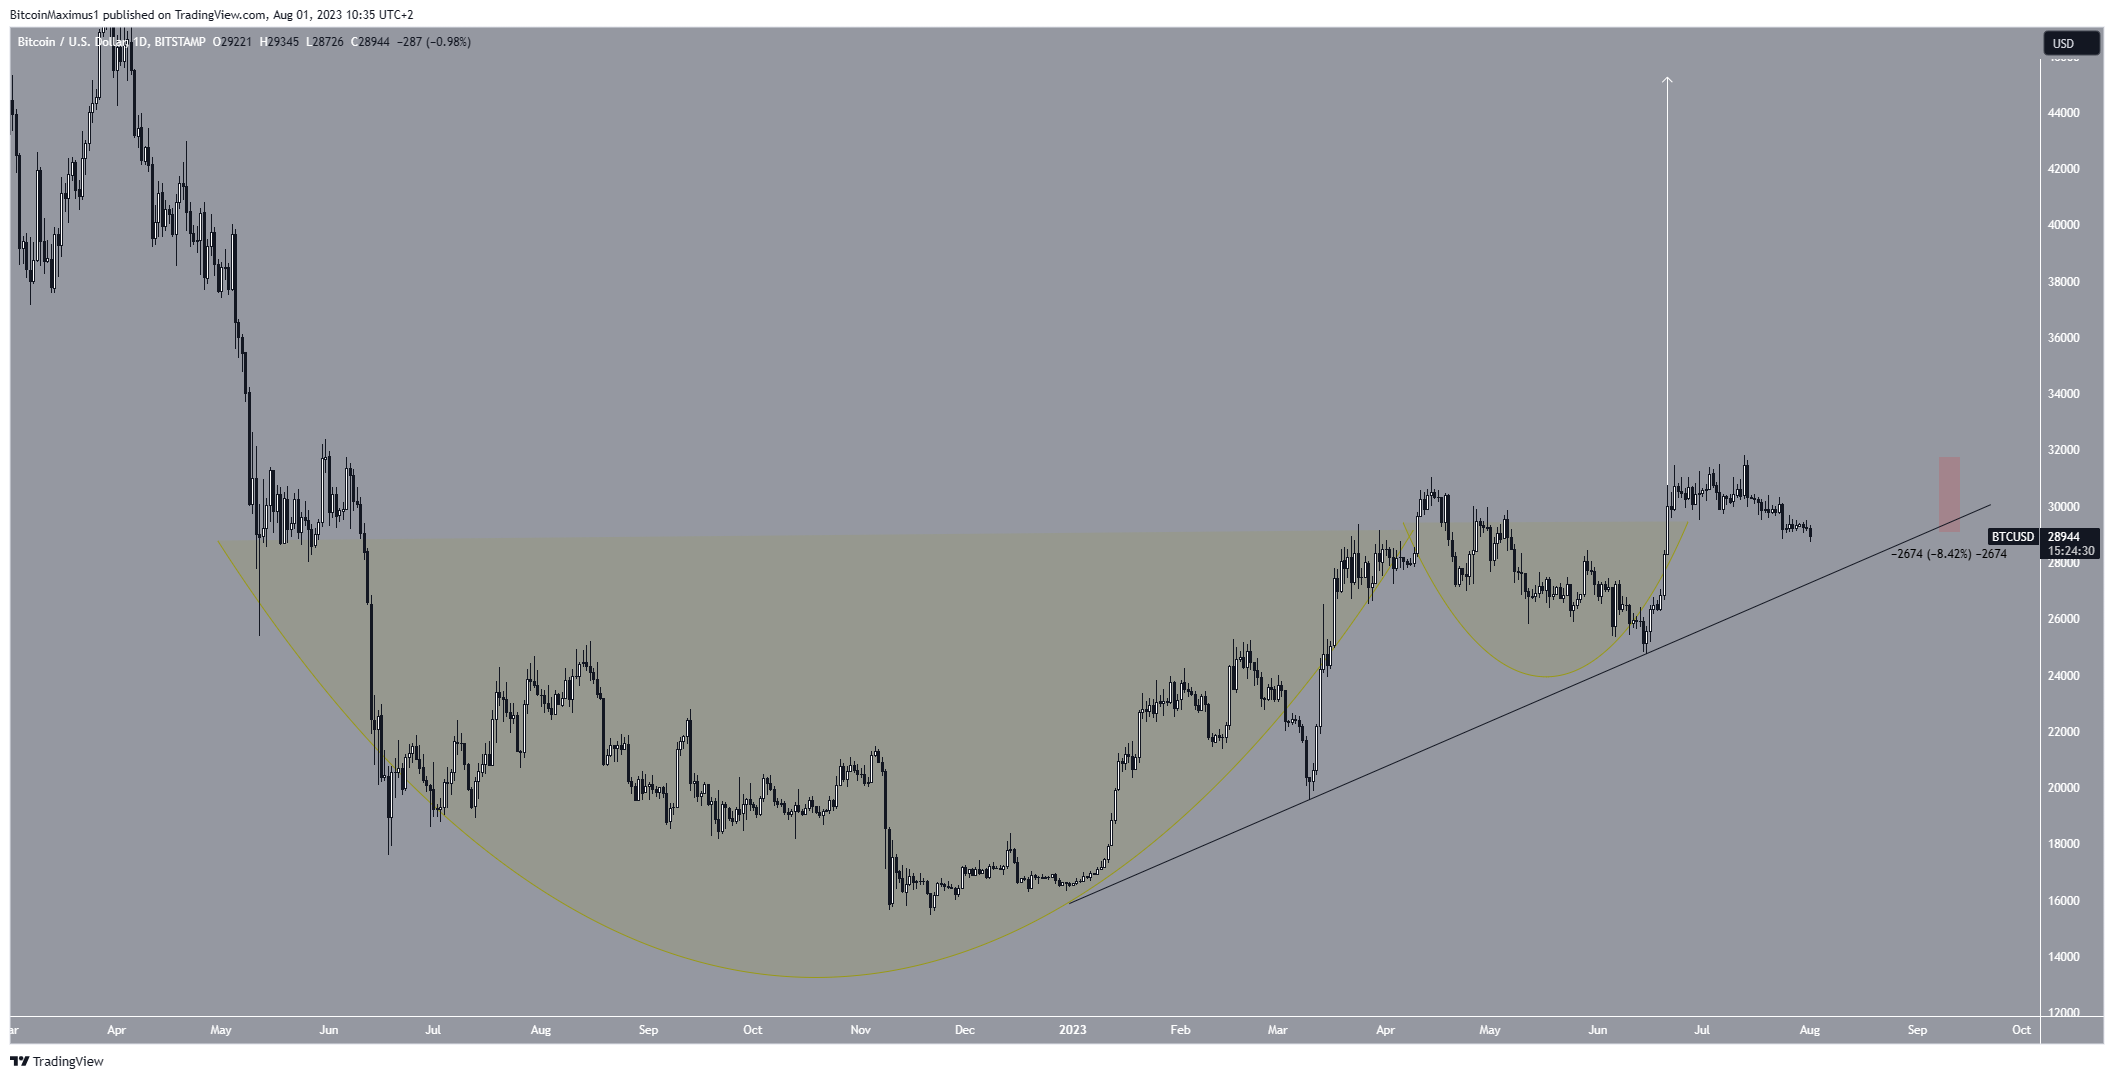
However, the BTC price fell almost immediately after the tweet. It has decreased by 9% since. The pattern is not technically invalid yet, since Bitcoin could still be in the portion of the “handle”. But, the decrease makes it very unlikely that this was the correct pattern.
A close below a long-term ascending support line at $27,500 will mean that the pattern is invalid and the BTC price will fall to at least $24,000.
For BeInCrypto’s latest crypto market analysis, click here.


