
The Cosmos (ATOM) price is attempting to break out from the $10 resistance area. If it is successful, an upward movement toward $12.80 could ensue.
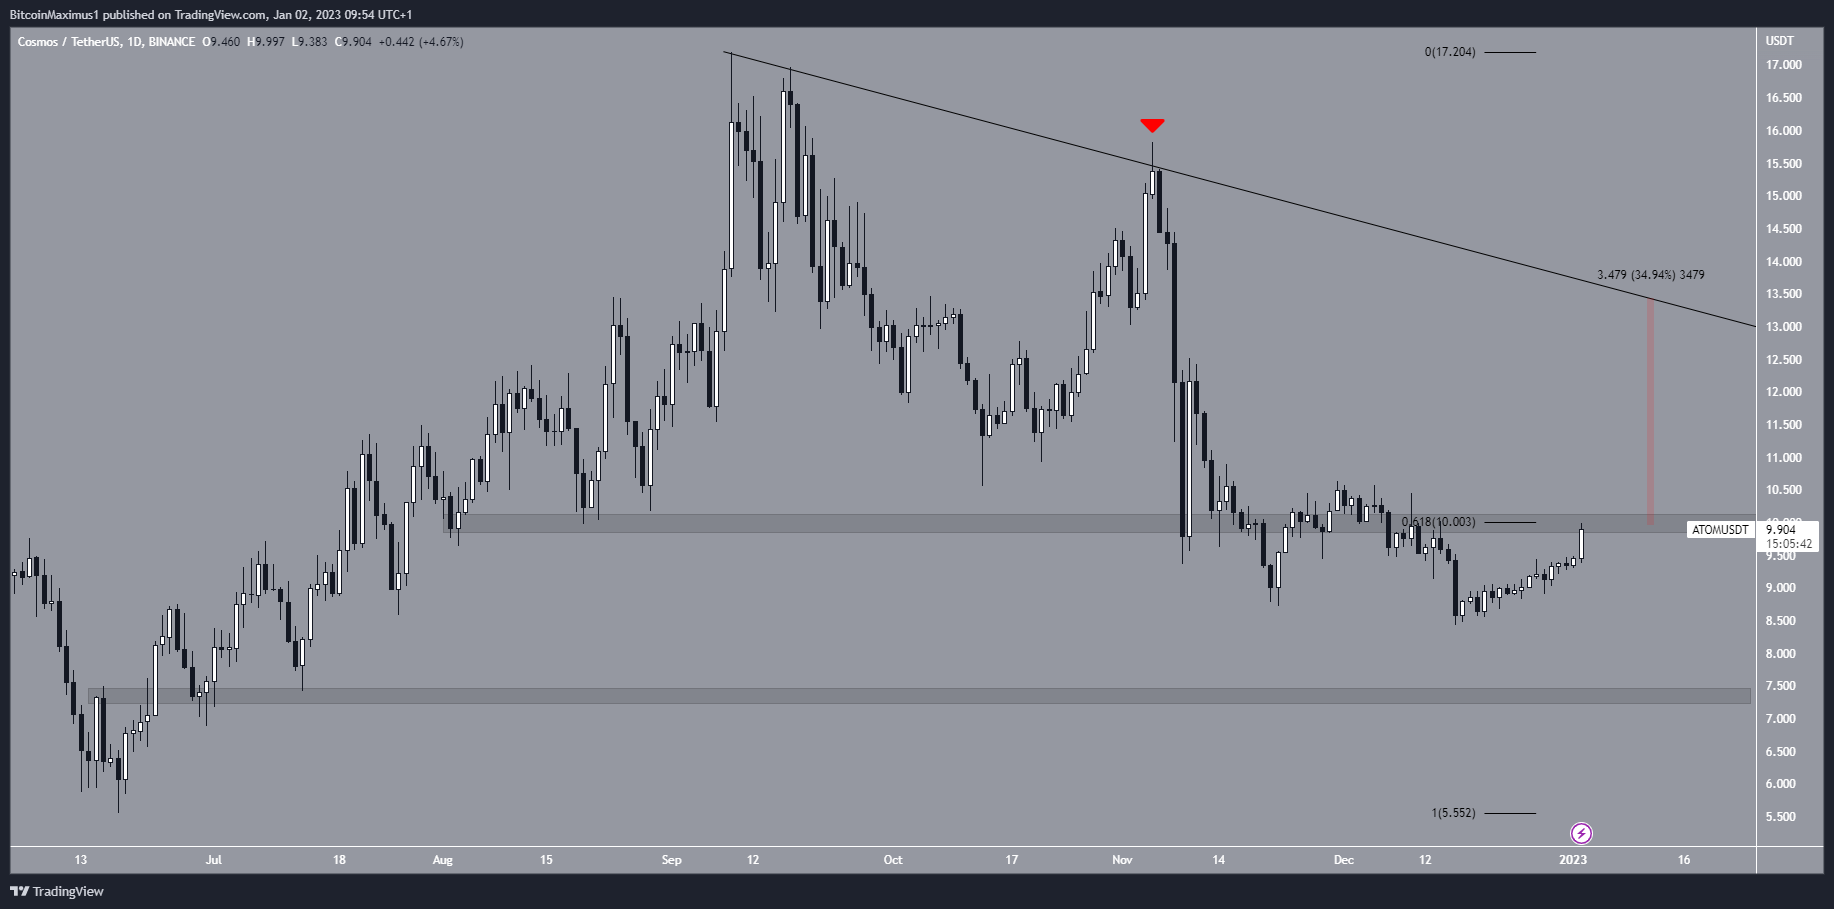
The ATOM price has fallen below a descending resistance line since reaching a high of $17.20 on Sept. 9. More recently, the line caused a rejection on Nov. 5 (red icon), initiating the current downward movement, which led to a low of $8.43 on Dec. 16. An upward movement began afterward which accelerated over the past 24 hours.
Throughout the drop, the most important horizontal area has been at $10. While the ATOM price sometimes deviated above and below, it respected the area as either resistance or support most of the time. The area is also the 0.618 Fib retracement support level when measuring the entire increase.
Since the Cosmos price has reached the area from below, whether it breaks out or gets rejected could determine if the ATOM price analysis is bullish or bearish.
If a breakout occurs, the Cosmos price could increase to an average price of $12.80, reaching the descending resistance line. This would amount to an upward movement of 35% measuring from the current price. On the other hand, a rejection could lead to a decrease toward $7.35.
ATOM Price Prediction for Jan – Will Increase Continue?
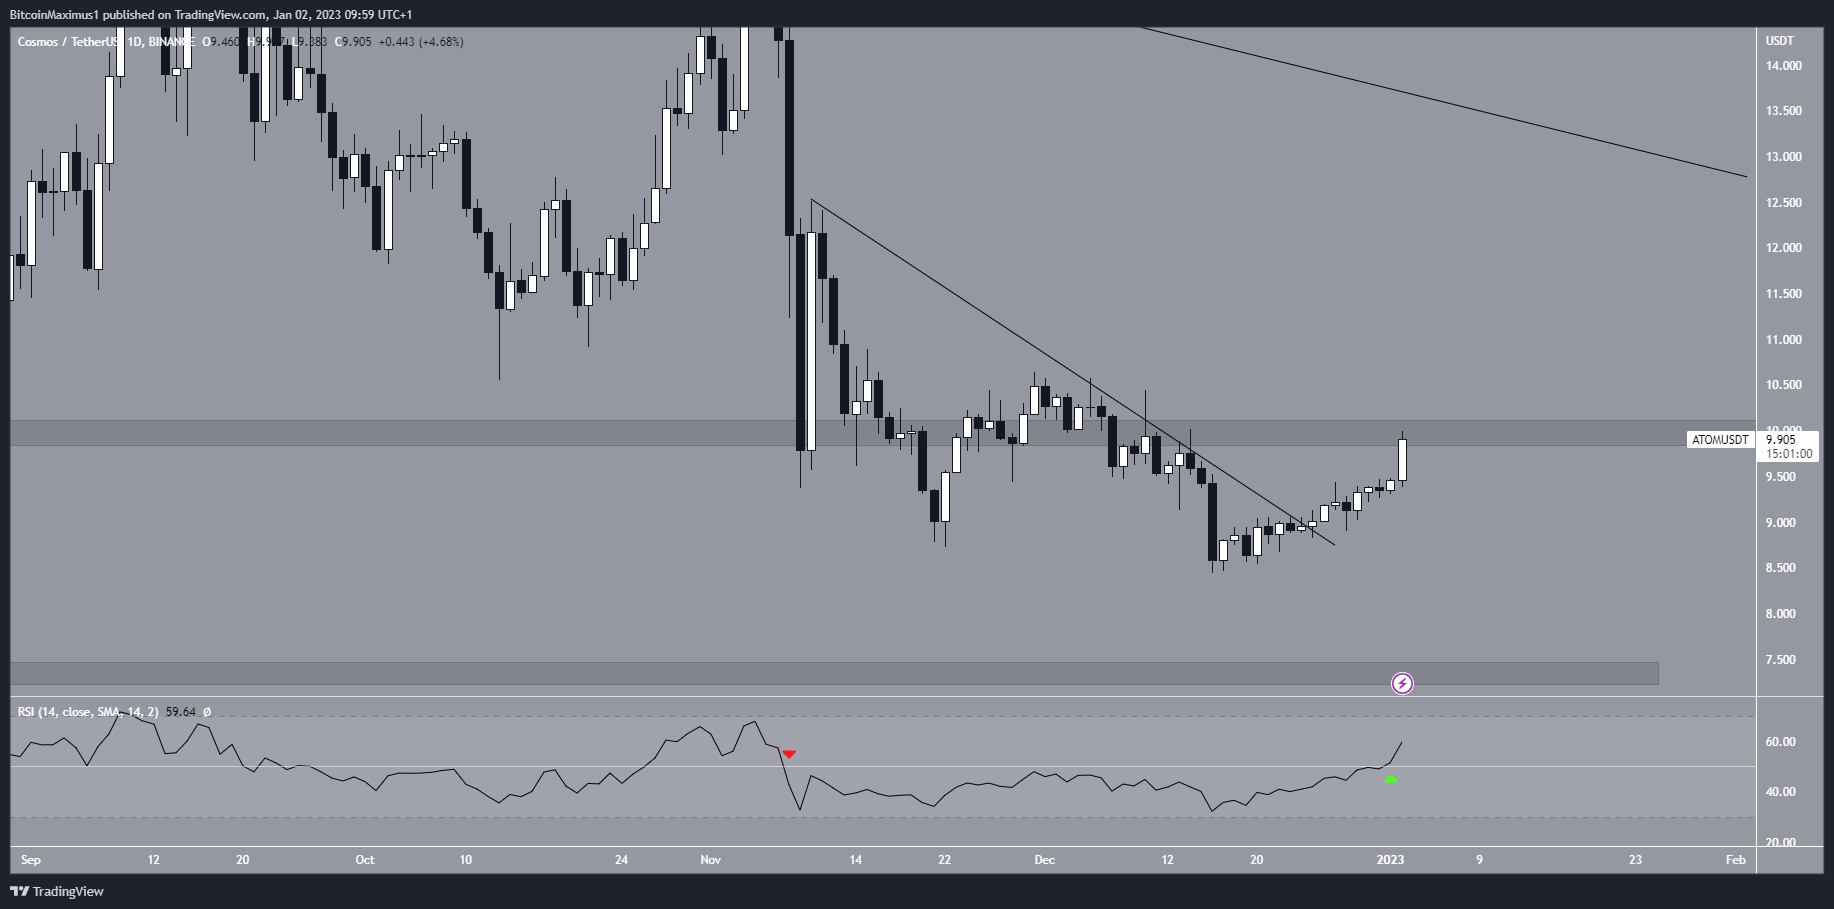
A closer look at the technical analysis from the daily time frame provides a bullish ATOM price prediction for Jan. There are two main reasons for this:
- The daily RSI has moved above 50
- The ATOM price broke out from a short-term descending resistance line
The RSI movement is crucial since the indicator had traded below 50 since Nov. 8, the same time the short-term resistance line was created. As a result, the fact that the RSI increase above 50 coincided with the resistance line breakout further increases its legitimacy.
So, if the Cosmos price is successful in moving above the $10 resistance area, an upward movement toward the descending resistance line at $12.80 would be expected.
To conclude, the most likely ATOM price analysis is an upward movement toward a long-term descending resistance line at $12.80. However, this Cosmos price forecast holds true only if the price manages to reach a daily close above $10. Failure to do so could lead to a drop toward $7.35.
For BeInCrypto’s latest crypto market analysis, click here.
