
The Cosmos (ATOM) price broke out from its main obstacle and could continue moving toward its next closest resistance.
ATOM, the native token of the cosmos ecosystem, has been increasing since Dec. 17. The upward movement led to the year’s highest price of $15.23 on Feb. 2.
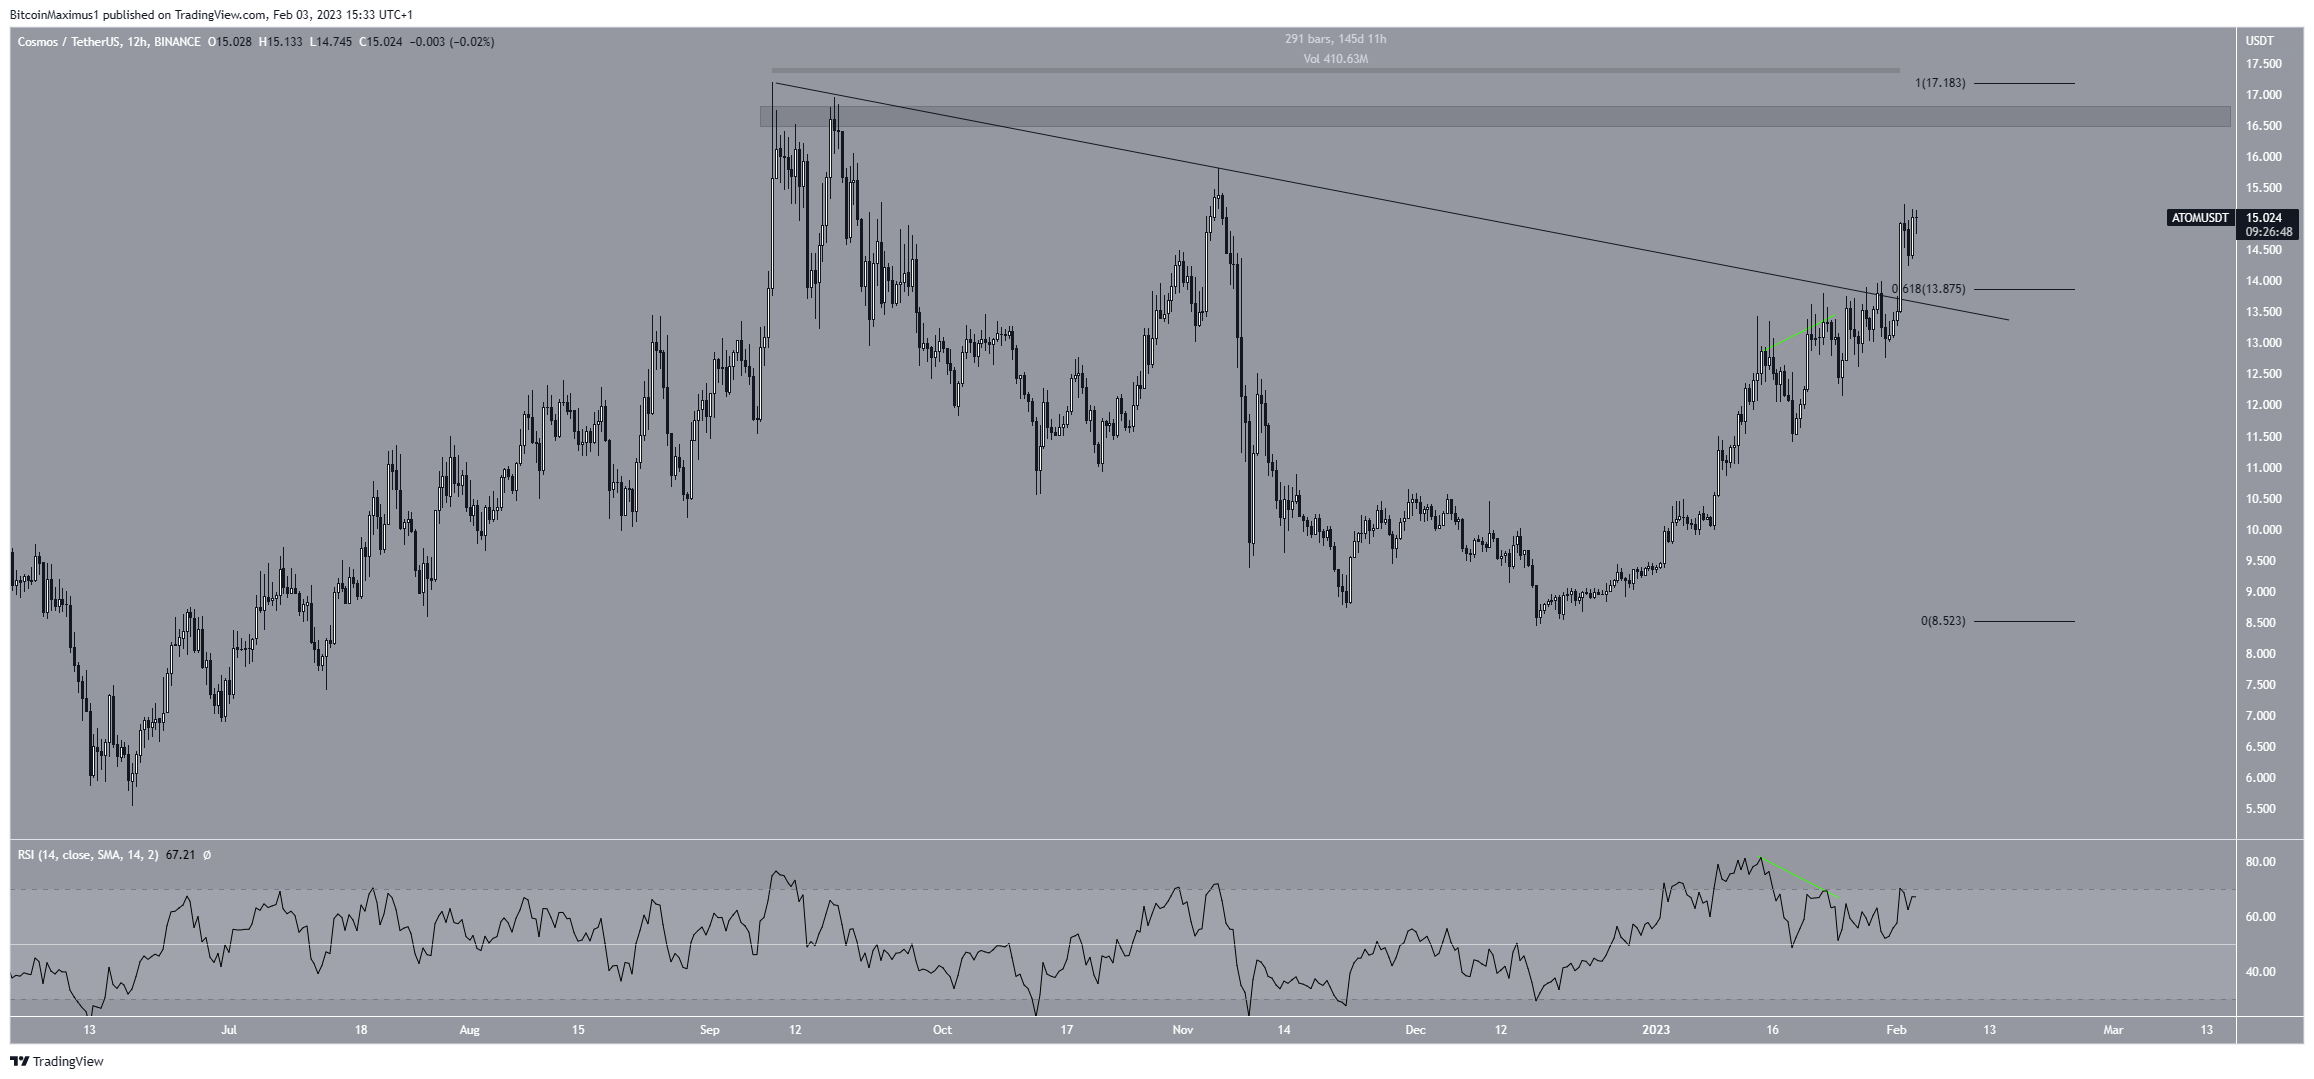
Moreover, the ATOM price broke out from a descending resistance line on Feb. 1. The breakout was crucial for two main reasons:
Firstly, the line had been in place for 145 days. Breakouts from such long-term structures usually lead to significant upward movements.
Secondly, the line coincided with the 0.618 Fib retracement resistance level at $13.87, increasing its significance. Now, the area is expected to provide support in case the increase loses momentum.
The daily RSI readings are interesting. The indicator previously generated bearish divergence (green line), causing a slight price drop. But, it has begun to increase once more and could soon break out above 70.
As a result, the most likely Cosmos price forecast is an increase toward the $16.65 resistance area.
Conversely, a daily close below the $13.87 support and the previous resistance line would invalidate this bullish analysis. In that case, the ATOM token price could fall toward $11.
Cosmos Price Continues to Outperform Bitcoin
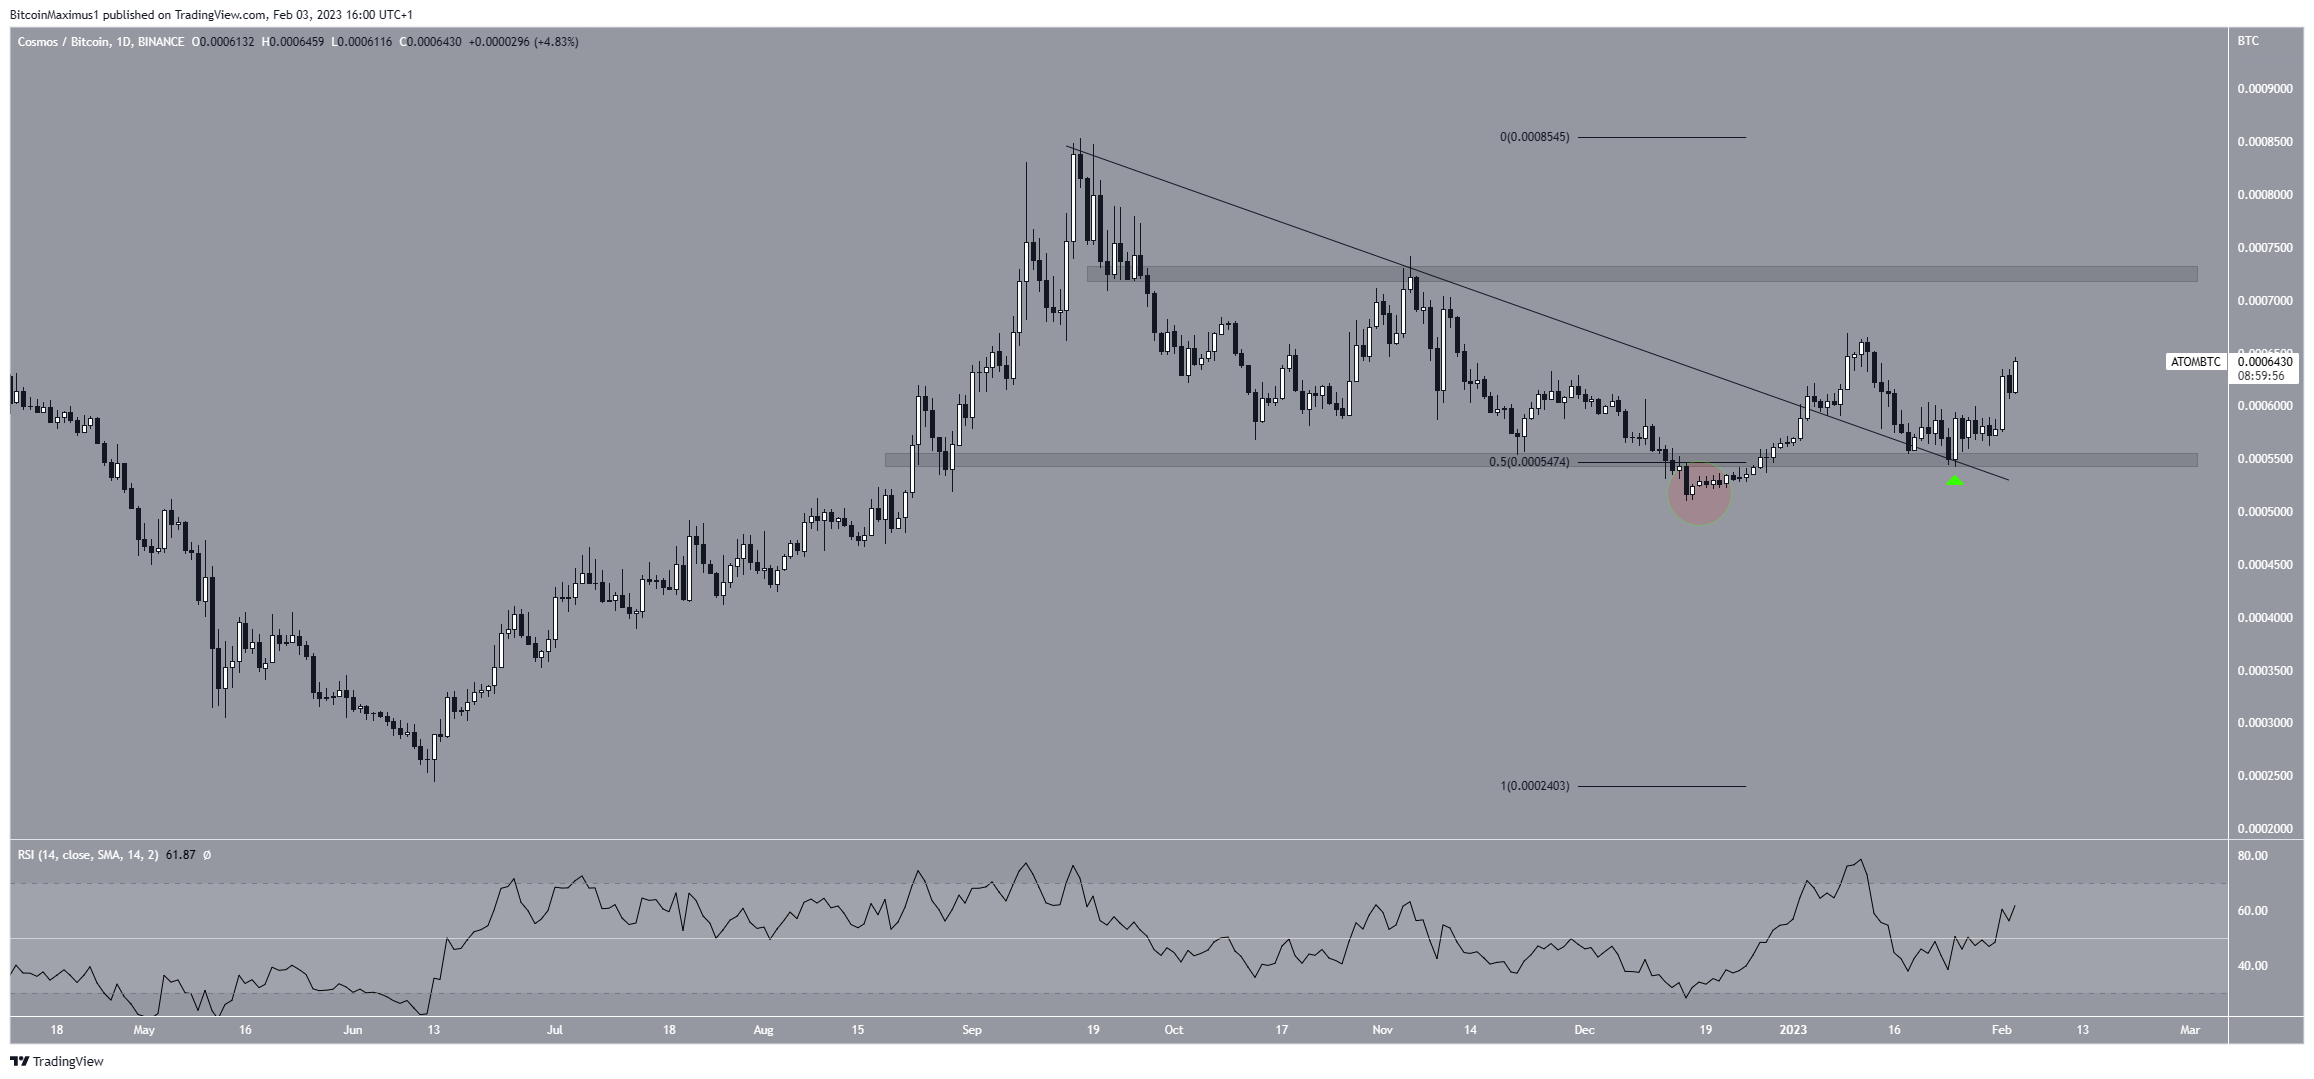
The technical analysis for ATOM/BTC is decisively bullish. There are three reasons for this:
Firstly, the price reclaimed the 55,000 Satoshi support area after previously deviating below it (red circle). This is a bullish sign that often precedes bullish trend reversals.
Secondly, the price broke out from a descending resistance line and validated it as support afterward (green icon).
Finally, the daily RSI moved above 50, and the price created a bullish candlestick over the past 24 hours.
If the upward movement continues, the closest resistance area would be at 72,000 Satoshis. On the other hand, if the rally loses steam, the ATOM price could fall back to the 55,000 satoshi support area.
To conclude, the price forecast for both ATOM/USDT and ATOM/BTC is bullish. Daily closes below the horizontal support levels at $13.87 and 55,000 Satoshis, respectively, would invalidate these bullish forecasts. In that case, the price could fall to $11 and 40,000 Satoshis, respectively.
For BeInCrypto’s latest crypto market analysis, click here.
