


Measuring from the Dec. 17, 2017 all-time high, the Bitcoin price has been correcting for 819 days. The decrease has been very substantial, with the price having lost 63% of its value. A very similar movement occurred to the Nasdaq index during the 2000 dot-com bubble.
Well-known trader @CryptoCapo_ made a comparison of the current BTC price movement and that of the Nasdaq Composite during the 2000 dot-com bubble, while also outlining the ”emotional phases of a market cycle.” According to him, it is possible that the March 13 bottom was the final low after the ”disbelief” high of June, and the price will continue to move upward afterward.
This is the only chart that ''scares me''
I will have no problem becoming bullish if the bearish analysis is validated. https://t.co/pXecHQN8Ng pic.twitter.com/Q5ufQdcUgv
— il Capo Of Crypto (@CryptoCapo_) April 6, 2020
Right after the March 13 decrease, we wrote an article comparing the two crashes. Since the price has increased considerably since, it seems like a good time to revisit our prediction and see how the actual movement compares to the predicted one.
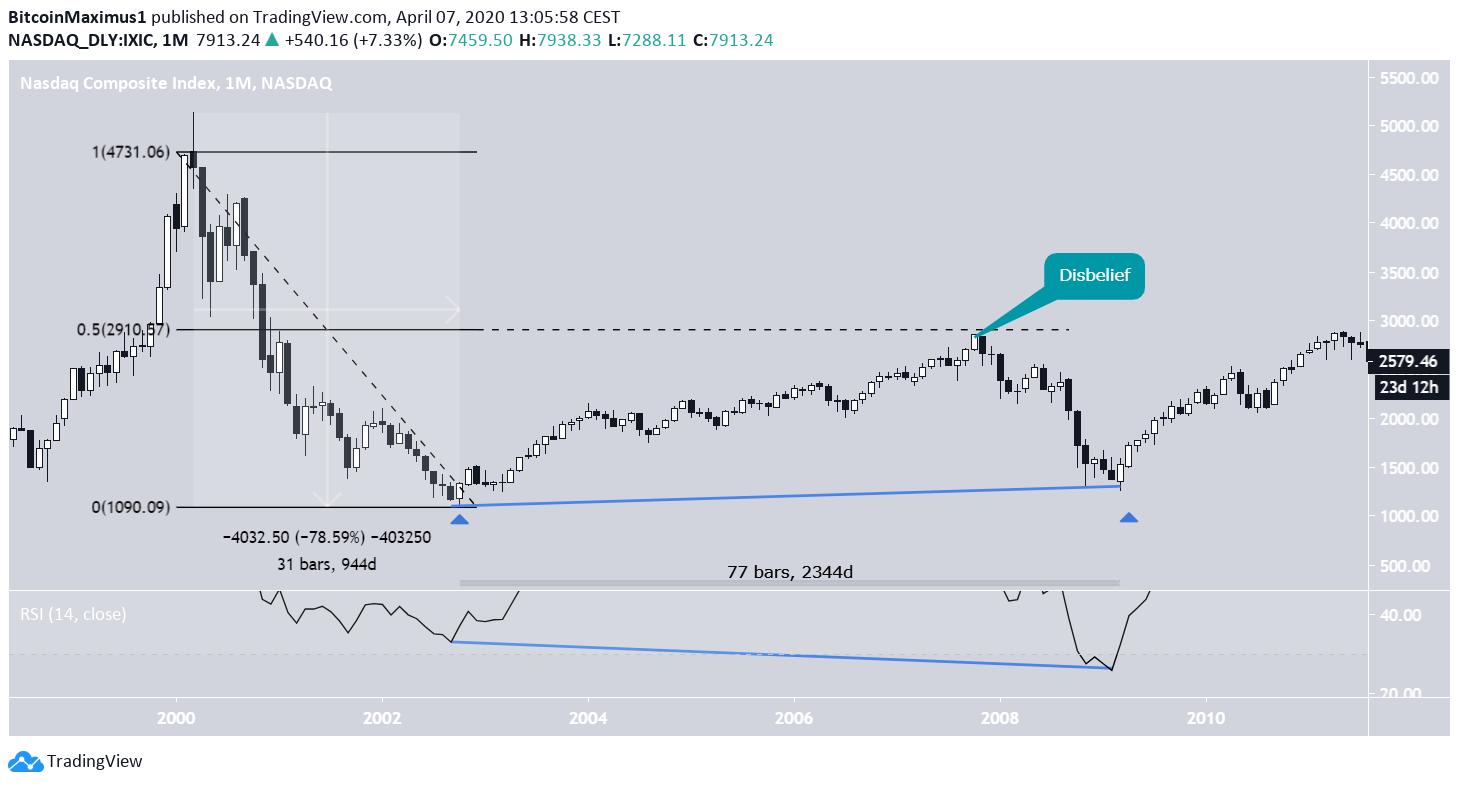
Nasdaq
The Nasdaq index reached a high of $5,132 in March 2000. Afterward, it decreased rapidly, losing 78.59% of its value over the next 944 days, culminating with a low of $1,108 in October 2002.
Afterward, the price began an upward move. In October 2007, it reached a high of $2,871, coinciding with the 0.5 Fib level of the entire previous decrease. According to the tweet, it is possible that this was the ”disbelief” high. The ensuing decrease took the price to its final low of $1,265, which was reached in March 2009. The price has been increasing ever since.
It took 2,344 days for the price to move from the first to the second bottoms. In addition, the monthly RSI generated hidden bullish divergence.
Bitcoin
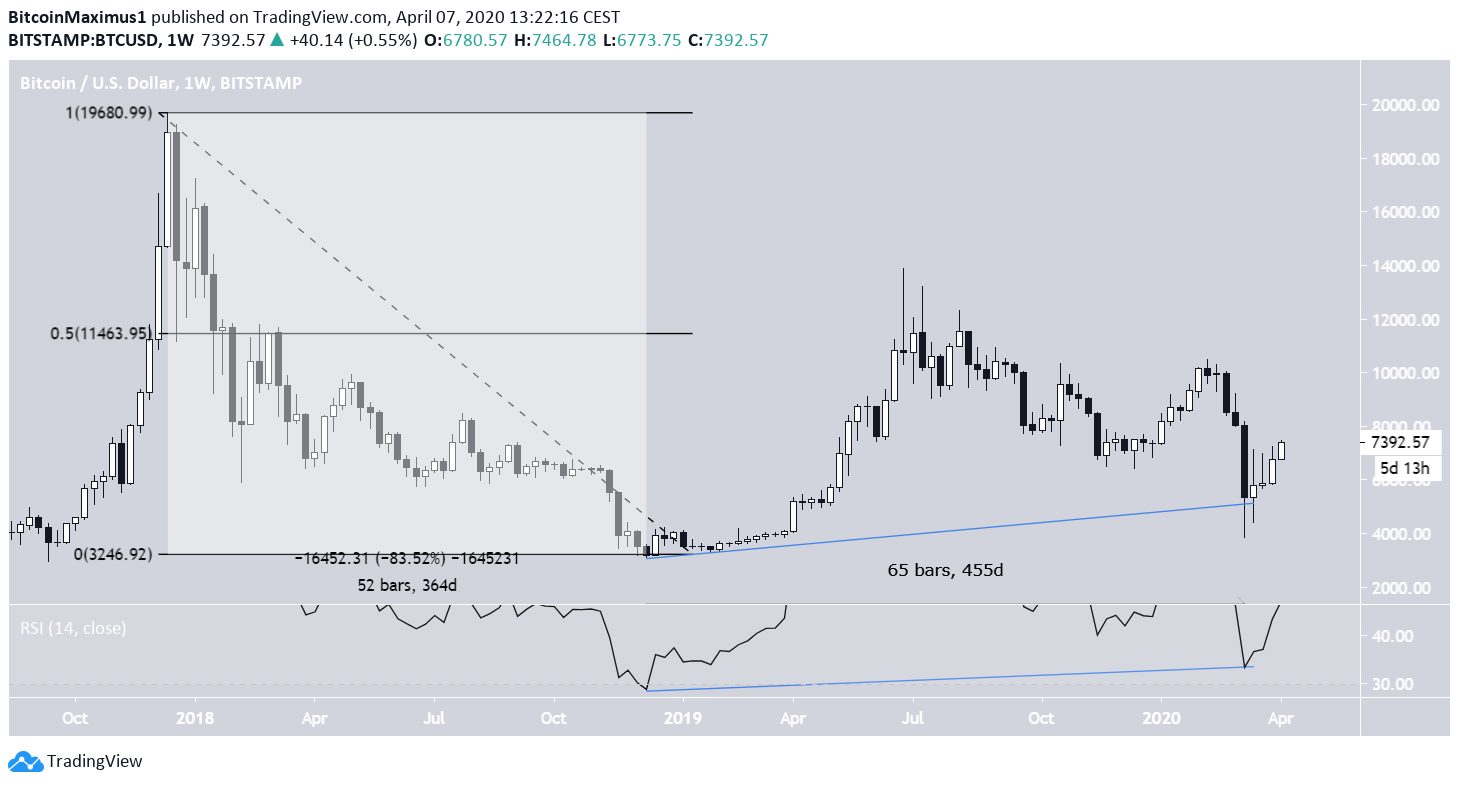
The Bitcoin price reached a high of $19,667 on Dec. 17, 2017. At the time of writing, this still remains the all-time high. Afterward, the price began to decrease, losing 83% of its value over the next 364 days. This caused it to reach a low of $3,122 in December 2018.
The price began to increase afterward, reaching a high of $13,764 in June 2019, right at the 0.5 Fib level of the entire previous decrease. This movement is identical to that of the Nasdaq Composite index. The ensuing decrease caused the price to reach a low of $3,850 on March 11.
The time period between the two lows offers the principal difference between these two movements. The time between these two lows was 455 days in the Bitcoin movement, which is about 1.3 times higher than the time required for the price to drop from the all-time high to the first low, which was 364 days. To the contrary, this ratio was more than 2.5 in the Nasdaq movement, almost twice bigger.
In addition, the weekly RSI did not generate straight nor hidden bullish divergence.
We stated in our previous article, ”In order for this low to be the ‘disbelief’ one, it has to be a higher low in relation to that reached in December 2018. A price close below $3,200 would invalidate this possibility.”
This still remains true, allowing for the possibility that the current BTC movement will mirror that of the Nasdaq after 2009, at least to a certain degree.
To conclude, the ongoing BTC decrease since the December 2017 all-time high shares numerous similarities with that of the Nasdaq Composite index after the dot-com bubble burst. In order for the similarities to remain valid, the BTC price has to stay above $4,000.


