


The Chainlink (LINK) price is at risk of breaking down from the $6 horizontal support area, something which could trigger a 25% fall.
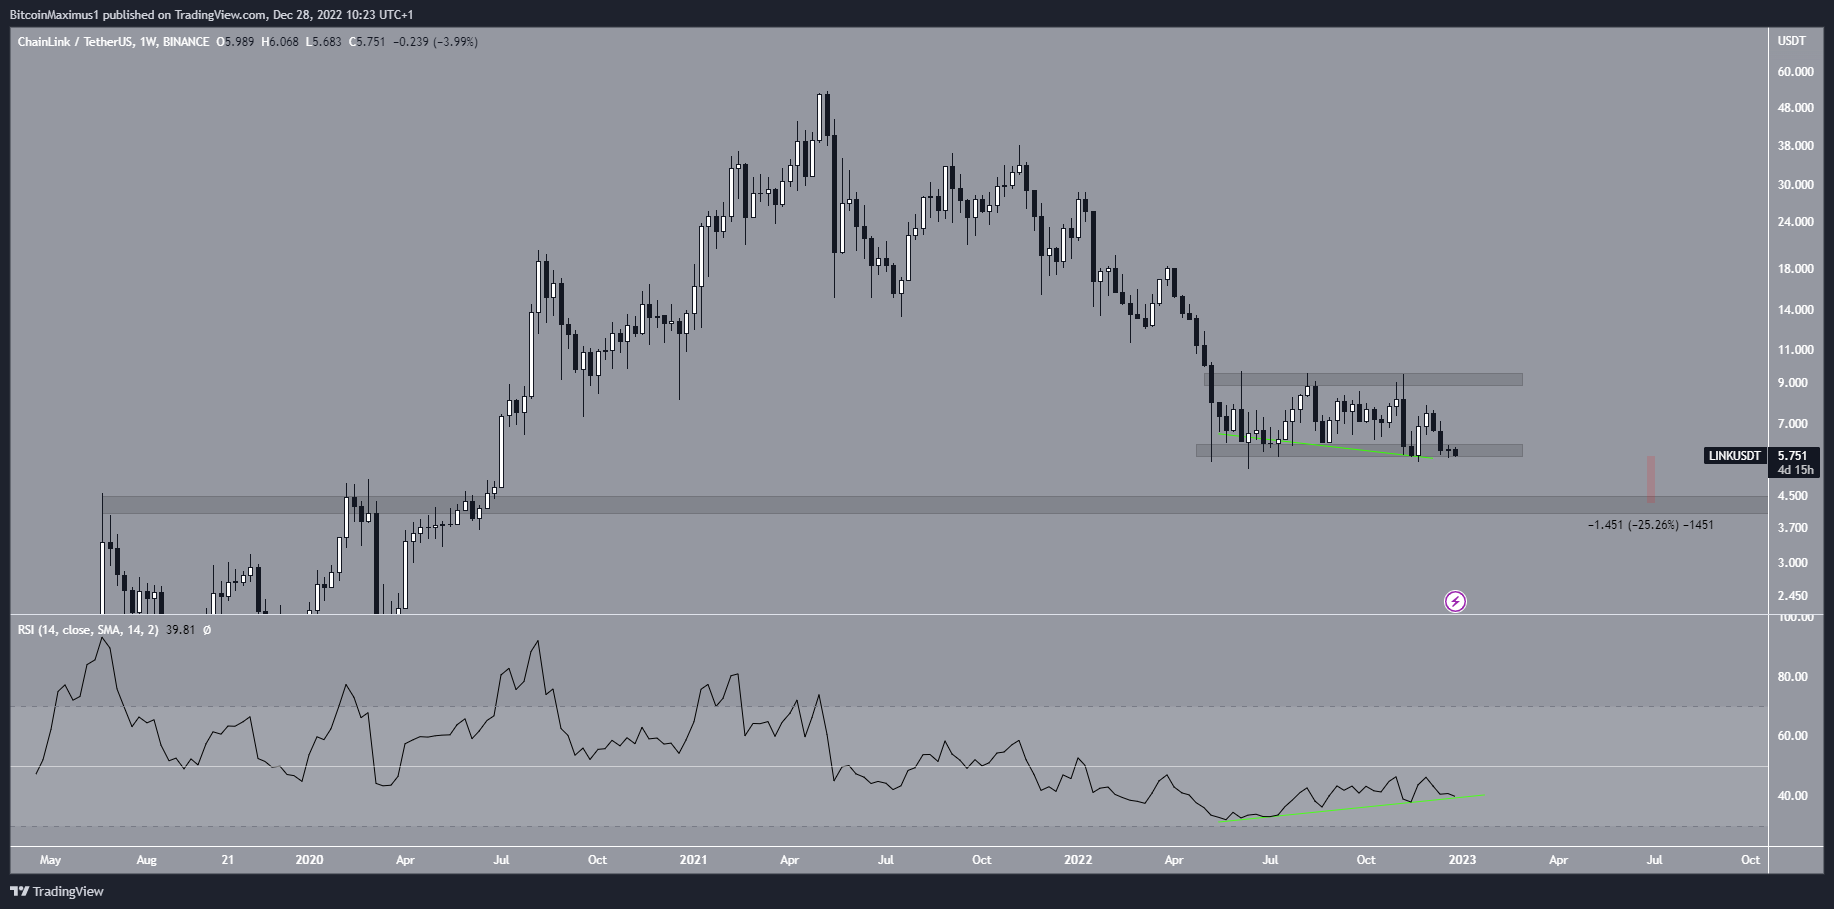
The LINK price has fallen since reaching a maximum price of $53 in May 2021. The downward movement led to a low of $5.30 in June 2022.
Since then, the LINK price has hovered above the $5.80 horizontal support area. During this time, the weekly RSI generated a bullish divergence (green line), something that often precedes upward movements. However, both the trendline of the divergence and the $6 horizontal support area are at risk of breaking down.
If this occurs, the LINK price could fall toward the next support at $4.30. This would amount to a drop of 25%. Currently, this seems to be the most likely Chainlink price prediction for January. Conversely, a bounce at the $6 support area would likely lead to a bounce toward the $9.20 resistance area.
Chainlink Price Prediction For January
The daily chart supports the possibility that the LINK price will break down from the $5.80 support area. The main reason for this is that the daily RSI broke its bearish divergence trendline. This is a sign that the direction of the future price movement is bearish. The decrease has also accelerated over the past 24 hours.
Moreover, the LINK price is following a descending resistance line that has been in place since the beginning of November. The line could reject the price if a bounce occurs. In case of a breakout, it is possible that LINK will reach $7.50, the 0.5 Fib retracement resistance level, and a horizontal resistance area.
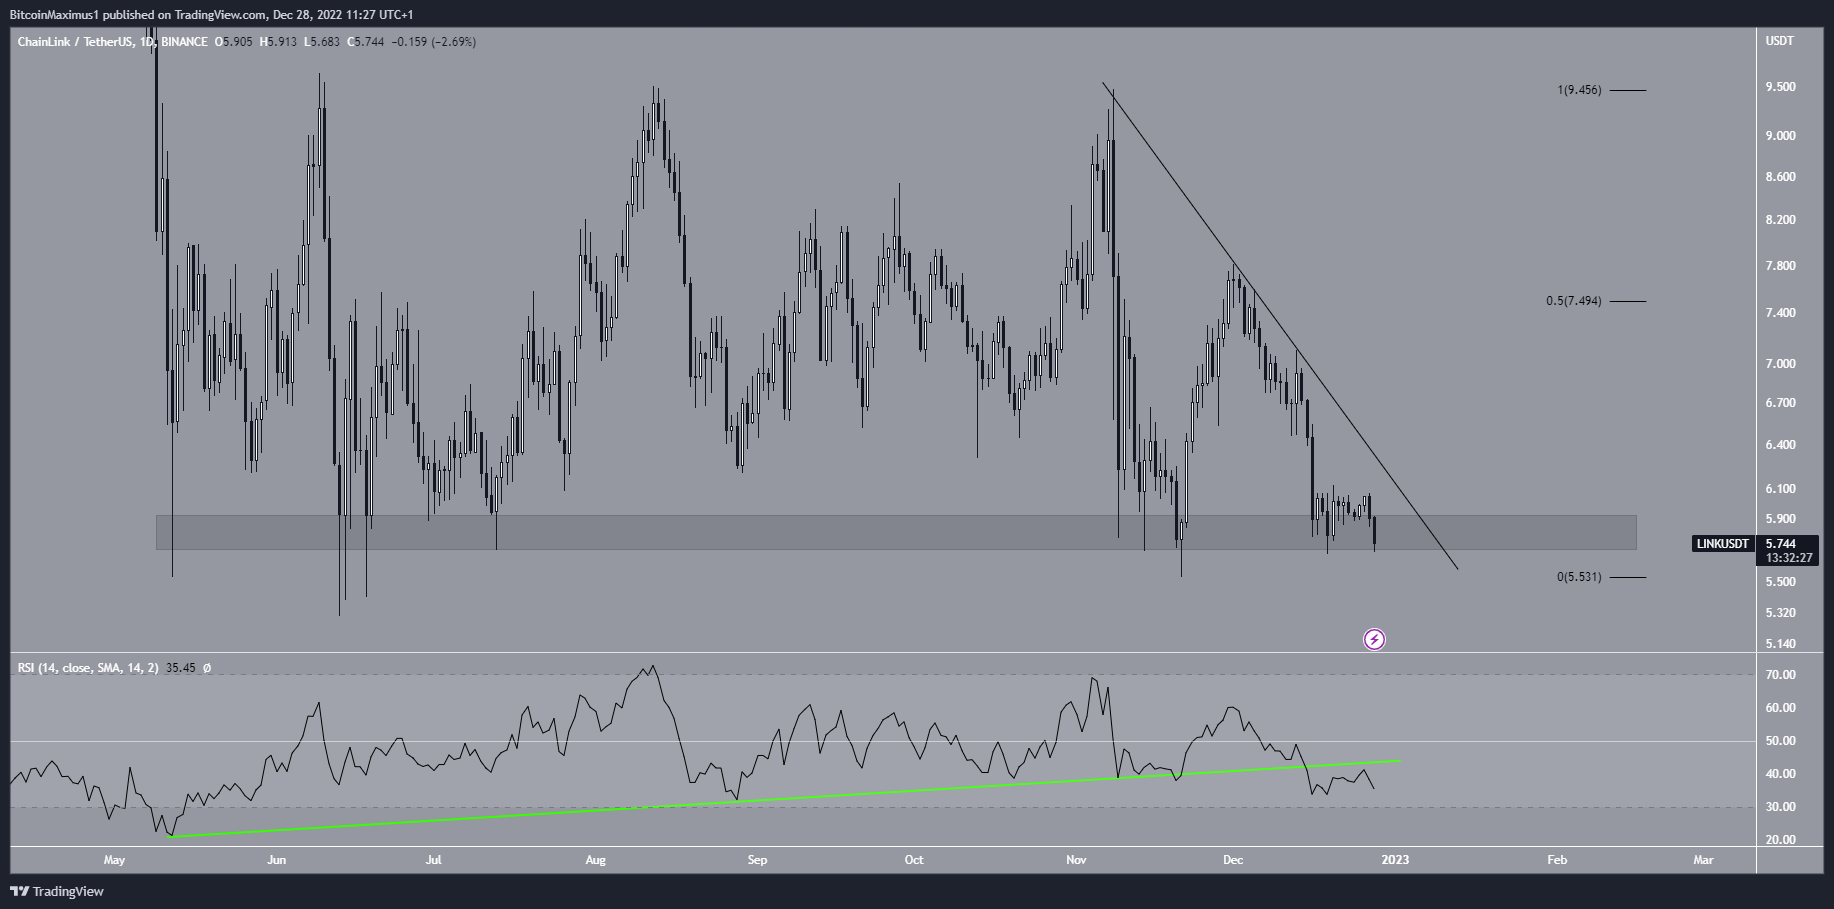
As a result, the daily and weekly time-frames combine to provide a bearish LINK price analysis. A breakdown from the $5.80 support area and a drop toward the $4.30 support is the most likely scenario. A reclaim of the $7.45 resistance area would be required for the Chainlink price forecast to be considered bullish.
For BeInCrypto’s latest crypto market analysis, click here.


