


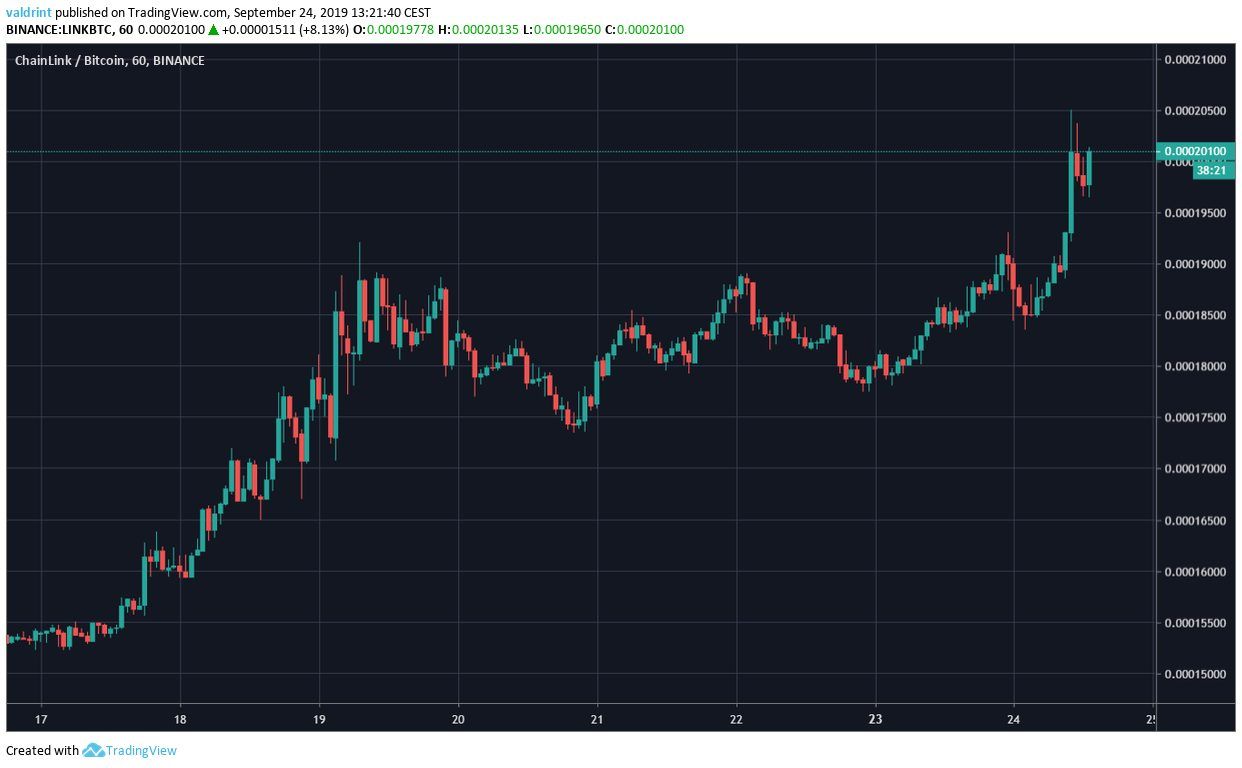
On September 17, the Chainlink price reached a low of 15,221 satoshis. An upward move followed and the LINK price reached a high of 19,204 satoshis on September 19. After trading near this level for five days, LINK broke out on September 24.
Will the Chainlink price continue to increase? Keep reading below in order to find out.
For our previous analysis, click here.
Chainlink Price: Trends and Highlights for September 24
- LINK/BTC is following a descending resistance line.
- There is major support at 15,500 satoshis.
- The price is possibly following a bearish fractal.
- A minor support area is found at 17,500 satoshis.
Descending LINK Price Resistance
Two important observations come from looking at the daily chart:
- The LINK price is following a descending resistance line.
- There is support at 15,500 satoshis.
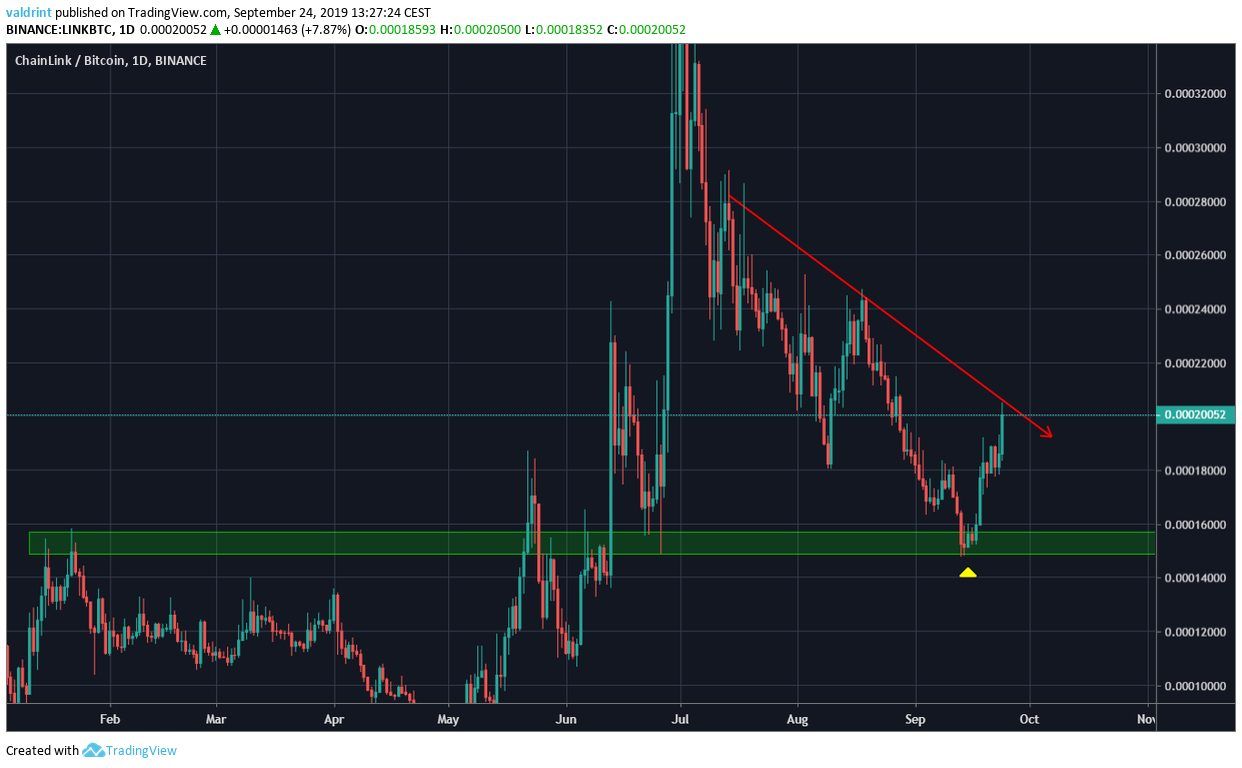
Once the Chainlink price reached the support area on September 22, it began the upward move towards the resistance line.
It is currently right at this line.
Will it break out above?
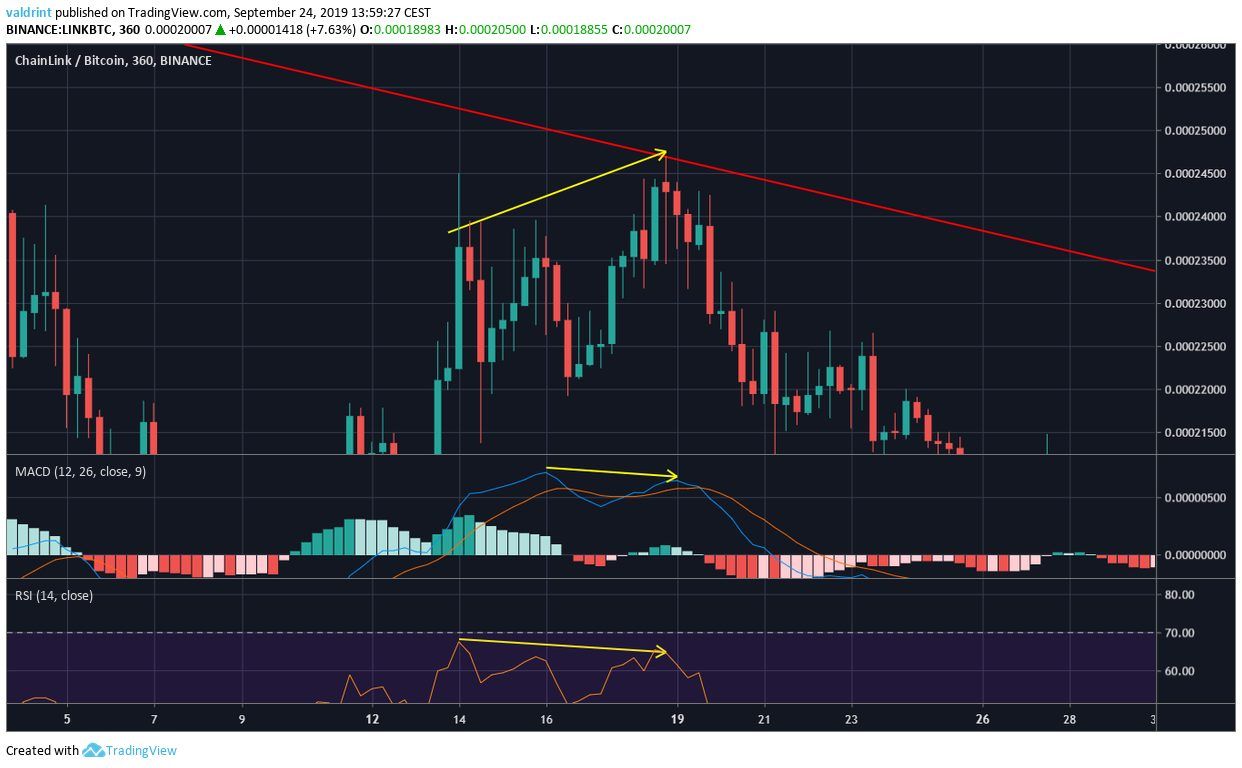
Bearish Divergence
Looking at the RSI & MACD shows us that the current upward move has been losing strength.
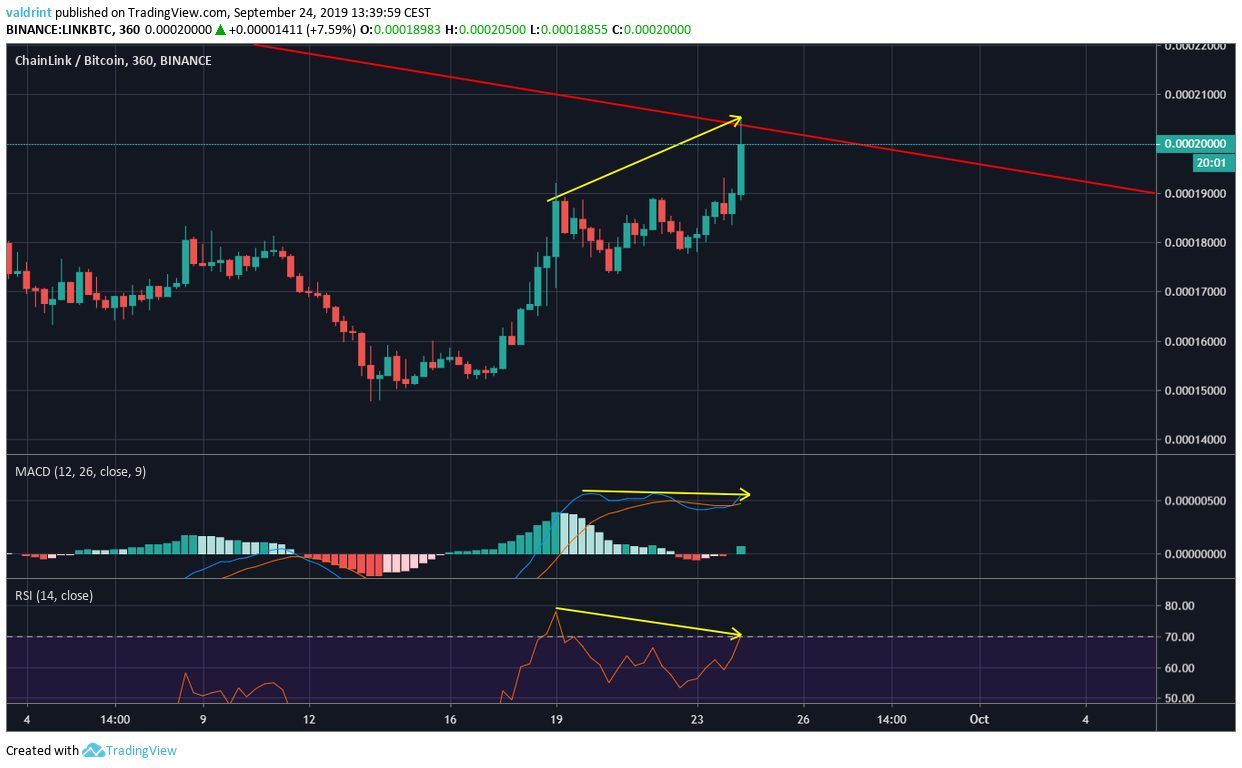
Both indicators have developed bearish divergence, especially visible during the higher highs of September 19 and 24.
A similar occurrence has happened with volume, which is slightly lower than during the increase on September 19.
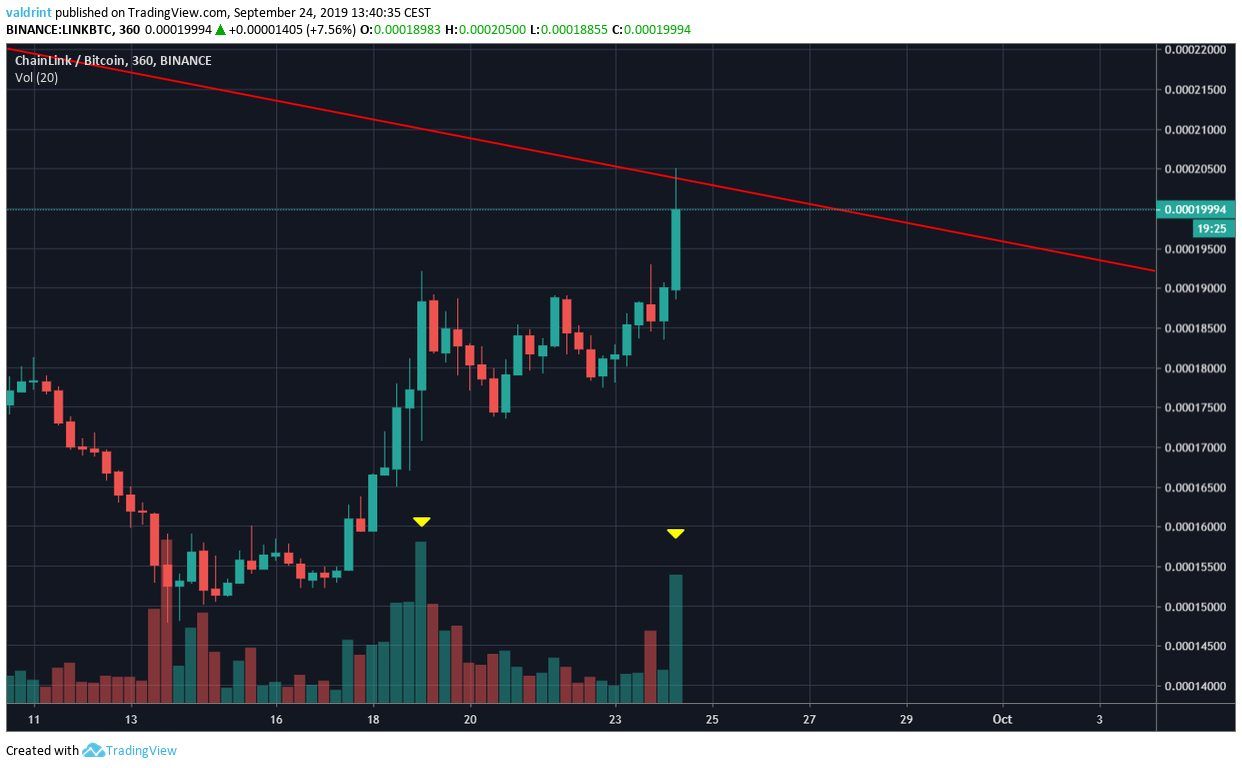
While both of these are bearish signs, the level of divergence and difference in volume is not extremely significant.
Therefore, they are not sufficient in predicting a price decrease.
Similar Movement
Going back to the daily chart, we can see a possible fractal.
The daily moving averages (MA) — more specifically, the 10- and 20-day MAs, made a bullish cross on September 23.
This preceded the increase that took LINK to the resistance line.
Additionally, the MACD is right at the 0 line and trying to cross into positive territory.
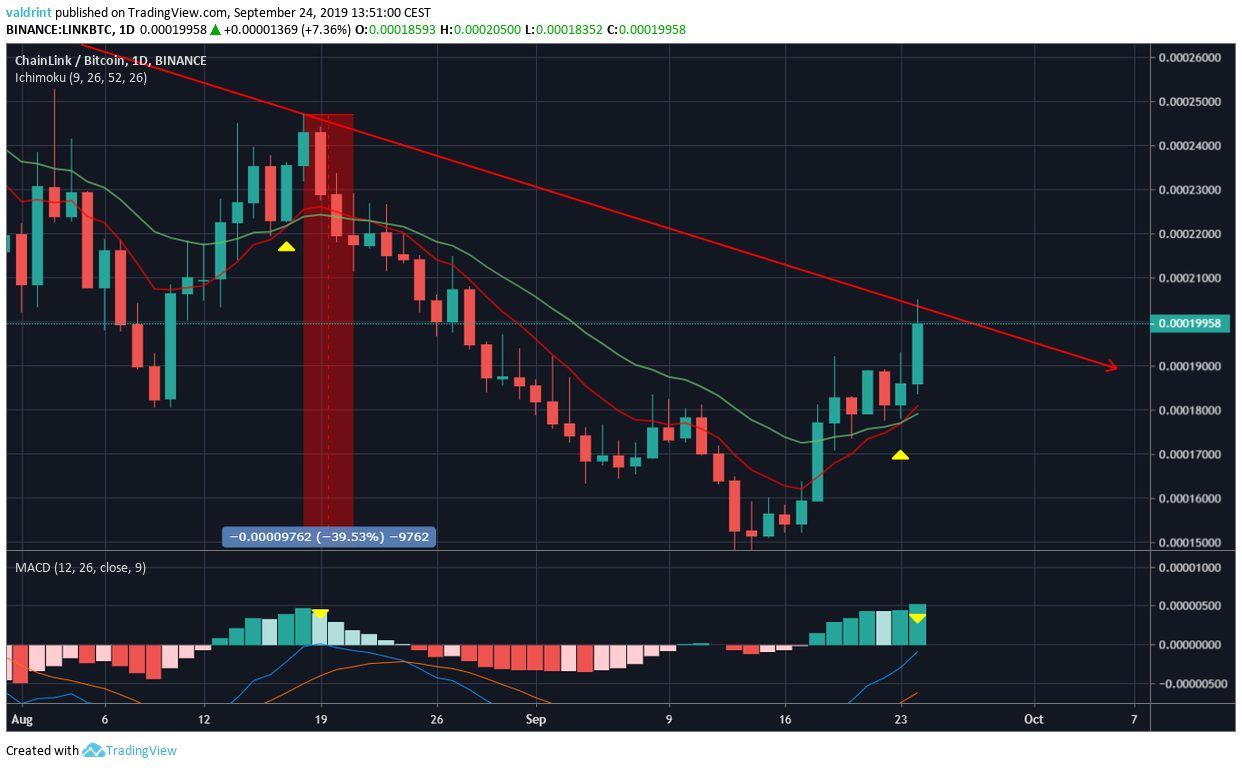
While these are all bullish signs, an identical movement occured in the middle of August.
A bullish cross transpired on August 17 — preceding an upward move to the resistance line.
Additionally, the MACD was struggling to move above the 0 line.
What followed was a gradual decrease lasting a month which wiped out 40 percent of the price.
Furthermore, looking closer at the August move, we can see a very similar divergence in both the RSI & MACD.
This makes us believe that the Chainlink price is likely to act in a similar manner this time and begin a short-term decrease.
However, at the current time, we are not predicting a full 40 percent decrease for the price.
Future Movement
An outline of possible future LINK price movements is given below.
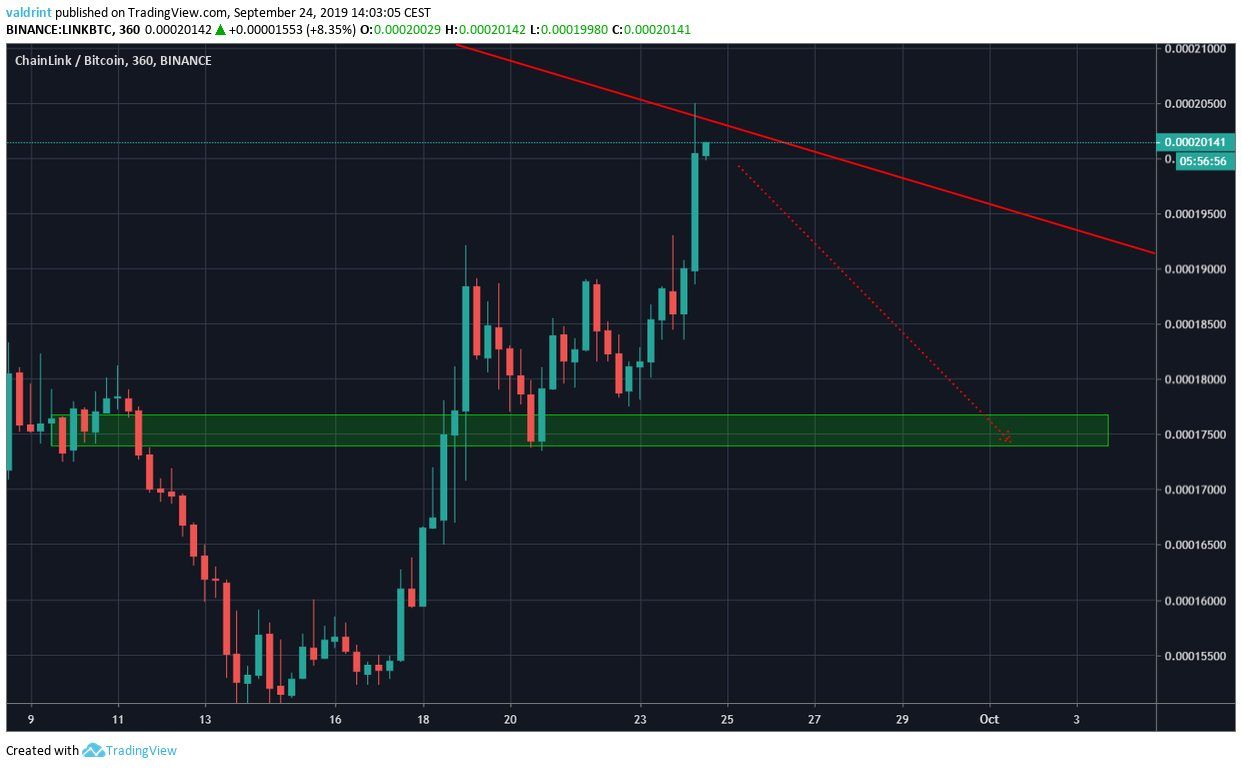
The Chainlink price is likely to undergo a decrease and reach the minor support area at 17,500.
From there, it is possible that it initiates another attempt at breaking out above the descending resistance line.

Chainlink Price Summary
The LINK price is following a descending resistance line.
According to our analysis, the LINK price will not break out above this resistance line.
Rather, it is likely to undergo a short-term decrease.
For trading purposes, even though we believe that LINK will decrease, the possibility of a rapid breakout makes this an unfavorable level for the initiation of a short trade.
Do you think LINK will break down from the triangle? Let us know in the comments below.
Disclaimer: This article is not trading advice and should not be construed as such. Always consult a trained financial professional before investing in cryptocurrencies, as the market is particularly volatile.
Images are courtesy of Shutterstock, TradingView.


