

The Chainlink (LINK) price soared to an all-time high of $27.02 on Feb. 5, 2021, before decreasing slightly.
Up to this point, Chainlink has gone through four major market cycles. Unlike the majority of other altcoins, LINK has been moving mostly upwards.
In this article, BeInCrypto takes a look at these previous cycles and see how they compare to the current upward movement.
First Chainlink Market Cycle
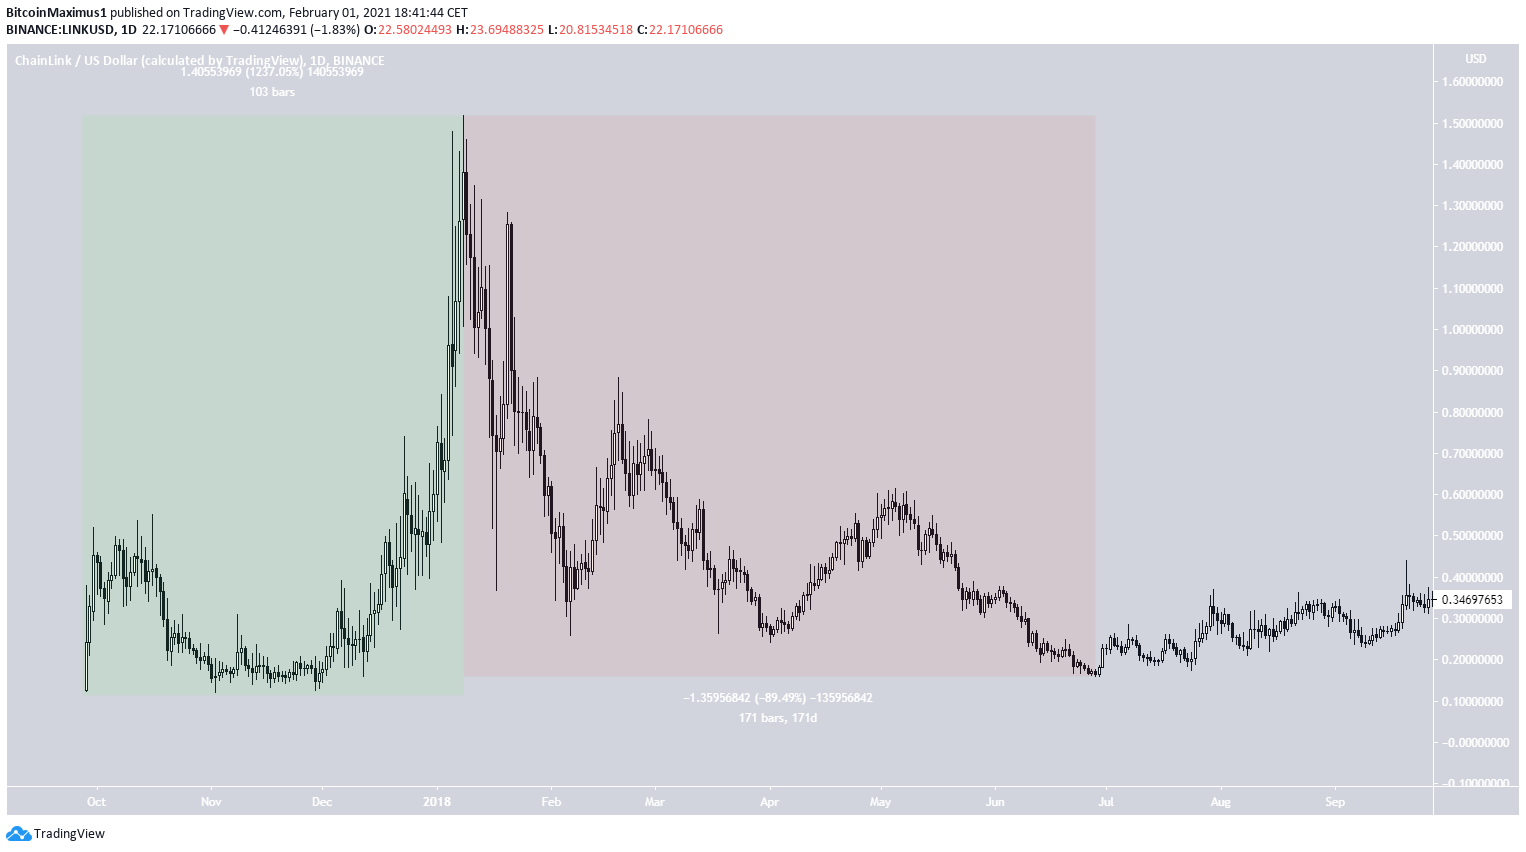
The first market cycle for LINK transpired between September 2017 and June 2018.
The cycle began with a low of $0.12 on Sept. 28, 2017. An increase of 1,237% in a span of 103 days followed this low, creating the first all-time high price of $1.51, which stood until June 2019.
After the high was reached, LINK corrected over the next 171 days, settling with a low of $0.159 on June 28, 2018.
After this, LINK began its second market cycle. The $0.159 low has not been revisited since.
Second Market Cycle
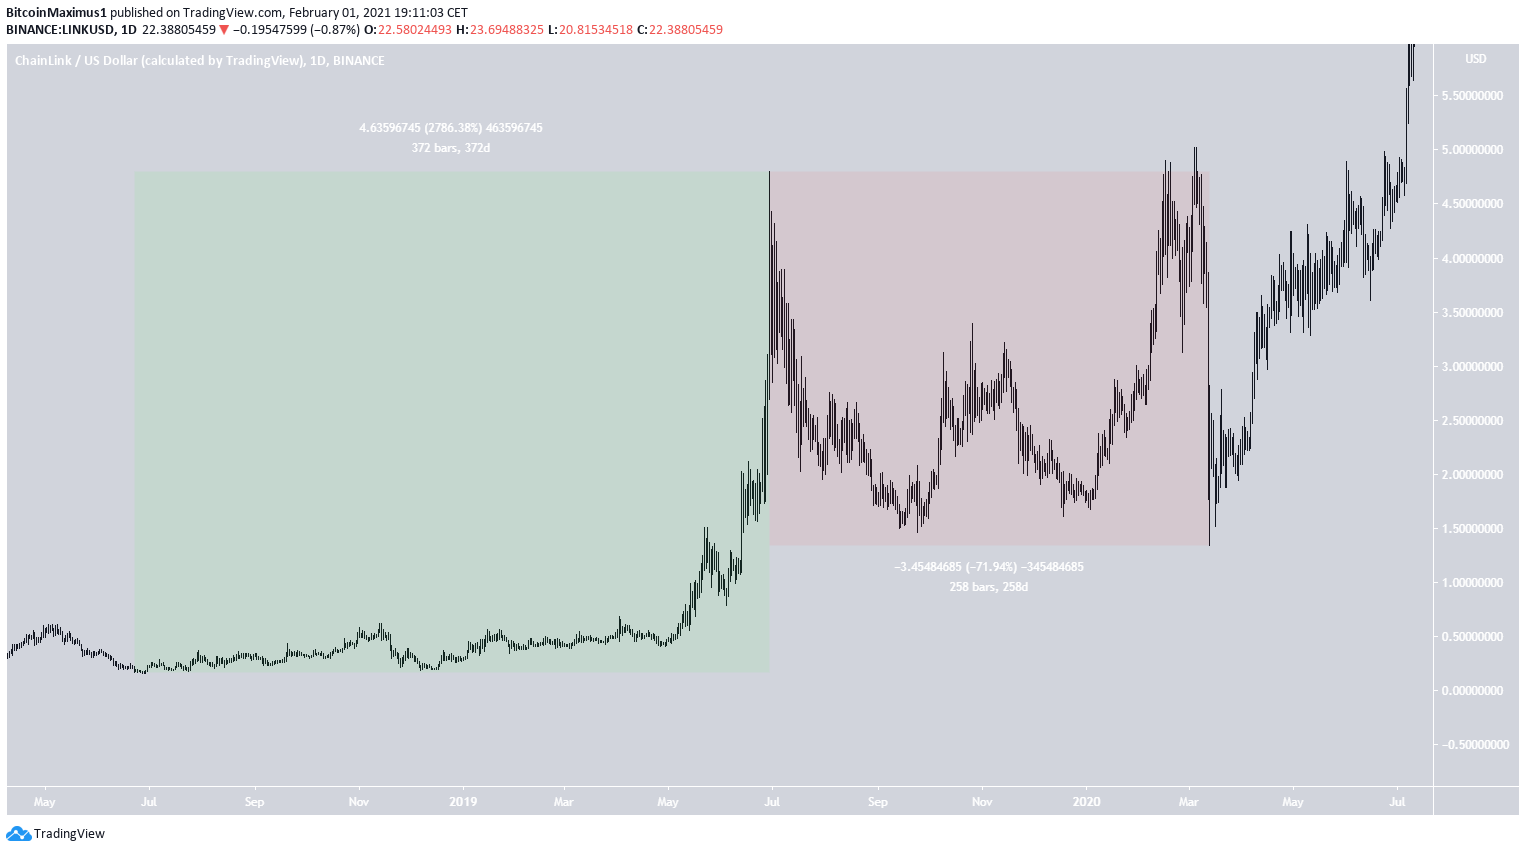
The second market cycle transpired between June 2018 and March 2020. This cycle saw a much higher rate of increase than the first.
In a span of 372 days, LINK increased by 2,786%, culminating with a high of $4.80 on June 29, 2019. After moving above the original all-time high price of $1.51, LINK continued increasing at an accelerated rate until it reached $4.80.
Following this, LINK corrected for the next 258 days, decreasing by 72%.
While LINK technically reached a slightly higher high in March, due to it being a part of a flat correction, we are considering it as part of the corrective structure.
Third Market Cycle
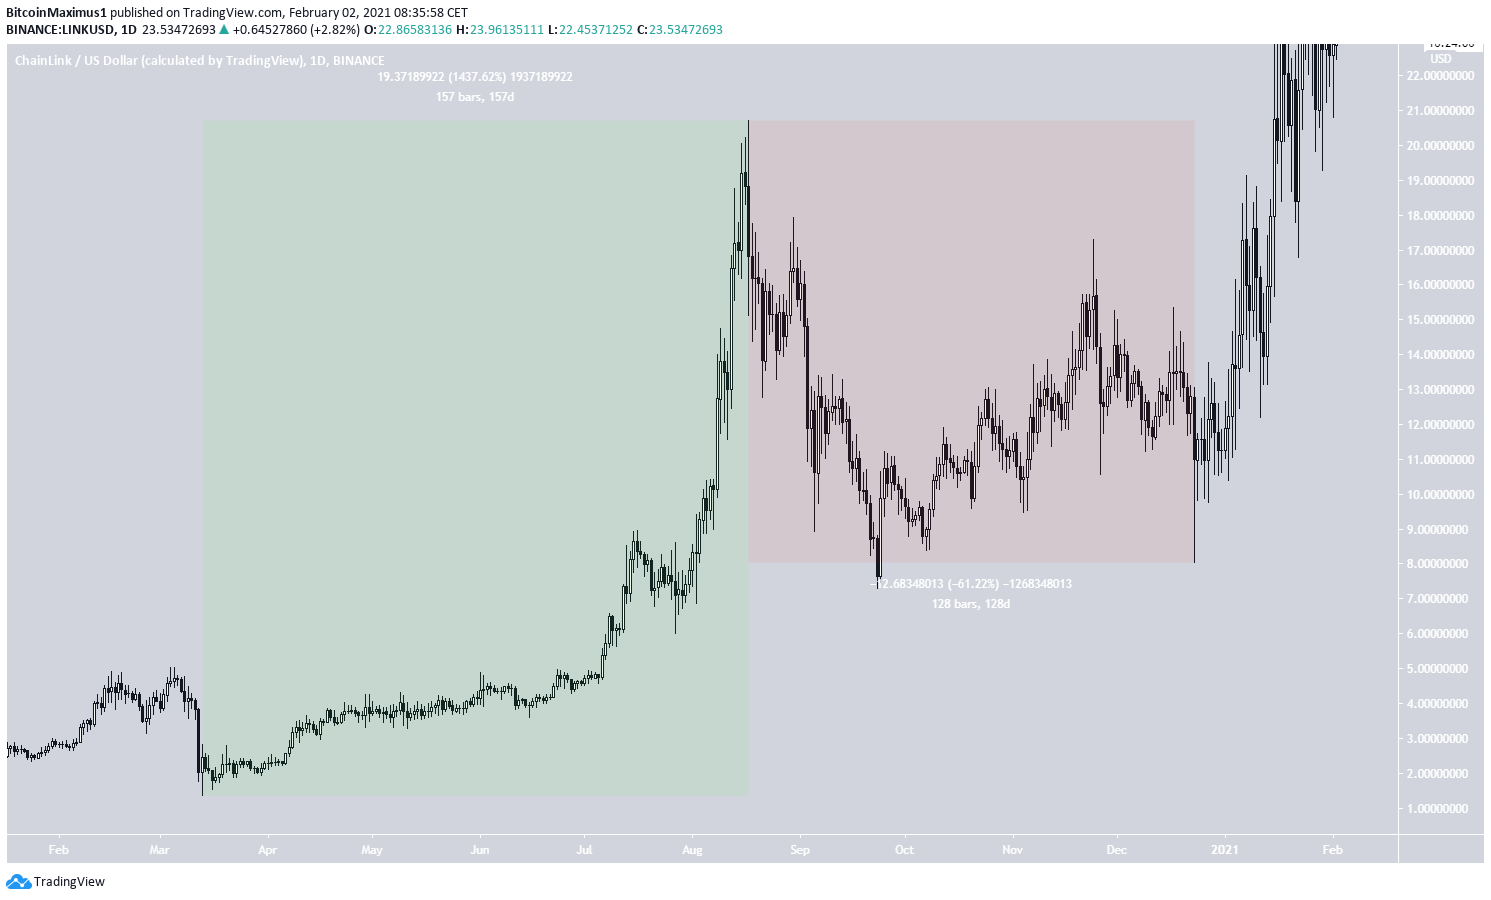
The third market cycle began with the March 13, 2020 low of $1.34, and continued until a high of $20.71 was reached on Aug. 17, 2020. The rate of increase of roughly 1% per day was in line with that from the previous two market cycles.
After the August high was reached, LINK corrected by 61% over the next 128 days. Similar to the second cycle, LINK actually reached a slightly lower low earlier, but the final low of $8.03 is still part of the correction.
Since then, LINK has been moving upwards. A new all-time high price of $27.02 was reached on Feb. 5, 2021.
Current LINK Movement
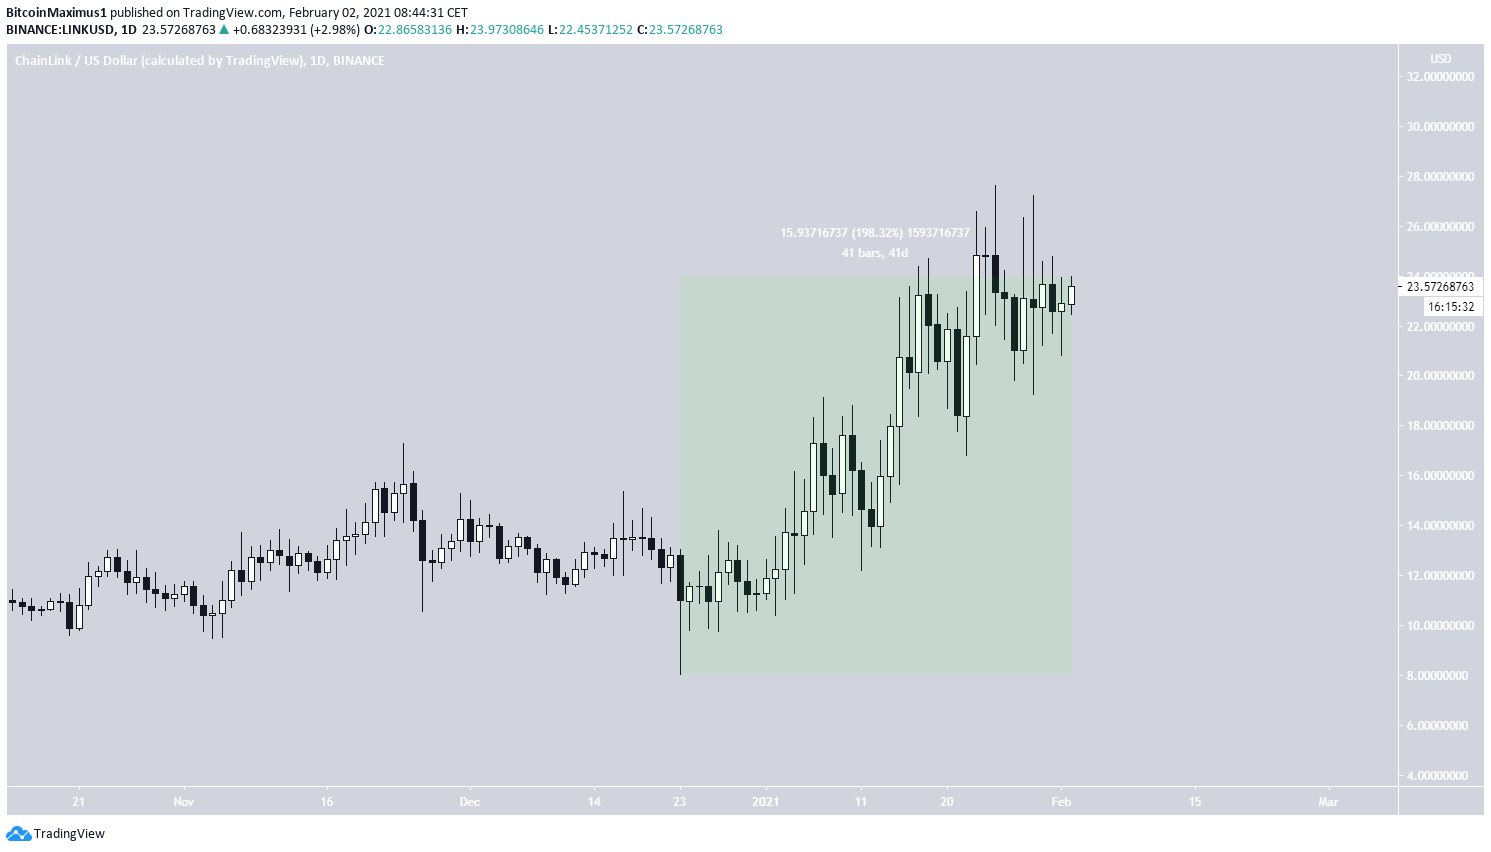
The current Chainlink market cycle has had the highest rate of increase so far. LINK has increased by 198% in only 41 days, for a daily rate of increase of 5%.
If LINK continues with the same rate of increase, the current cycle will be the steepest yet, likely leading to a parabolic upward move in the future.
Disclaimer
In line with the Trust Project guidelines, this price analysis article is for informational purposes only and should not be considered financial or investment advice. BeInCrypto is committed to accurate, unbiased reporting, but market conditions are subject to change without notice. Always conduct your own research and consult with a professional before making any financial decisions. Please note that our Terms and Conditions, Privacy Policy, and Disclaimers have been updated.
