


On July 6, the Chainlink (LINK) price broke out from the $4.9 resistance area that had been in place since July 2019. Since then, the price has increased by almost 70%.
All-Time High
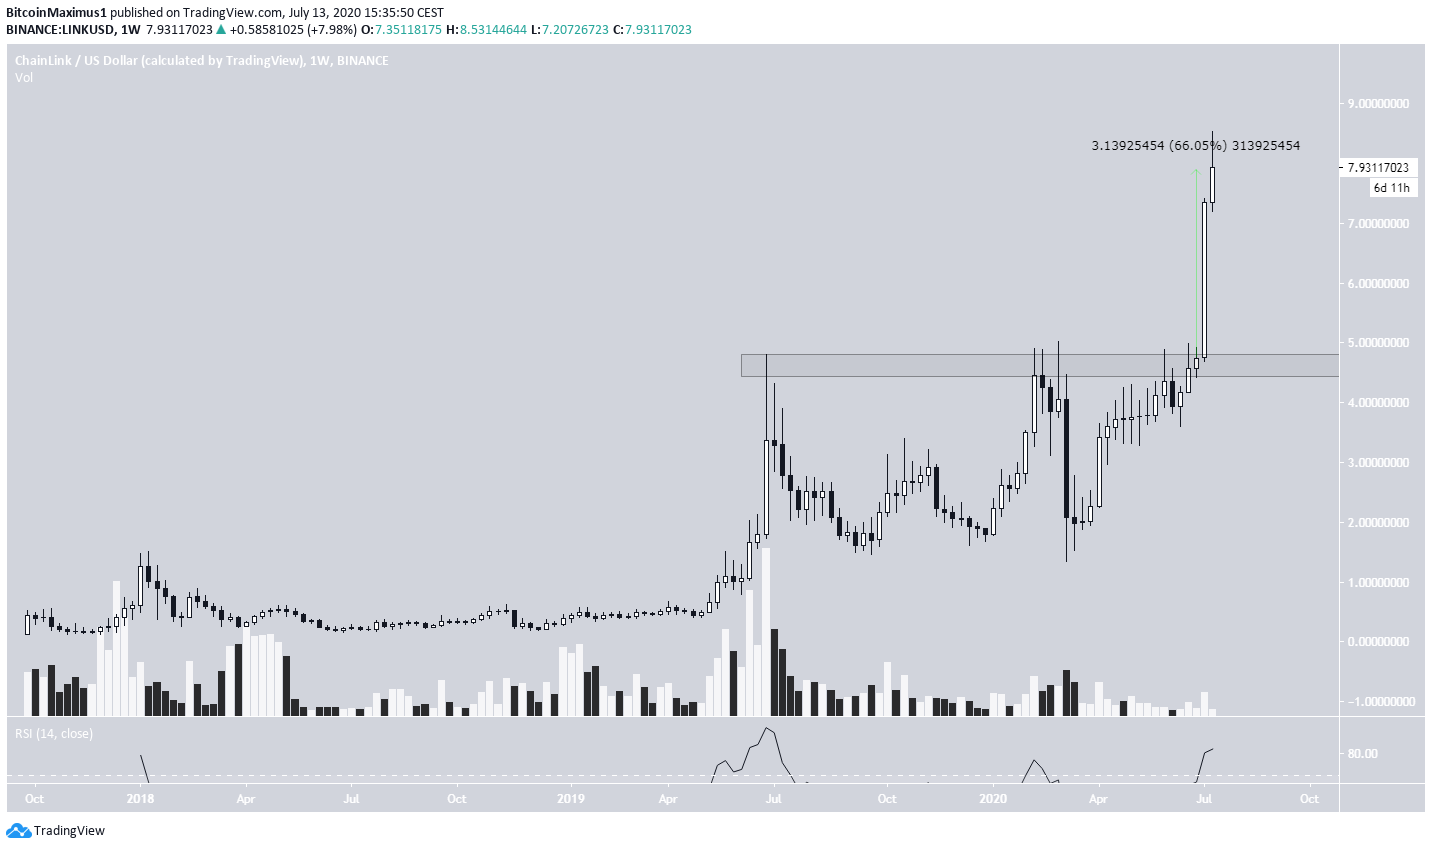
A look at the weekly chart shows that LINK has been on an upward trend since its inception. The price reached a high of $4.94 in July 2019 and then dropped sharply. Since then, it has made several attempts at moving above this area, but they’ve all been unsuccessful.
Finally, on July 6, the price successfully broke out and created a massive bullish belt hold candlestick on the weekly time-frame. Since then, the price has increased by 66%.
However, volume has been quite weak, and the RSI is deep in overbought territory. While the bearish divergence is yet to be confirmed, it is developing and will likely be confirmed at the weekly close.
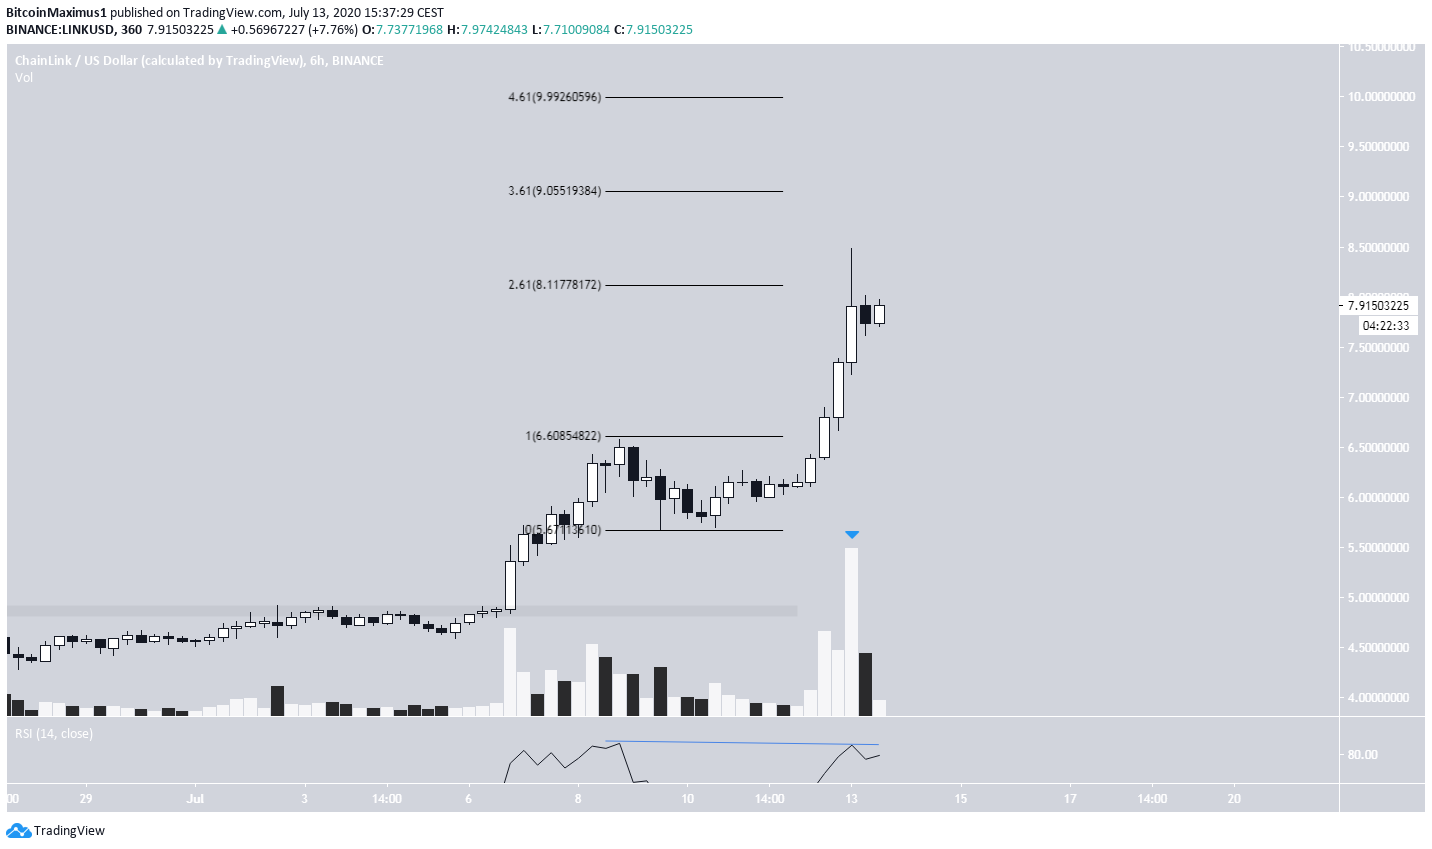
The short-term chart shows bearish divergence on the RSI. However, volume was also the highest during the most recent bullish candlestick, allowing the price to extend its gains.
Since the price is at an all-time high, we need to use Fibonacci levels in order to determine the next resistance areas for the price. By doing that at its most recent decline, we can see that the price has already reached the first resistance level at $8.11 and was rejected.
If successful in breaking out, the next resistance levels are found at $9.05 and $10, respectively.
Wave Count
Cryptocurrency trader @TheEWguy outlined a LINK chart stating that the price is likely to increase all the way to $7.5. To arrive at that prediction, he outlined a five-wave Elliott formation, in which the fifth and final wave is expected to end at the given target.
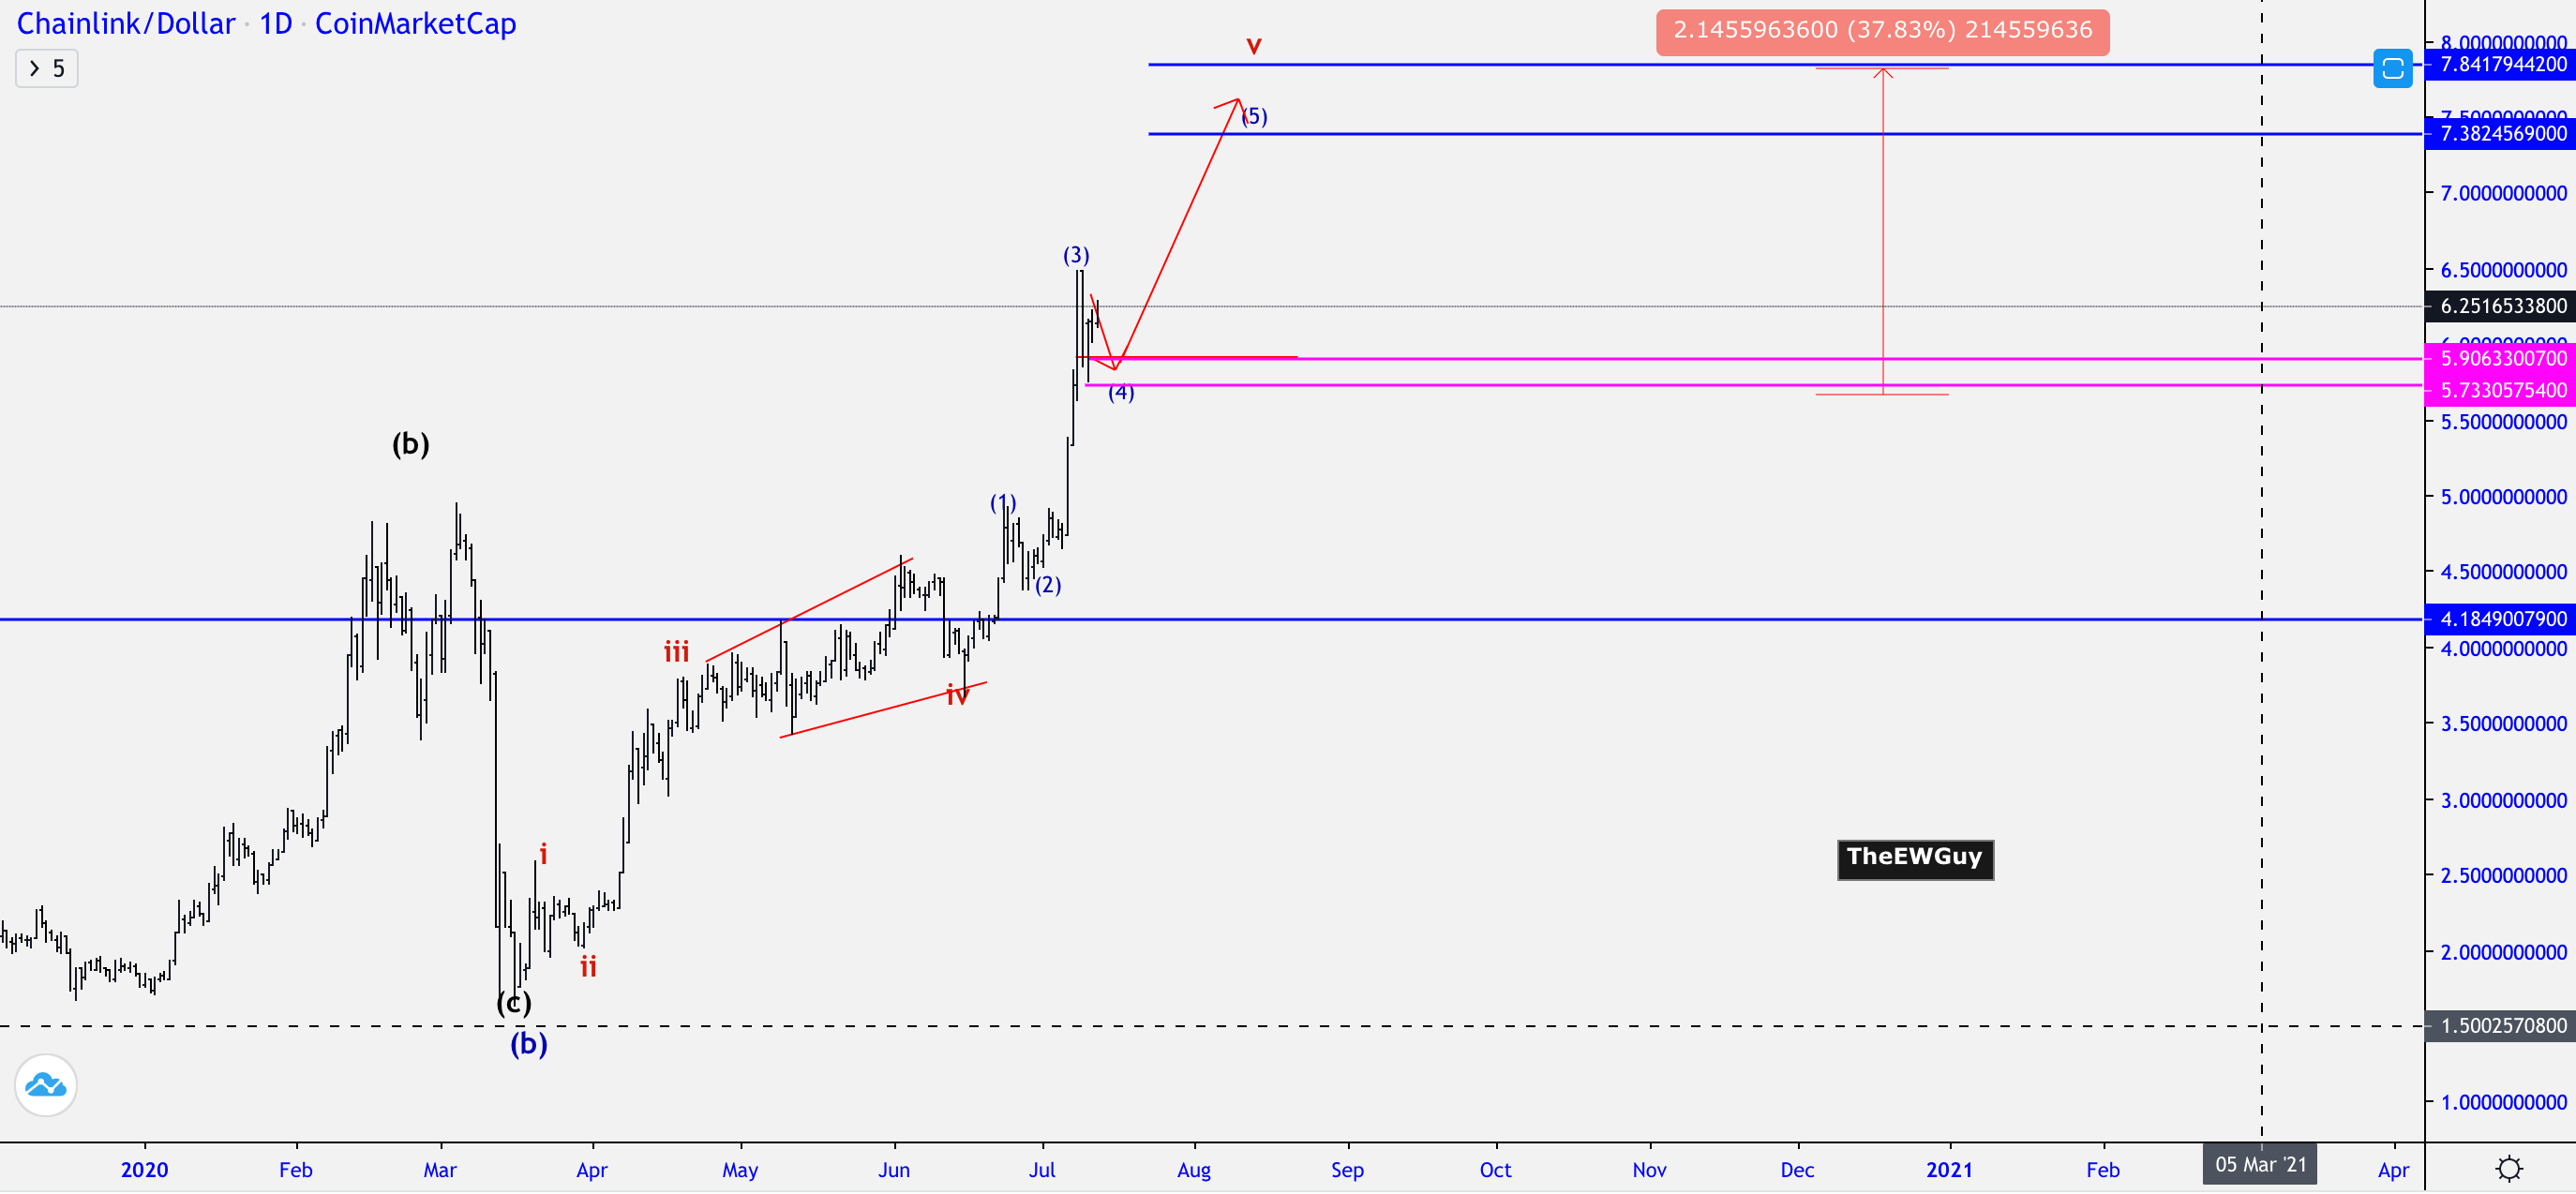
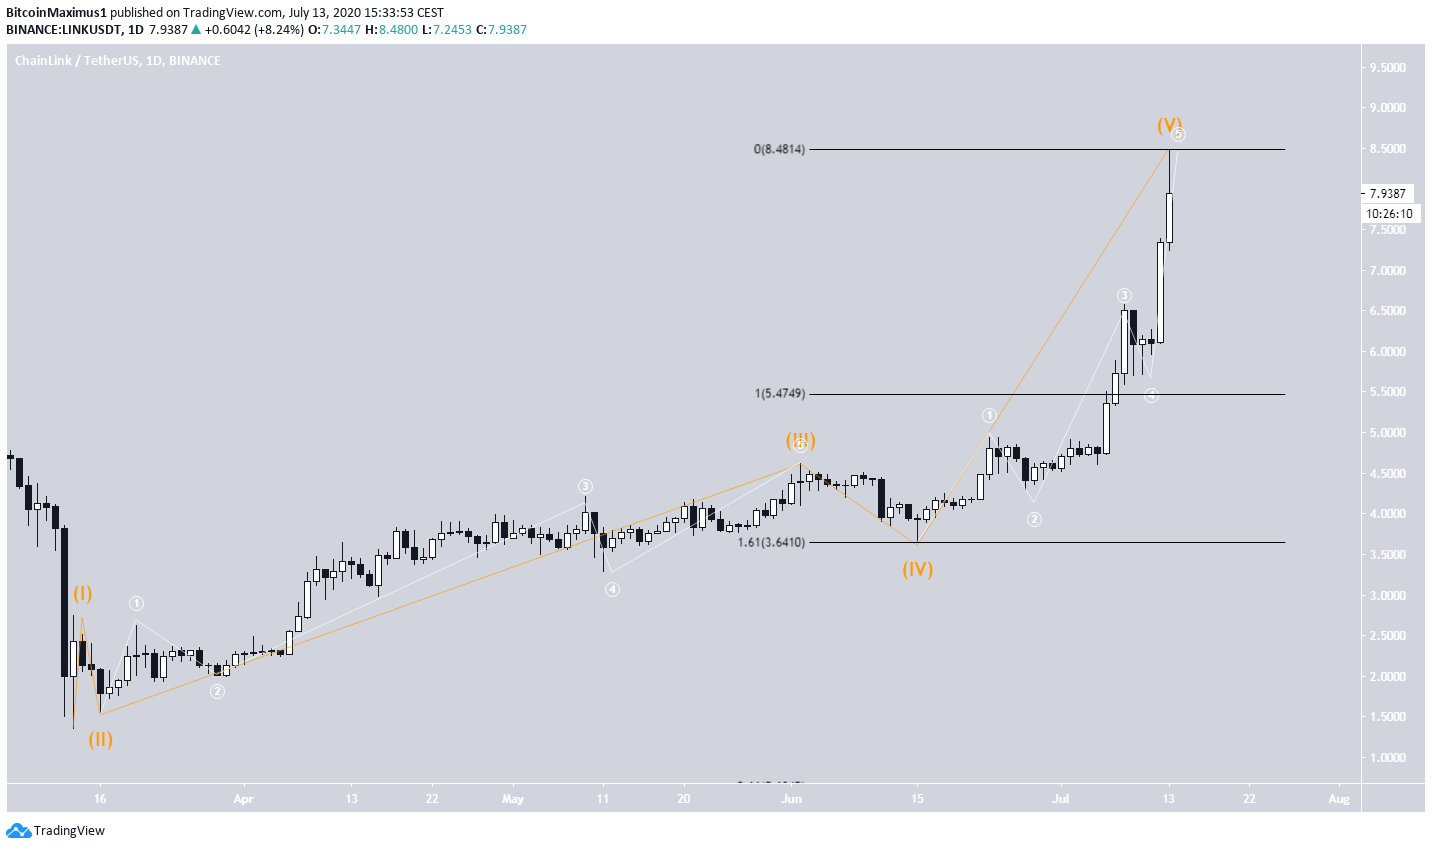
Since March 13, it seems that LINK is in the process of completing this five-wave Elliott formation, currently playing out its fifth wave.
Both waves three and five are extended, a relatively uncommon but not unheard of characteristic. However, the fifth wave has already extended 1.61 of the height of wave 3, which is a common ending point for an extended wave 5.
Therefore, it’s possible that the price has reached a top and will soon begin a corrective period.
To conclude, the LINK price is nearing or has already reached the end of its final upward wave. While it is possible that the price makes another run towards $10, a corrective period is likely to begin soon.


