
On August 4, the ChainLink (LINK) price reached a new all-time high price of $$9.75.
While the upward move still looks strong in the long-term, there are numerous signs of short-term weakness present.
LINK Blasts Off to New All-Time High
The LINK price has been on a long-term upward trend since January 2019. The price initially struggled to break out from the $4 level, getting rejected twice in June 2019 and February 2020. However, it was finally successful in breaking out in July and has increased at an accelerated rate since, measuring a full 107% in only 28 days. While volume has been decreasing throughout the upward move—a sign of weakness—both the MACD and RSI are still moving up, even though the latter is overbought. The lack of bearish divergence on the weekly time-frame is also a sign that the price could continue moving upwards.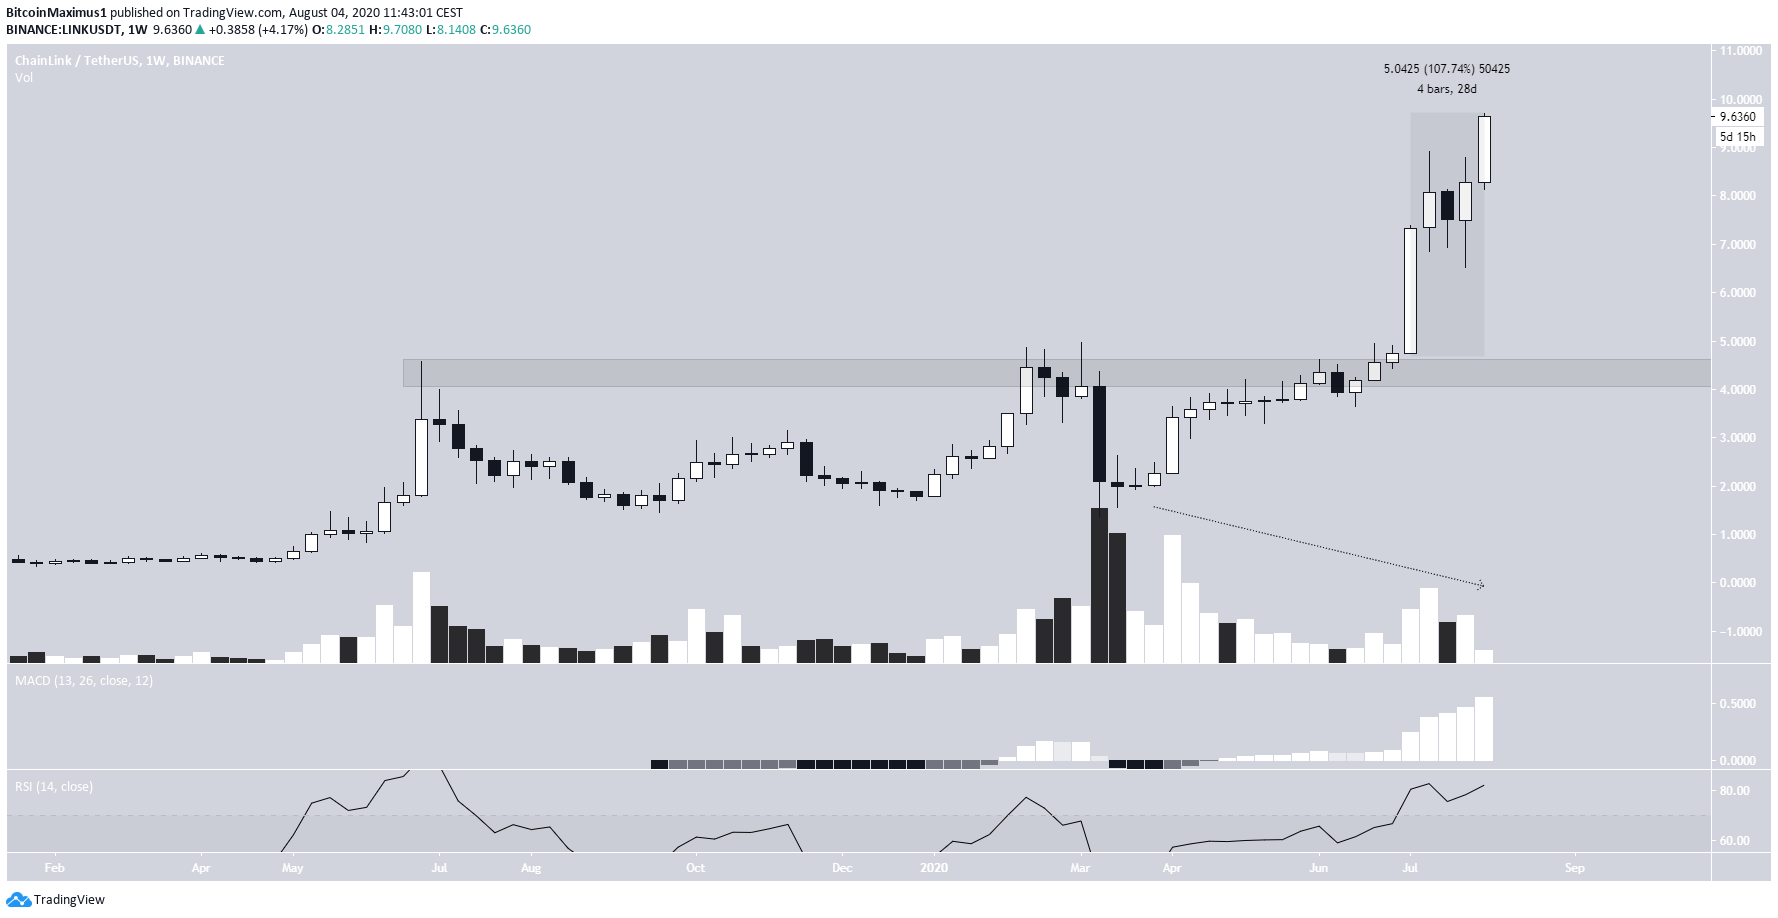
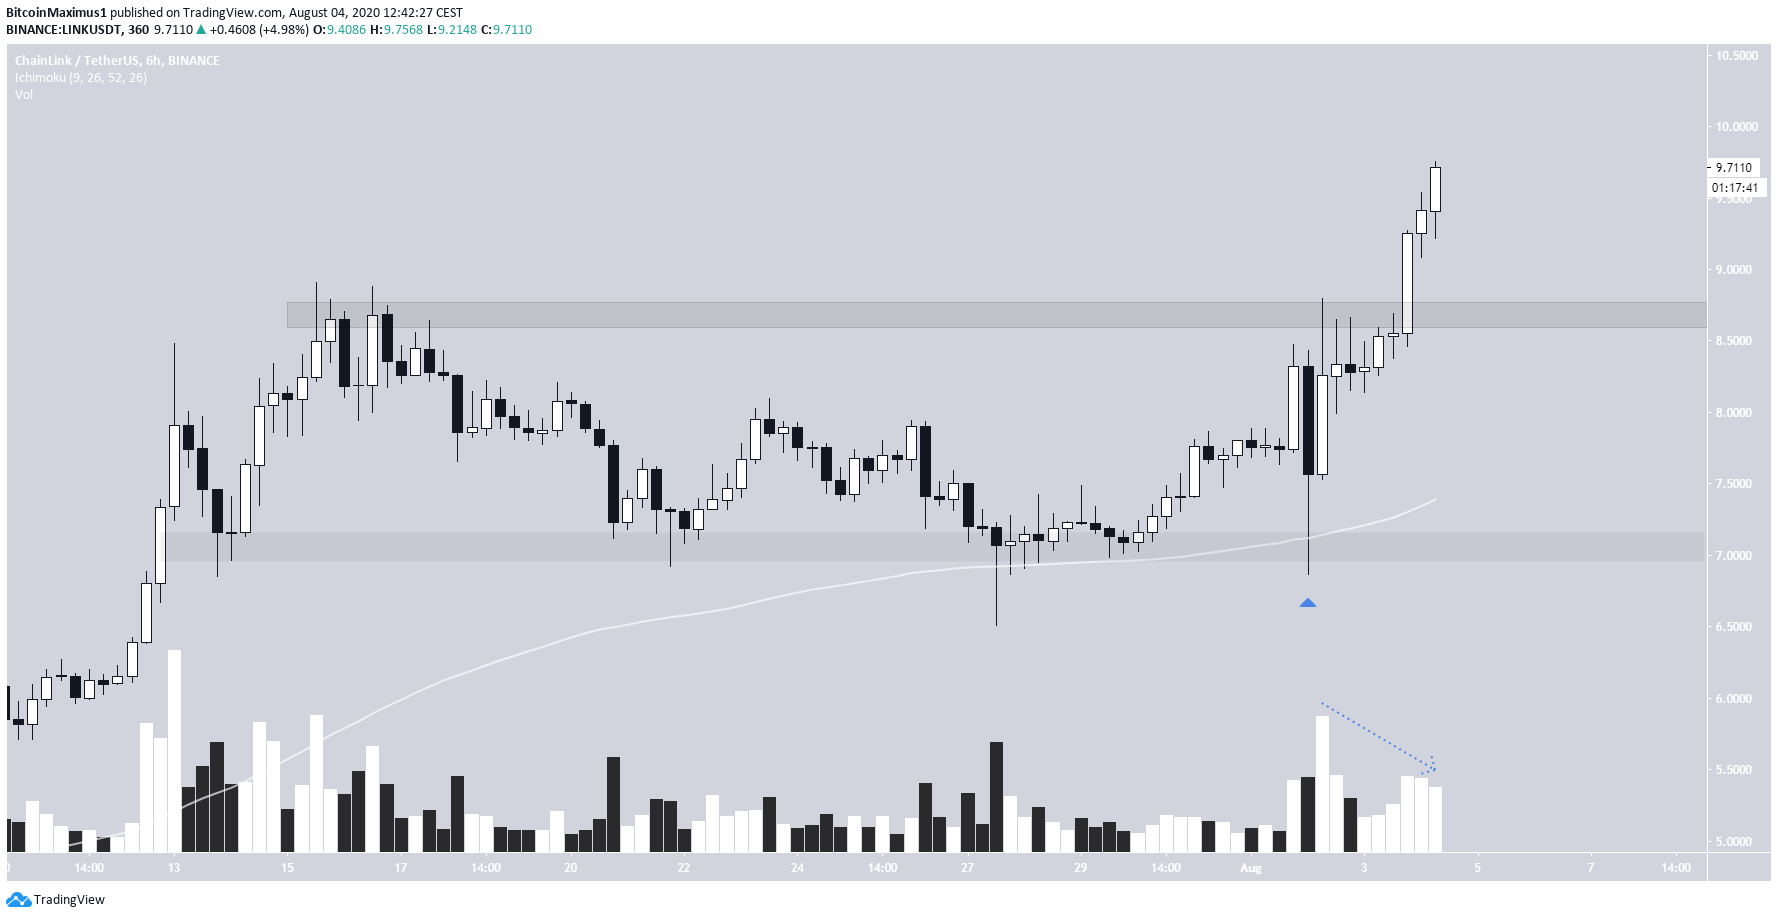
Short-Term Indicators Show Trouble
The daily chart shows the first signs of weakness in the form of two bearish Doji candles on July 13 and August 2. Even though the price has cleared the highs of these Doji’s, they were both created with above-average volume. In addition, both the RSI and the MACD have generated considerable bearish divergence, a sign that a trend reversal is likely near.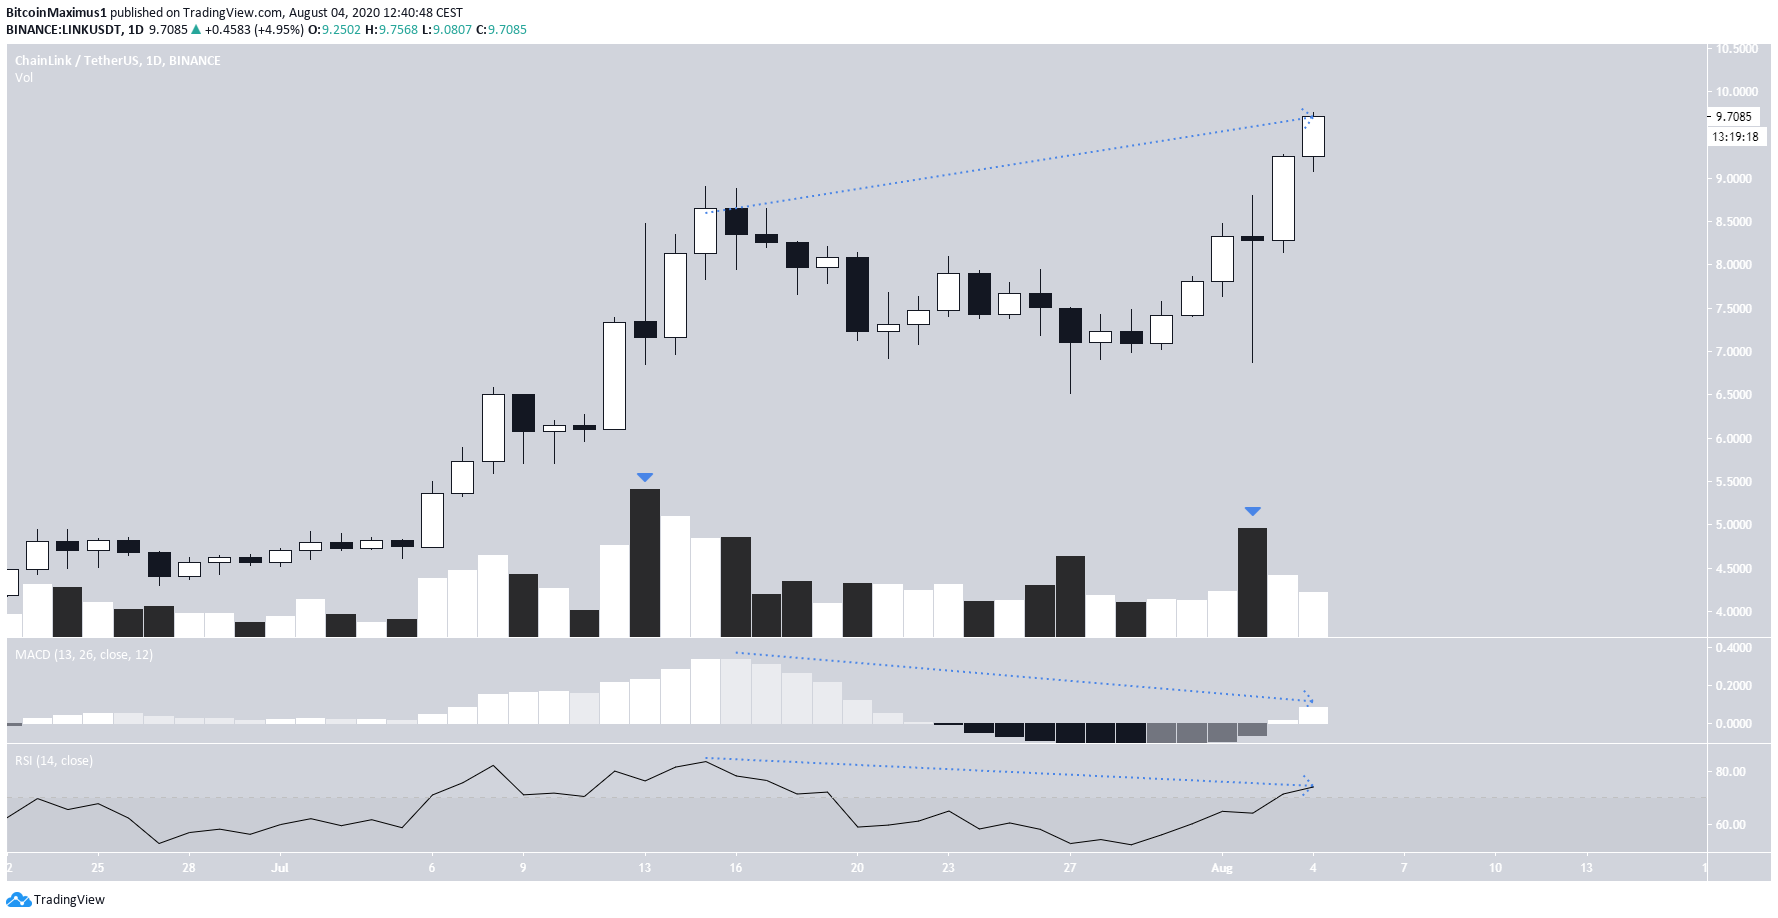
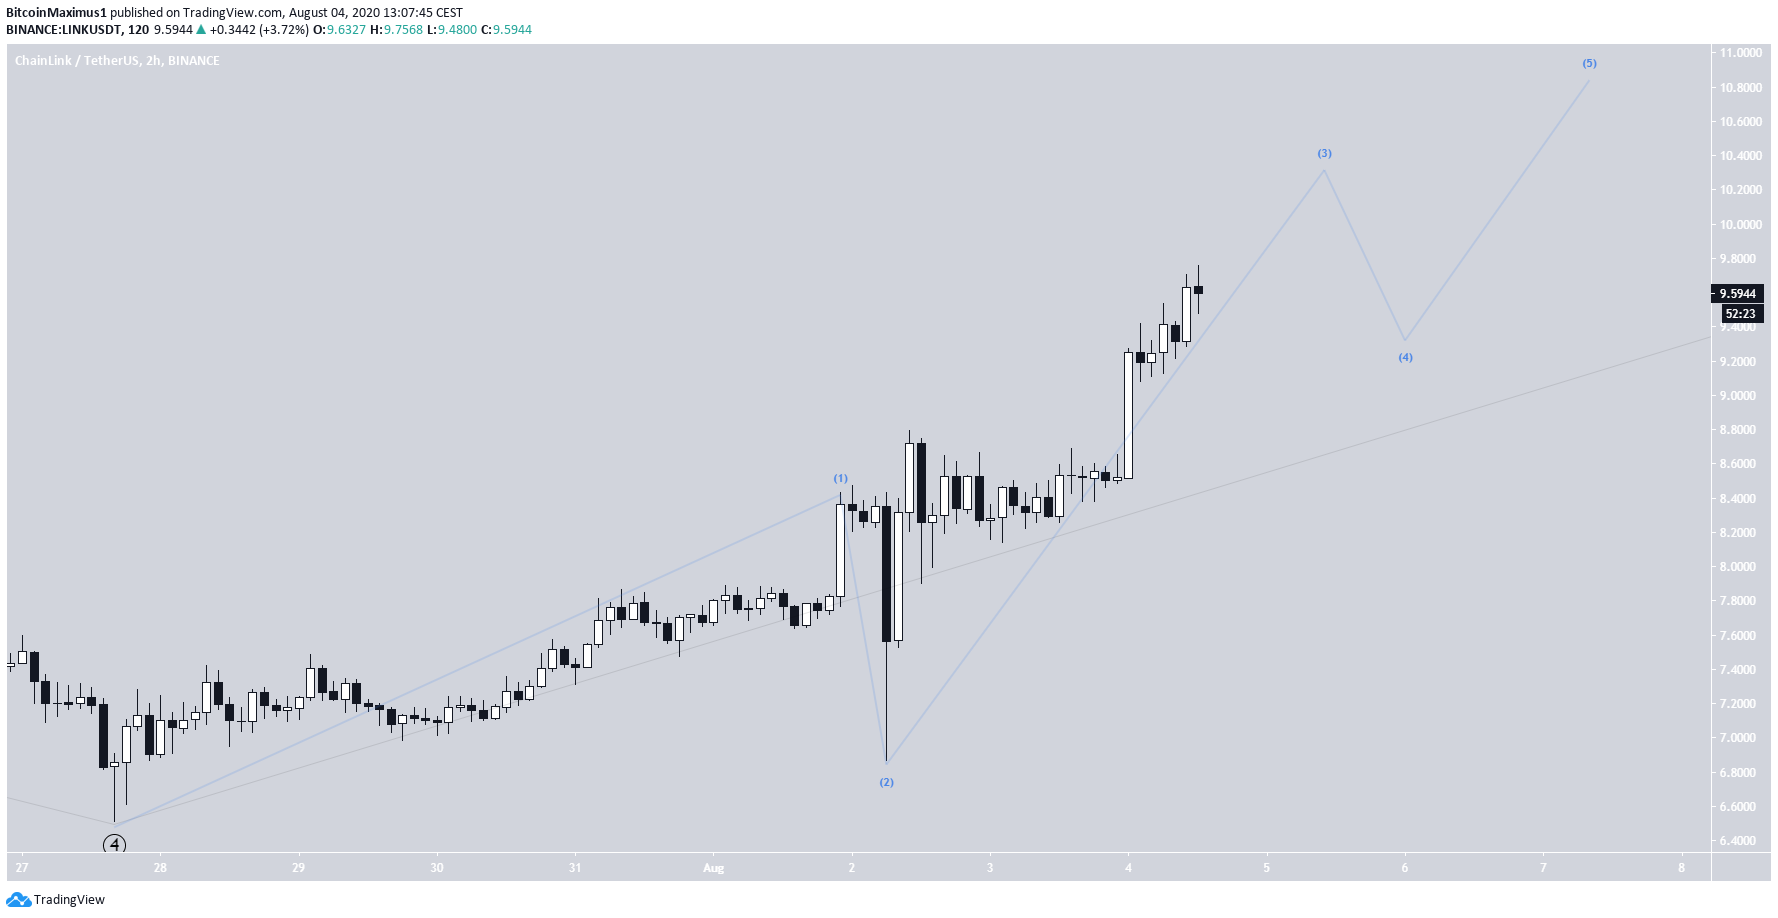
Wave Count
The most likely wave count for the LINK movement is that it’s currently in the fifth and final wave (orange) of an Elliott formation that began in early March. The price is currently in the fifth sub-wave (black). If the entire fifth wave is 2.2 times longer than waves 1-4 combined (common Fib extension level), the price could increase all the way to $10.80.
Top crypto platforms in the US
Disclaimer
In line with the Trust Project guidelines, this price analysis article is for informational purposes only and should not be considered financial or investment advice. BeInCrypto is committed to accurate, unbiased reporting, but market conditions are subject to change without notice. Always conduct your own research and consult with a professional before making any financial decisions. Please note that our Terms and Conditions, Privacy Policy, and Disclaimers have been updated.

Valdrin Tahiri
Valdrin discovered cryptocurrencies while he was getting his MSc in Financial Markets from the Barcelona School of Economics. Shortly after graduating, he began writing for several different cryptocurrency related websites as a freelancer before eventually taking on the role of BeInCrypto's Senior Analyst.
(I do not have a discord and will not contact you first there. Beware of scammers)
READ FULL BIO
Sponsored
Sponsored