


While the Chainlink (LINK)price is trading in a bearish pattern, long- and short-term indicators show bullish signs.
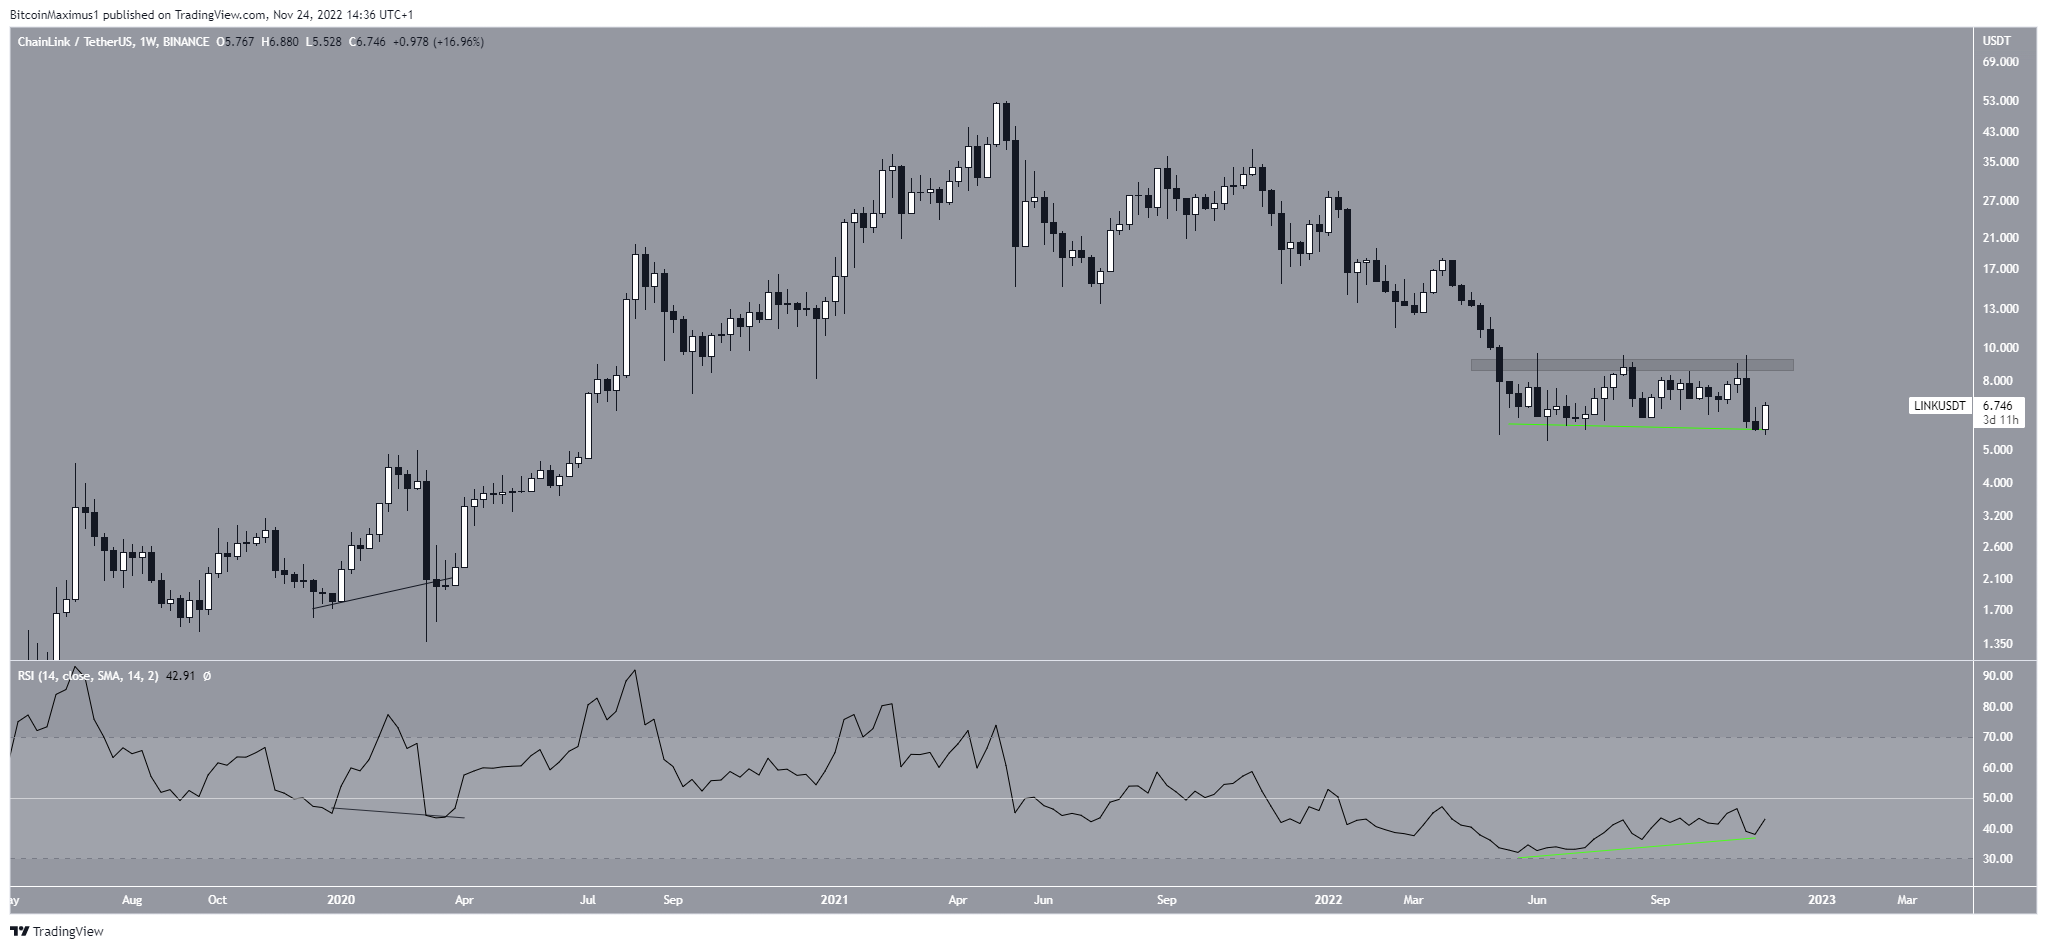
The Chainlink price has fallen since reaching a maximum price of $53 in May 2021. The downward movement led to a low of $5.30 in June 2022.
While the price action has been neutral since then, the weekly RSI has given an extremely bullish sign. The indicator generated bullish divergence (green line) for the first time in history. While there has been a hidden bullish divergence (black) prior, there has never been a regular bullish divergence in the weekly RSI in the Chainlink price history.
This bodes well for the future price and could lead to an upward movement toward the $9 resistance area. If that is broken, the rate of increase could accelerate further.
Chainlink Price Prediction: Will Channel Lead to Breakdown?
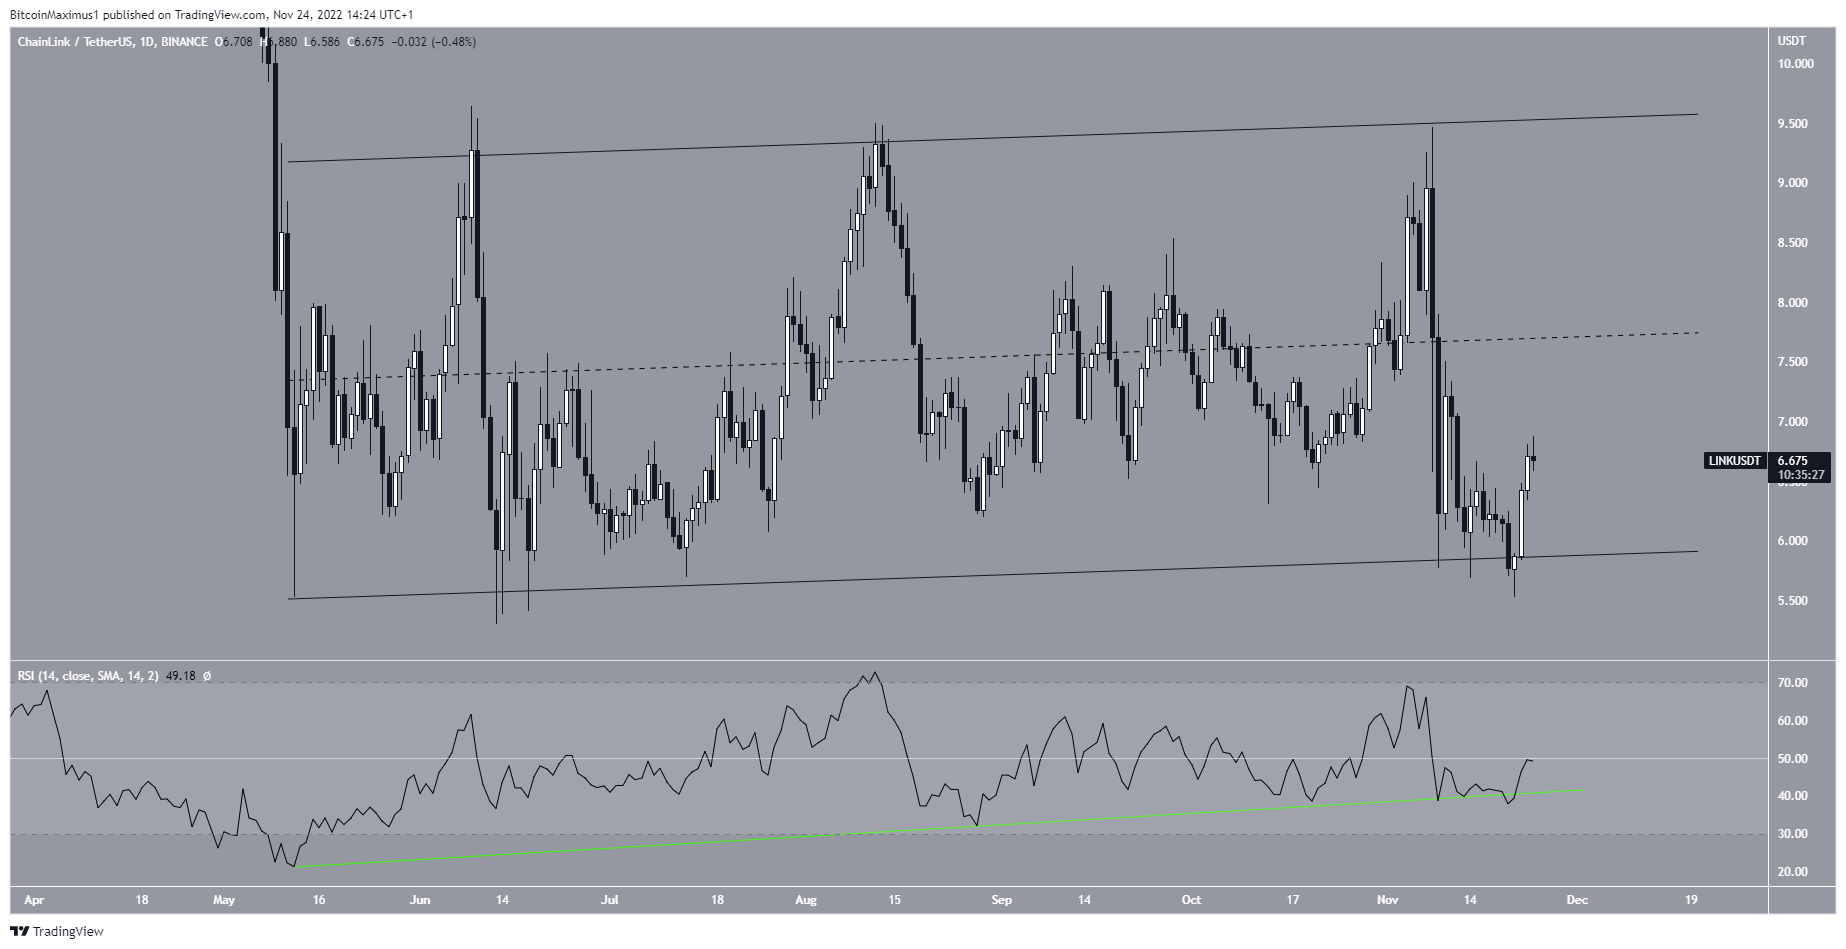
The daily price movement shows that the LINK price has been trading inside an ascending parallel channel since the beginning of May. Such channels usually contain corrective movements.
This means that a breakdown from it would be the most likely scenario. The fact that the Chainlink price is trading in the lower portion of this channel supports this possibility.
However, the daily RSI casts some doubt in the bearish price forecast. This is because the bullish divergence trend line in place since May (green line) is still intact.
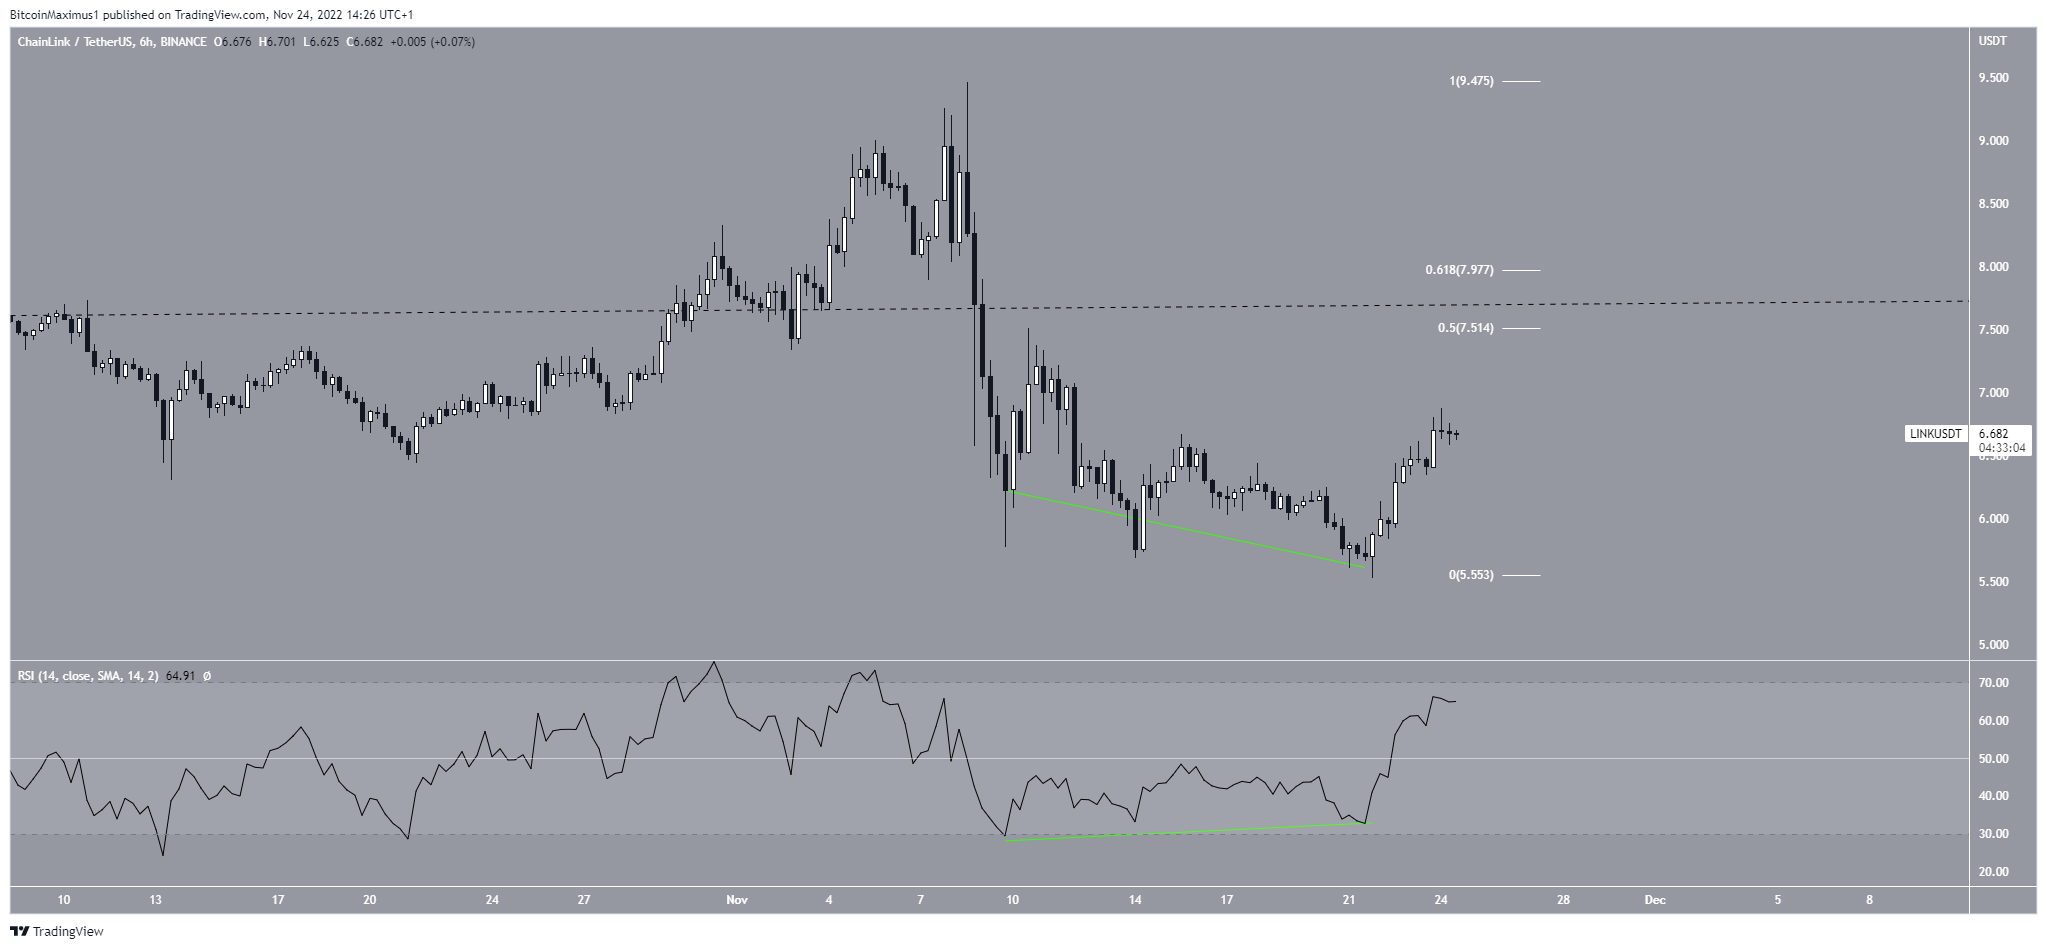
The six-hour chart shows a bullish divergence developing since Nov. 19 (green). Moreover, the LINK price broke out from a short-term descending resistance line. As a result, an upward movement toward the middle of the channel is expected. The channel’s midline also coincides with the 0.5-0.618 Fib retracement resistance area at $7.51-$8.
The reaction once the LINK token price gets there will determine if the future Chainlink price prediction is bullish or bearish. If the rate of increase accelerates, the LINK price may get there in the next 24 hours.
Conversely, a decrease below the Nov. 21 low of $5.52 would invalidate this bullish Chainlink (LINK) price prediction.
For BeInCrypto’s latest crypto market analysis, click here.
Disclaimer: BeInCrypto strives to provide accurate and up-to-date news and information, but it will not be responsible for any missing facts or inaccurate information. You comply and understand that you should use any of this information at your own risk. Cryptocurrencies are highly volatile financial assets, so research and make your own financial decisions.


