ChainLink (LINK) is trading in the middle of a pattern that has been in place since July 2021. Whether it reclaims the midline or gets rejected from it could determine the direction of the ensuing movement.
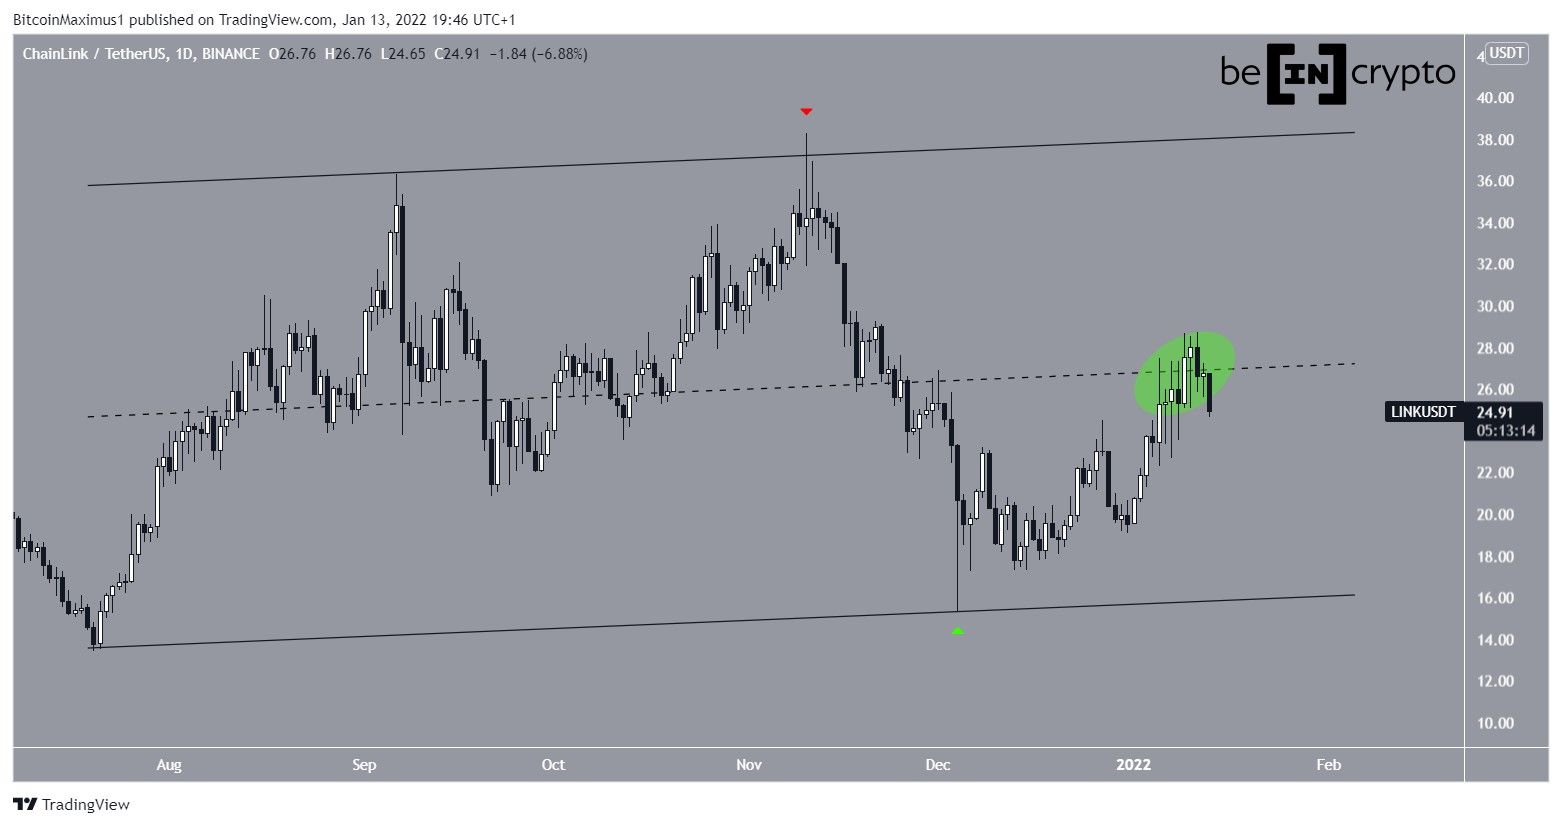
LINK has been moving upwards since July 20, when it bounced after reaching a low of $13.38. The upward movement led to a high of $38.31 on Nov 10. This validated the resistance line of an ascending parallel channel (red icon), which has been containing the entire movement.
On Dec 4, the token bounced after reaching a low of $15.32, creating a very long lower wick (green icon). This is considered a sign of buying pressure. LINK has been increasing since.
Currently, it is trading right in the middle of this parallel channel. Whether it reclaims it or gets rejected and falls will likely determine the direction of the longer-term trend.
Technical indicators
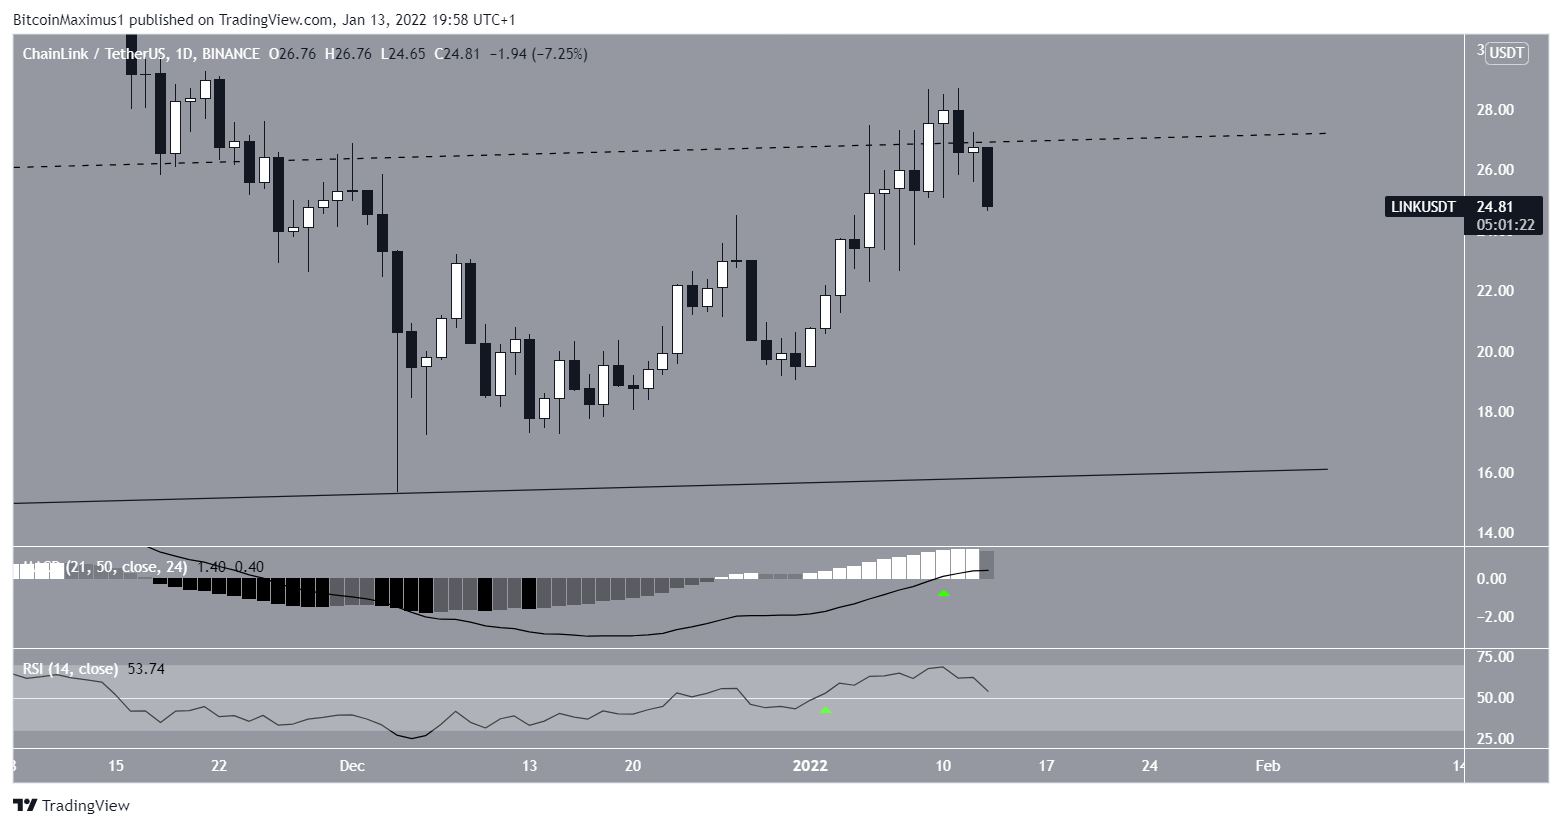
Despite the rejection, technical indicators in the daily time-frame are still bullish.
The MACD, which is created by a short- and a long-term moving average (MA), has crossed into positive territory. This means that the short-term MA is faster than the long-term one, and it is a sign of bullish trends.
Similarly, the RSI, which is a momentum indicator, has moved above 50 (green icon). This is also considered a sign of bullish trends.
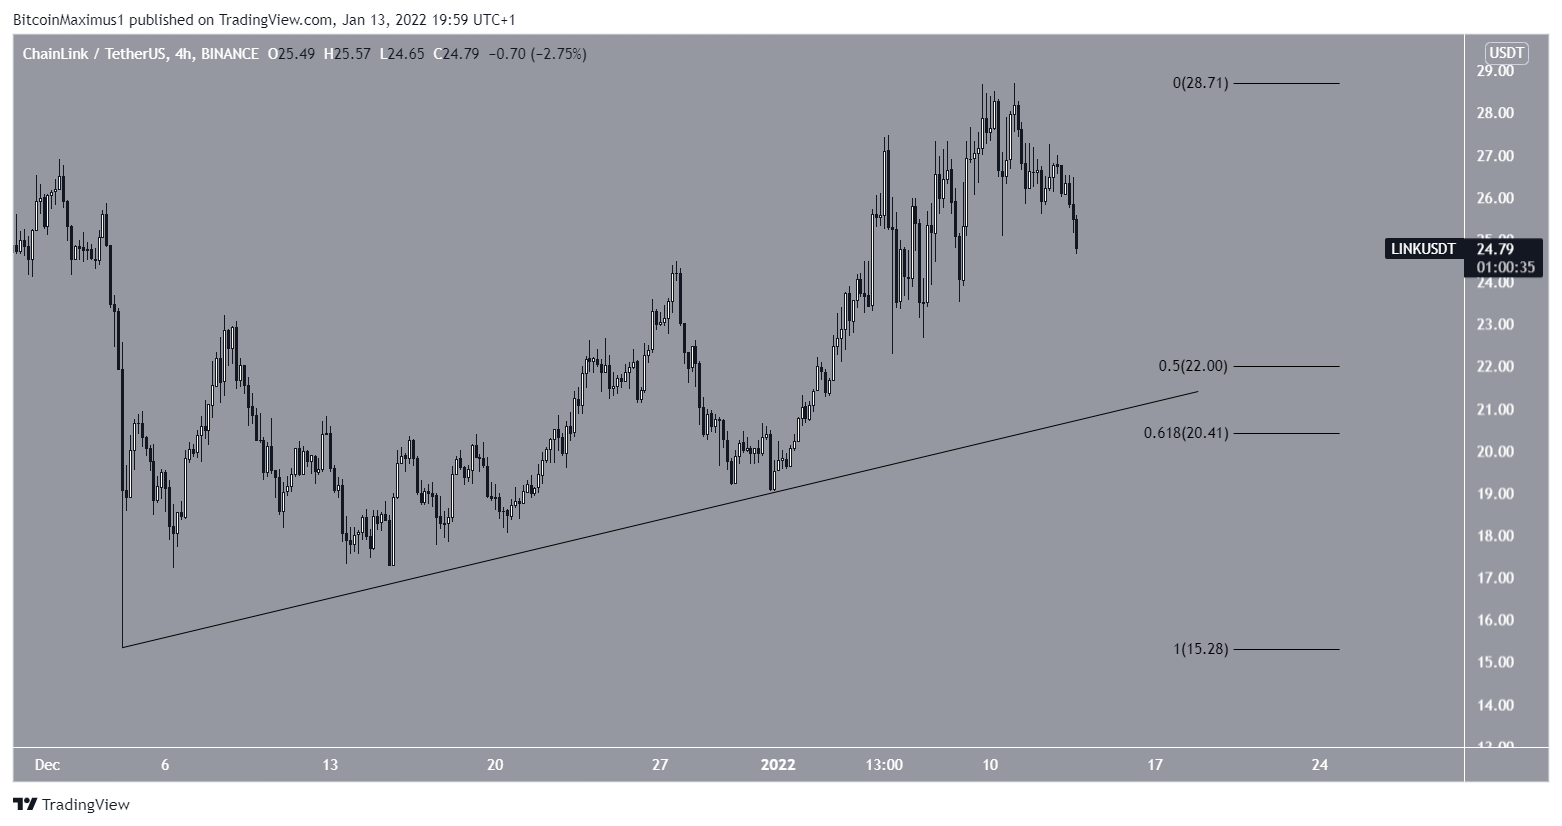
Therefore, the most likely scenario would have LINK finding short-term support, creating a higher low and resuming its upward movement afterwards.
In this case, the closest support area would be between $20.4 – $22. This is the 0.5-0.618 Fib retracement support area and also coincides with an ascending support line.
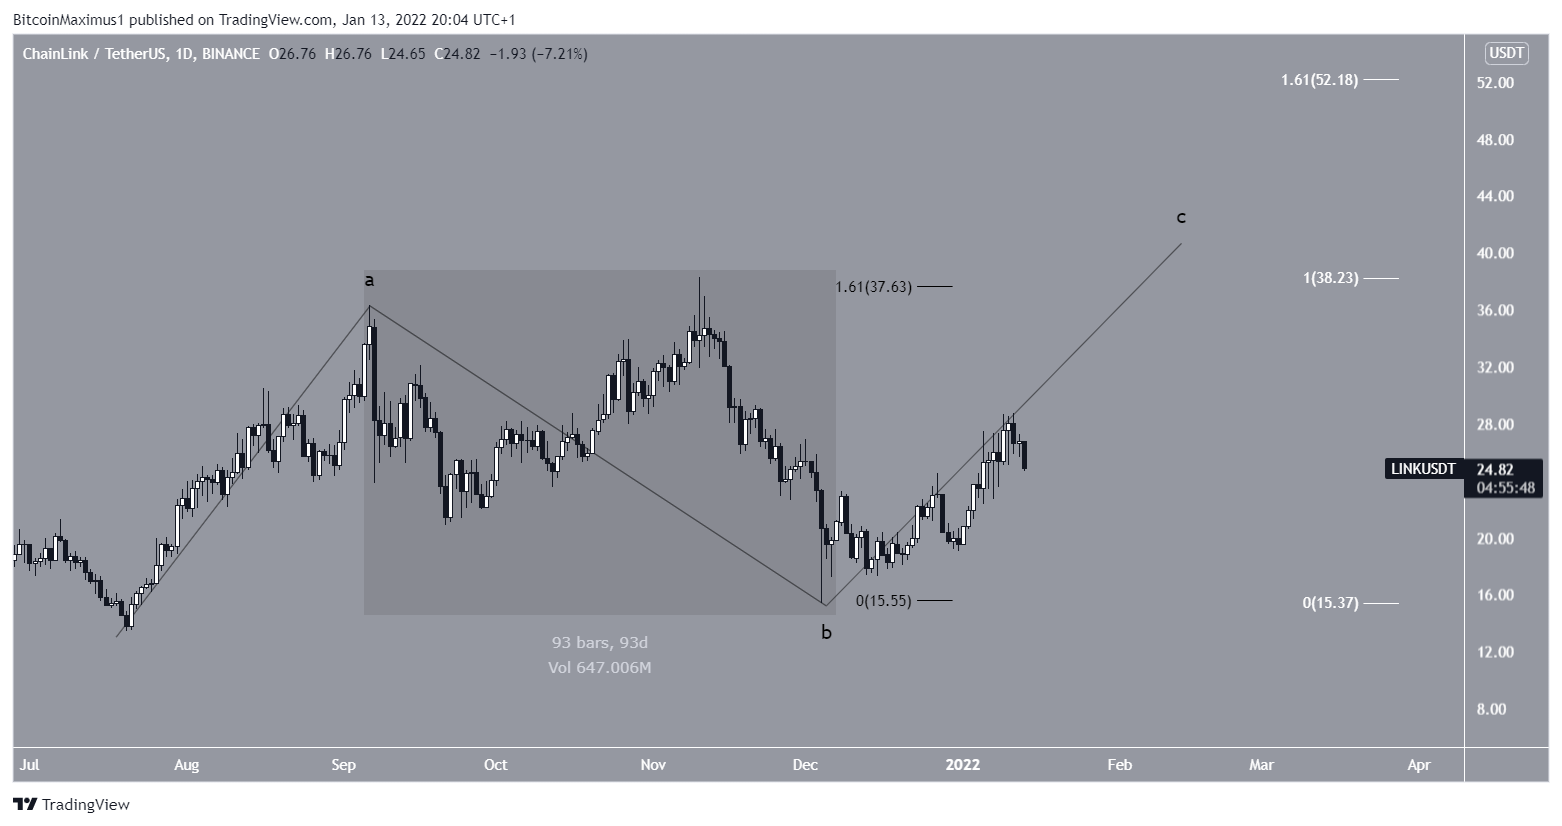
LINK wave count
Cryptocurrency trader @Altstreetbet tweeted a LINK chart, stating that the token is expected to increase towards $43.5.
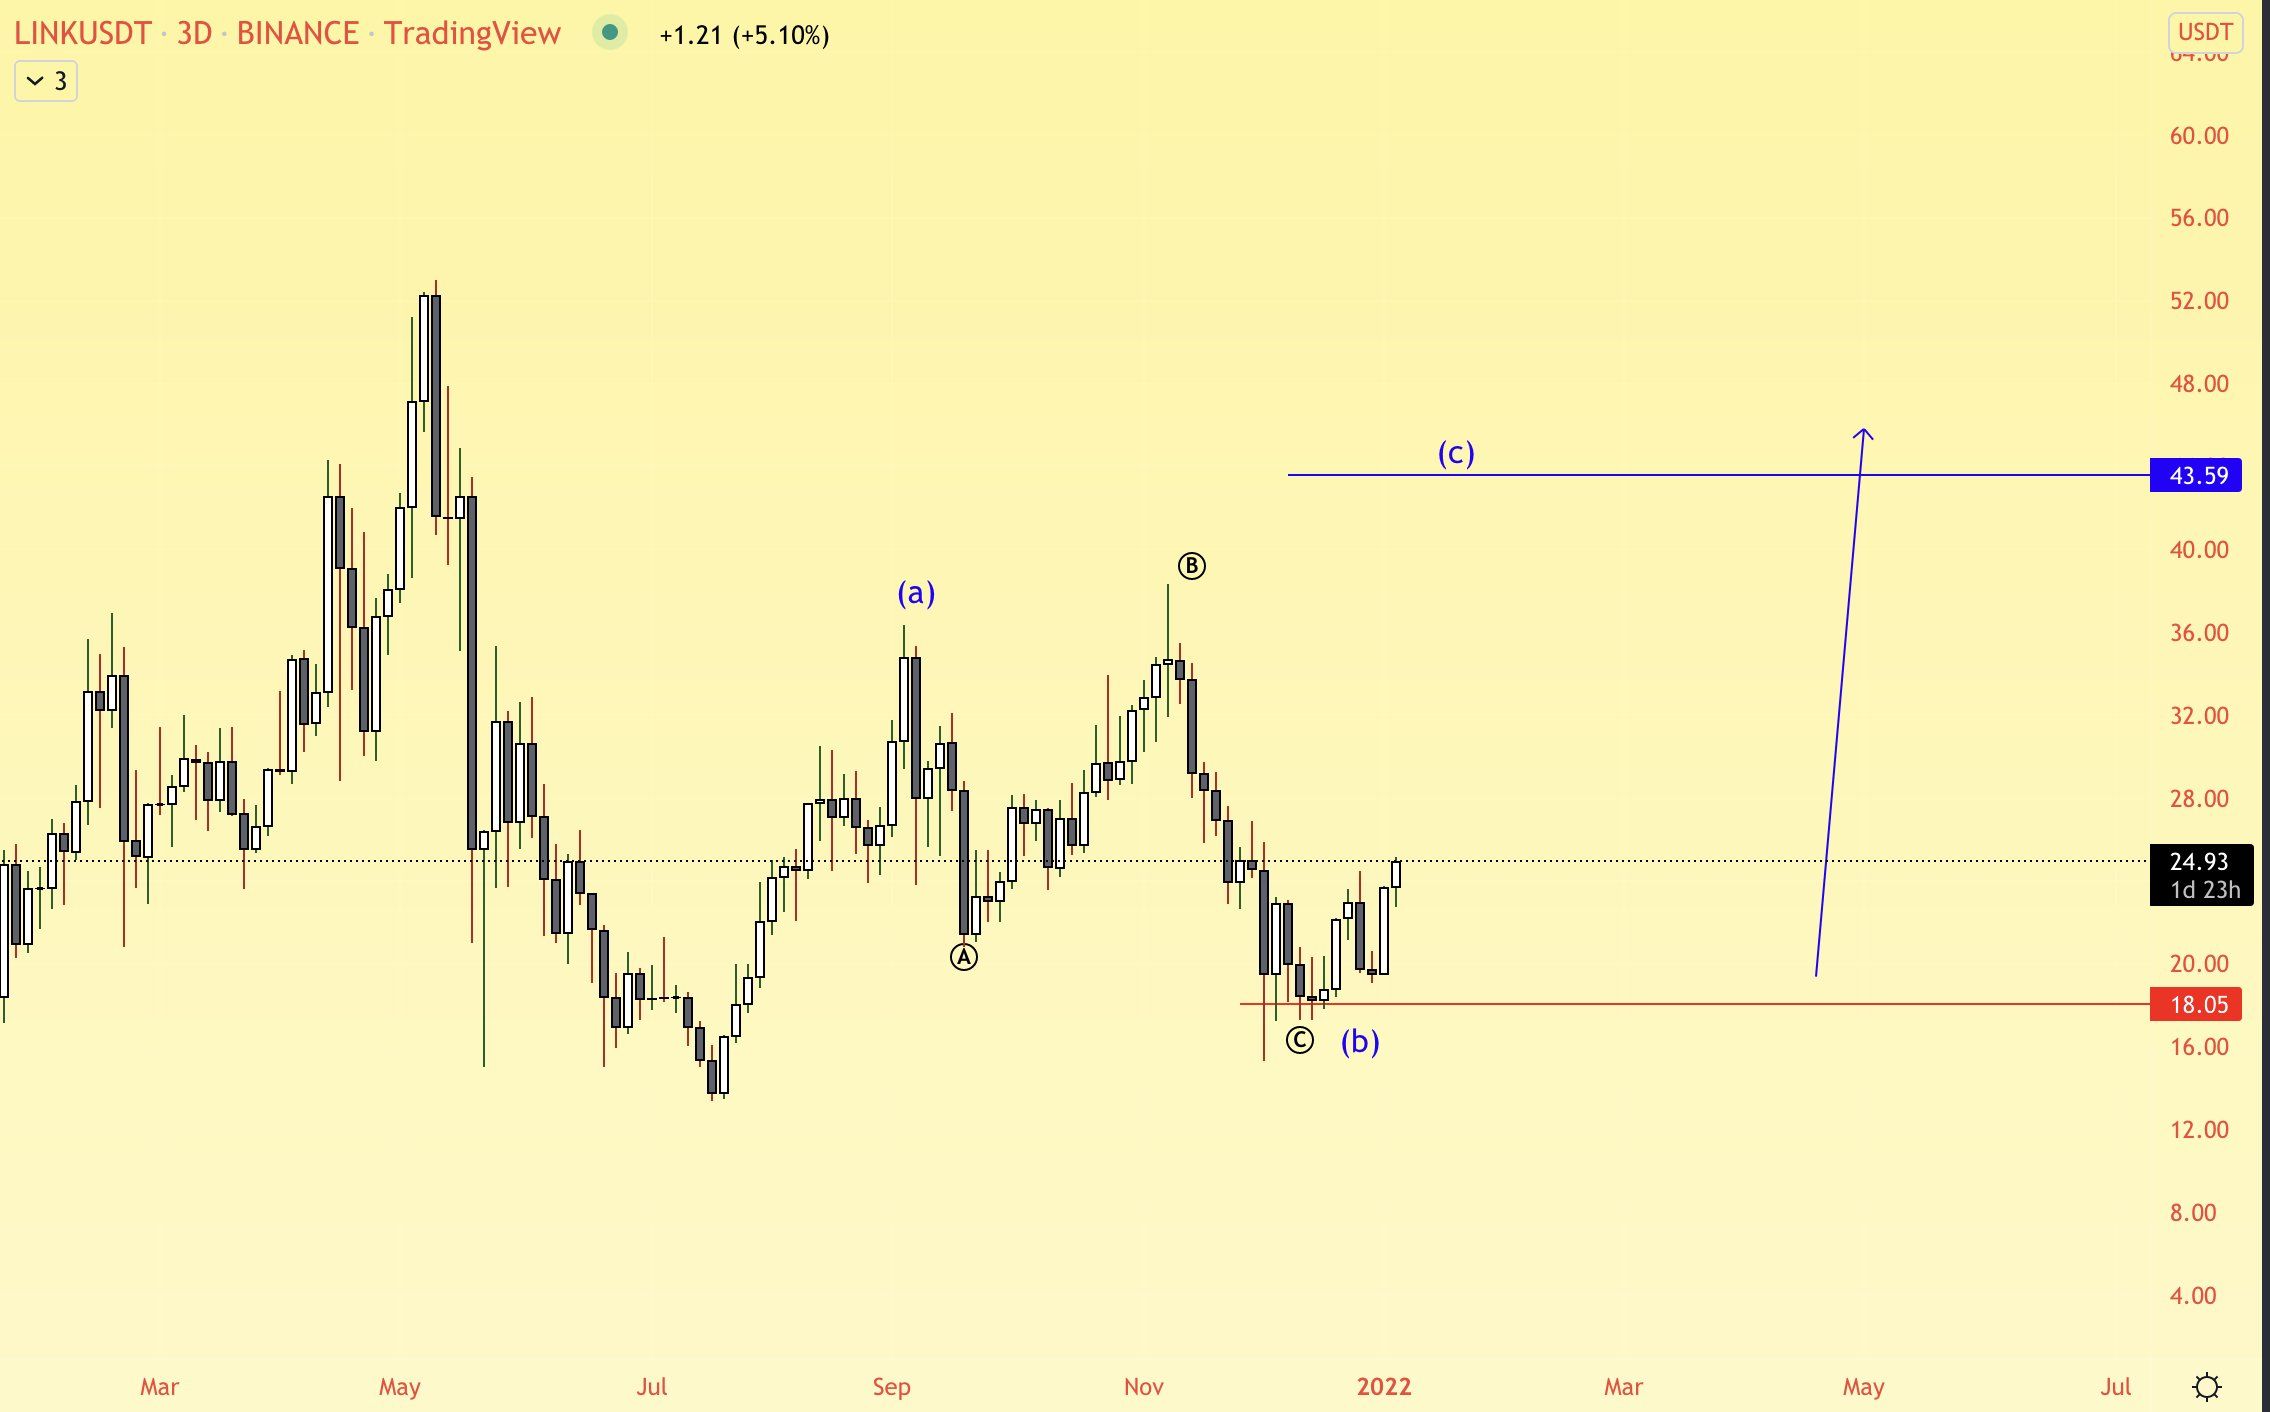
The most likely wave count does suggest that LINK is in wave C of an A-B-C corrective structure. The B wave (highlighted) is standard, with both parts of the decrease having a 1:1.61 ratio (black), which is common in such structures.
The most likely targets for the top of the movement are at $38 and $52. These would give waves A:C a 1:1 and 1:1.61 ratio (white), respectively.