
Celestia’s (TIA) price has declined steadily since the beginning of June to form a descending channel.
Exchanging hands at $6.45 at press time, the altcoin currently trades at a price level last observed in December 2023.
Celestia Witnesses Spike in Token Sell-Offs
Since its price climbed to a 30-day high of $10.76 on May 29, Celestia’s (TIA) price has plunged. It has since trended within a descending channel, suggesting sustained selling pressure.
The token’s Relative Strength Index (RSI) is currently 25.8, confirming the high TIA sell-offs among market participants.
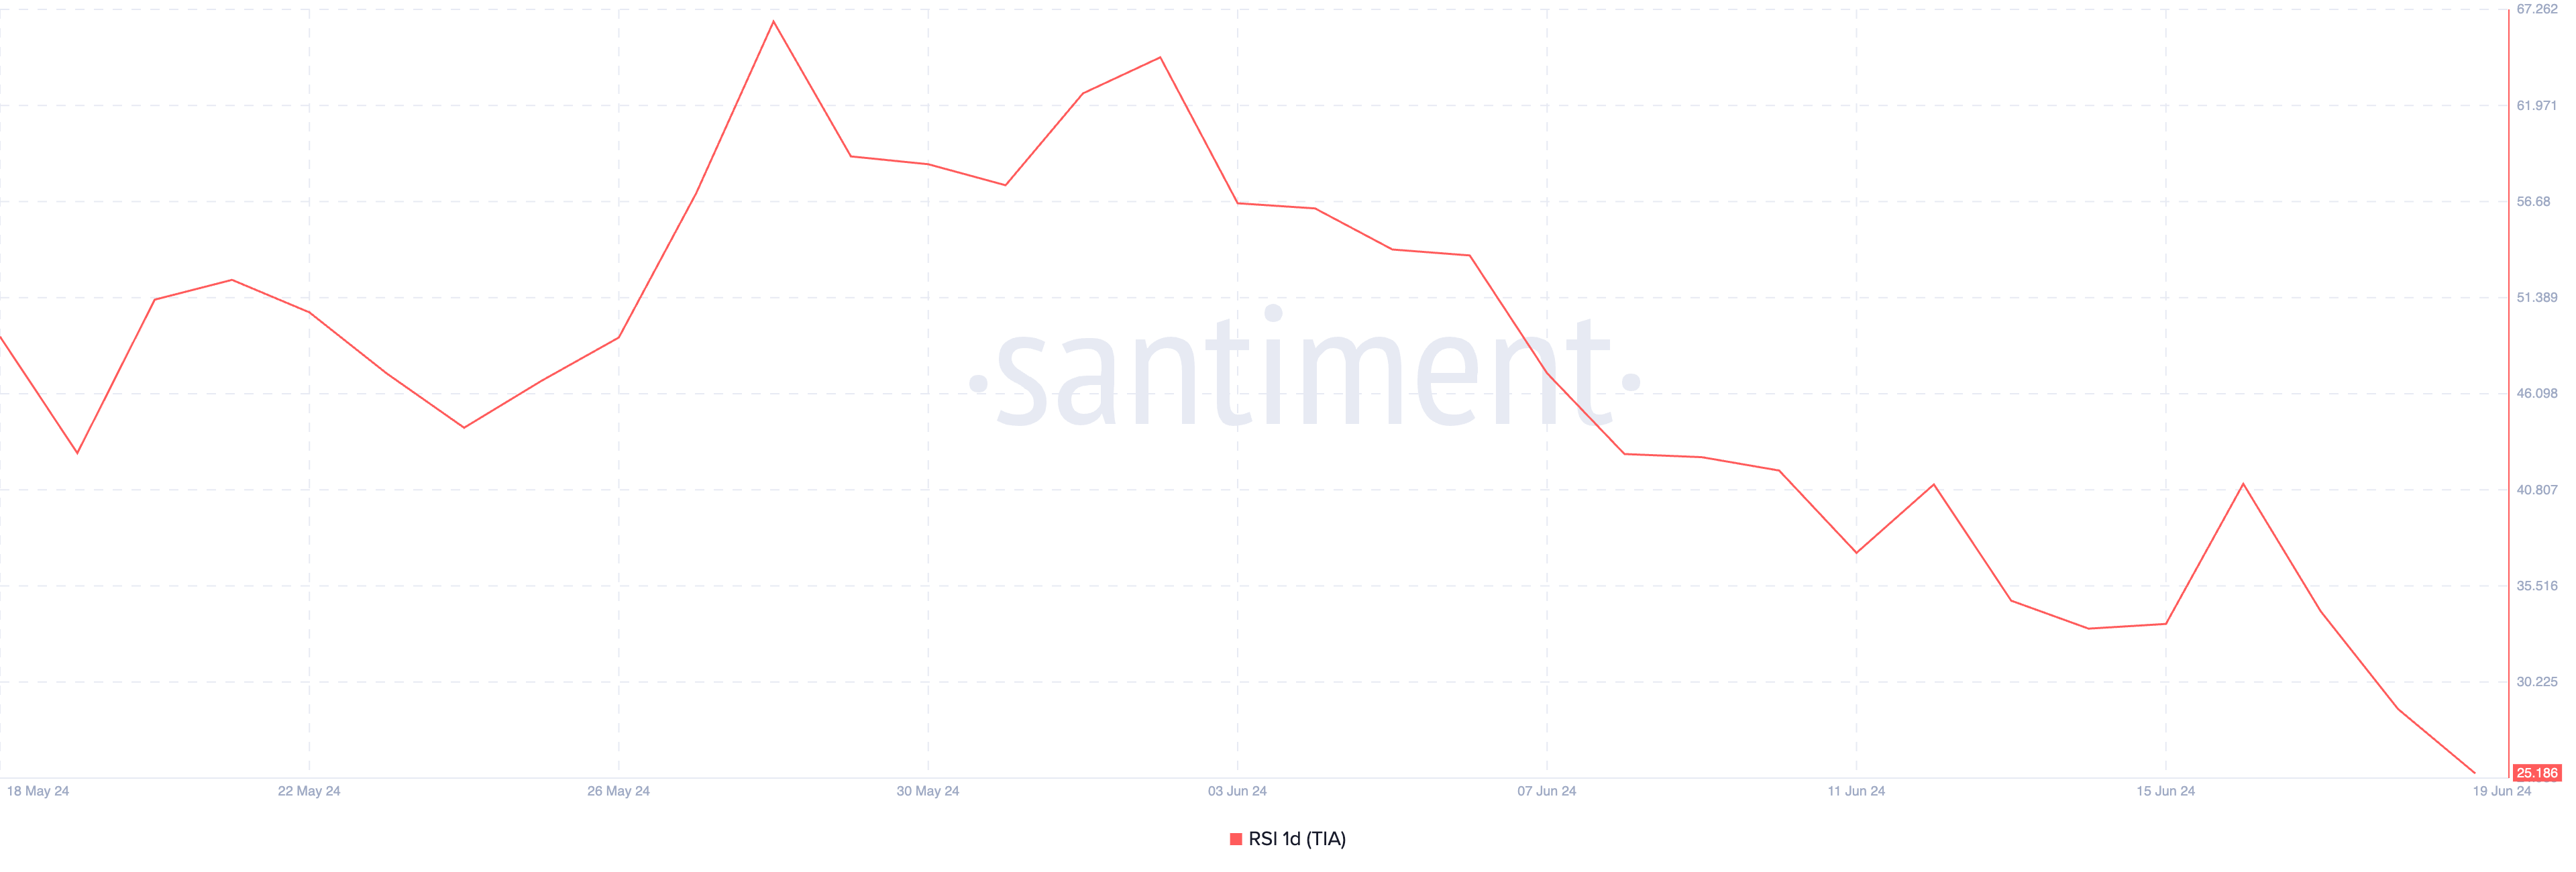
This indicator measures the asset’s overbought and oversold conditions by tracking price changes. The indicator ranges from 0 to 100. Readings above 70 indicate that an asset is overbought and likely due for a correction, whereas readings below 30 suggest the asset is oversold and could potentially rebound soon.
At 25.8, TIA’s RSI confirmed market participants’ preference for selling. This signals that TIA traders prefer to sell their holdings rather than buy new tokens.
Further, as TIA’s price falls, its futures open interest also craters. At $76.06 million at press time, it has dropped by 41% since the beginning of June.
Read More: Top 10 Aspiring Crypto Coins for 2024
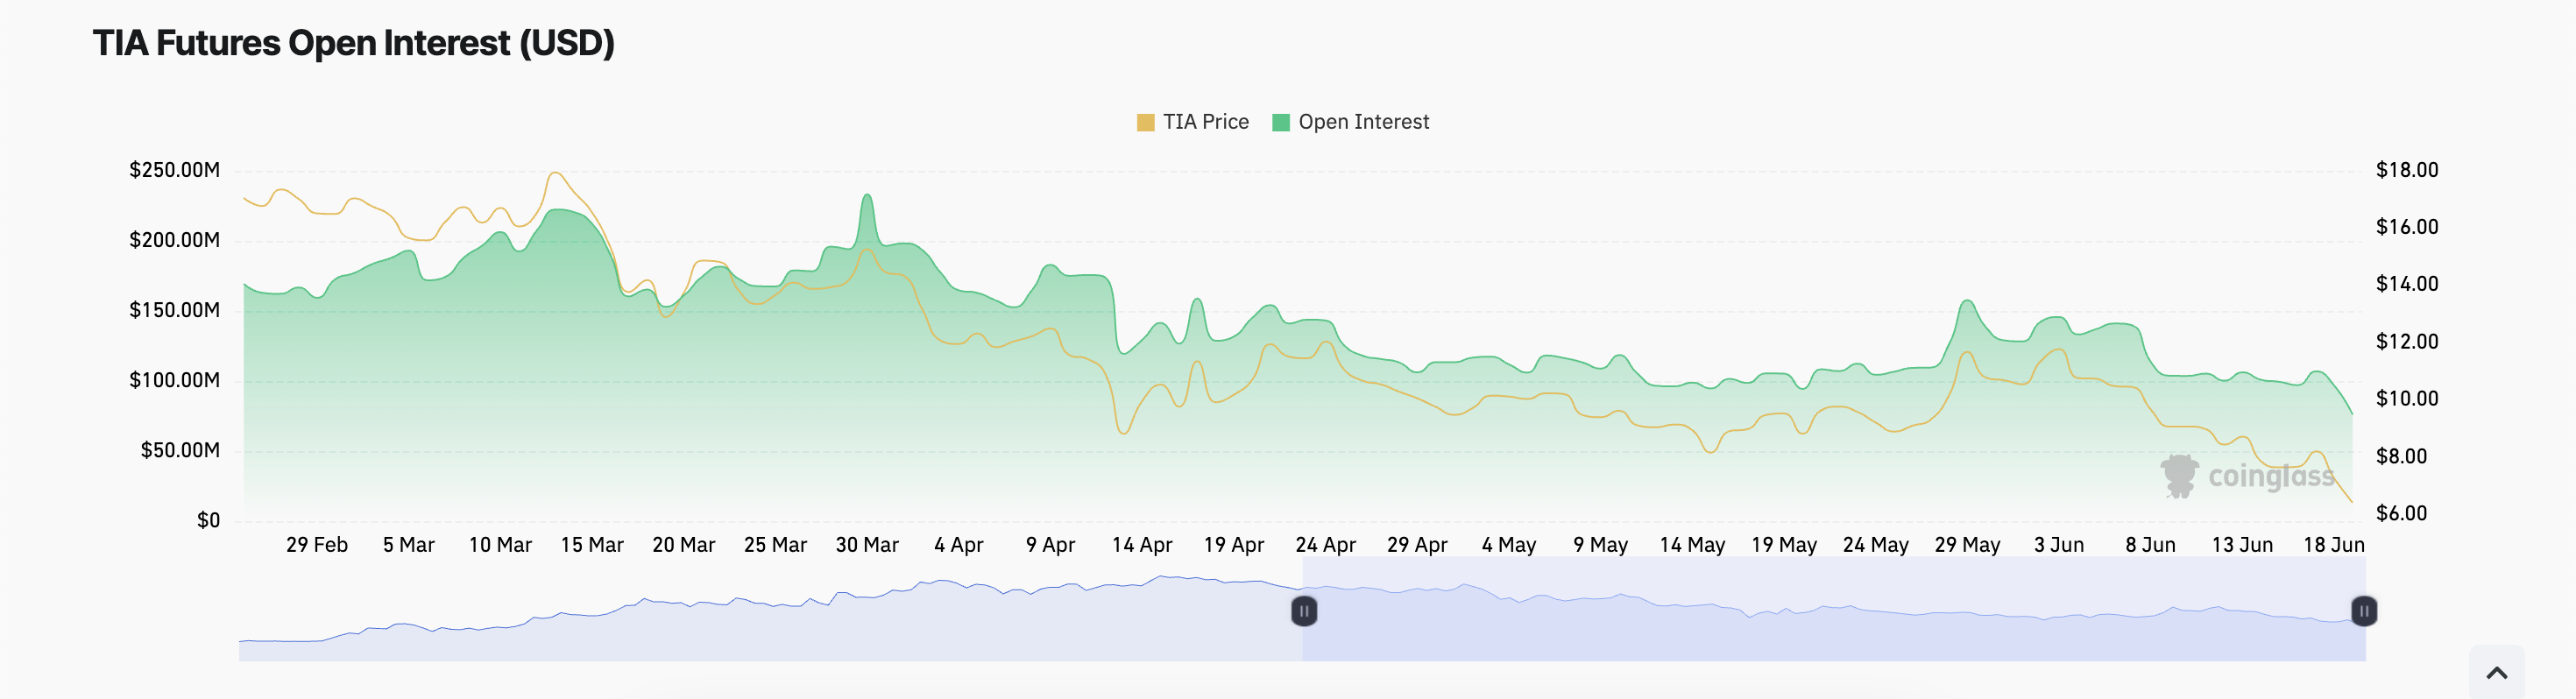
For context, at its current level, TIA’s futures open interest currently sits at a level last seen in November 2023.
An asset’s futures open interest tracks the total number of outstanding futures contracts or positions that have yet to be closed or settled. When it falls, it signals that more traders are closing their positions and exiting the market without opening new ones.
TIA Price Prediction: Is the Next Stop At $6.02?
TIA’s Aroon indicator confirms the strength of the current market downtrend. As of this writing, TIA’s Aroon Down Line was 92.66%,
This indicator identifies an asset’s trend strength and potential price reversal points. When the Down Line is close to 100, it suggests that the market’s downtrend is strong and that the most recent low was reached relatively recently.
Also, readings from TIA’s Directional Movement Index (DMI) show a bearish bias toward it. At press time, the token’s positive index (blue) rests below the negative index (orange).
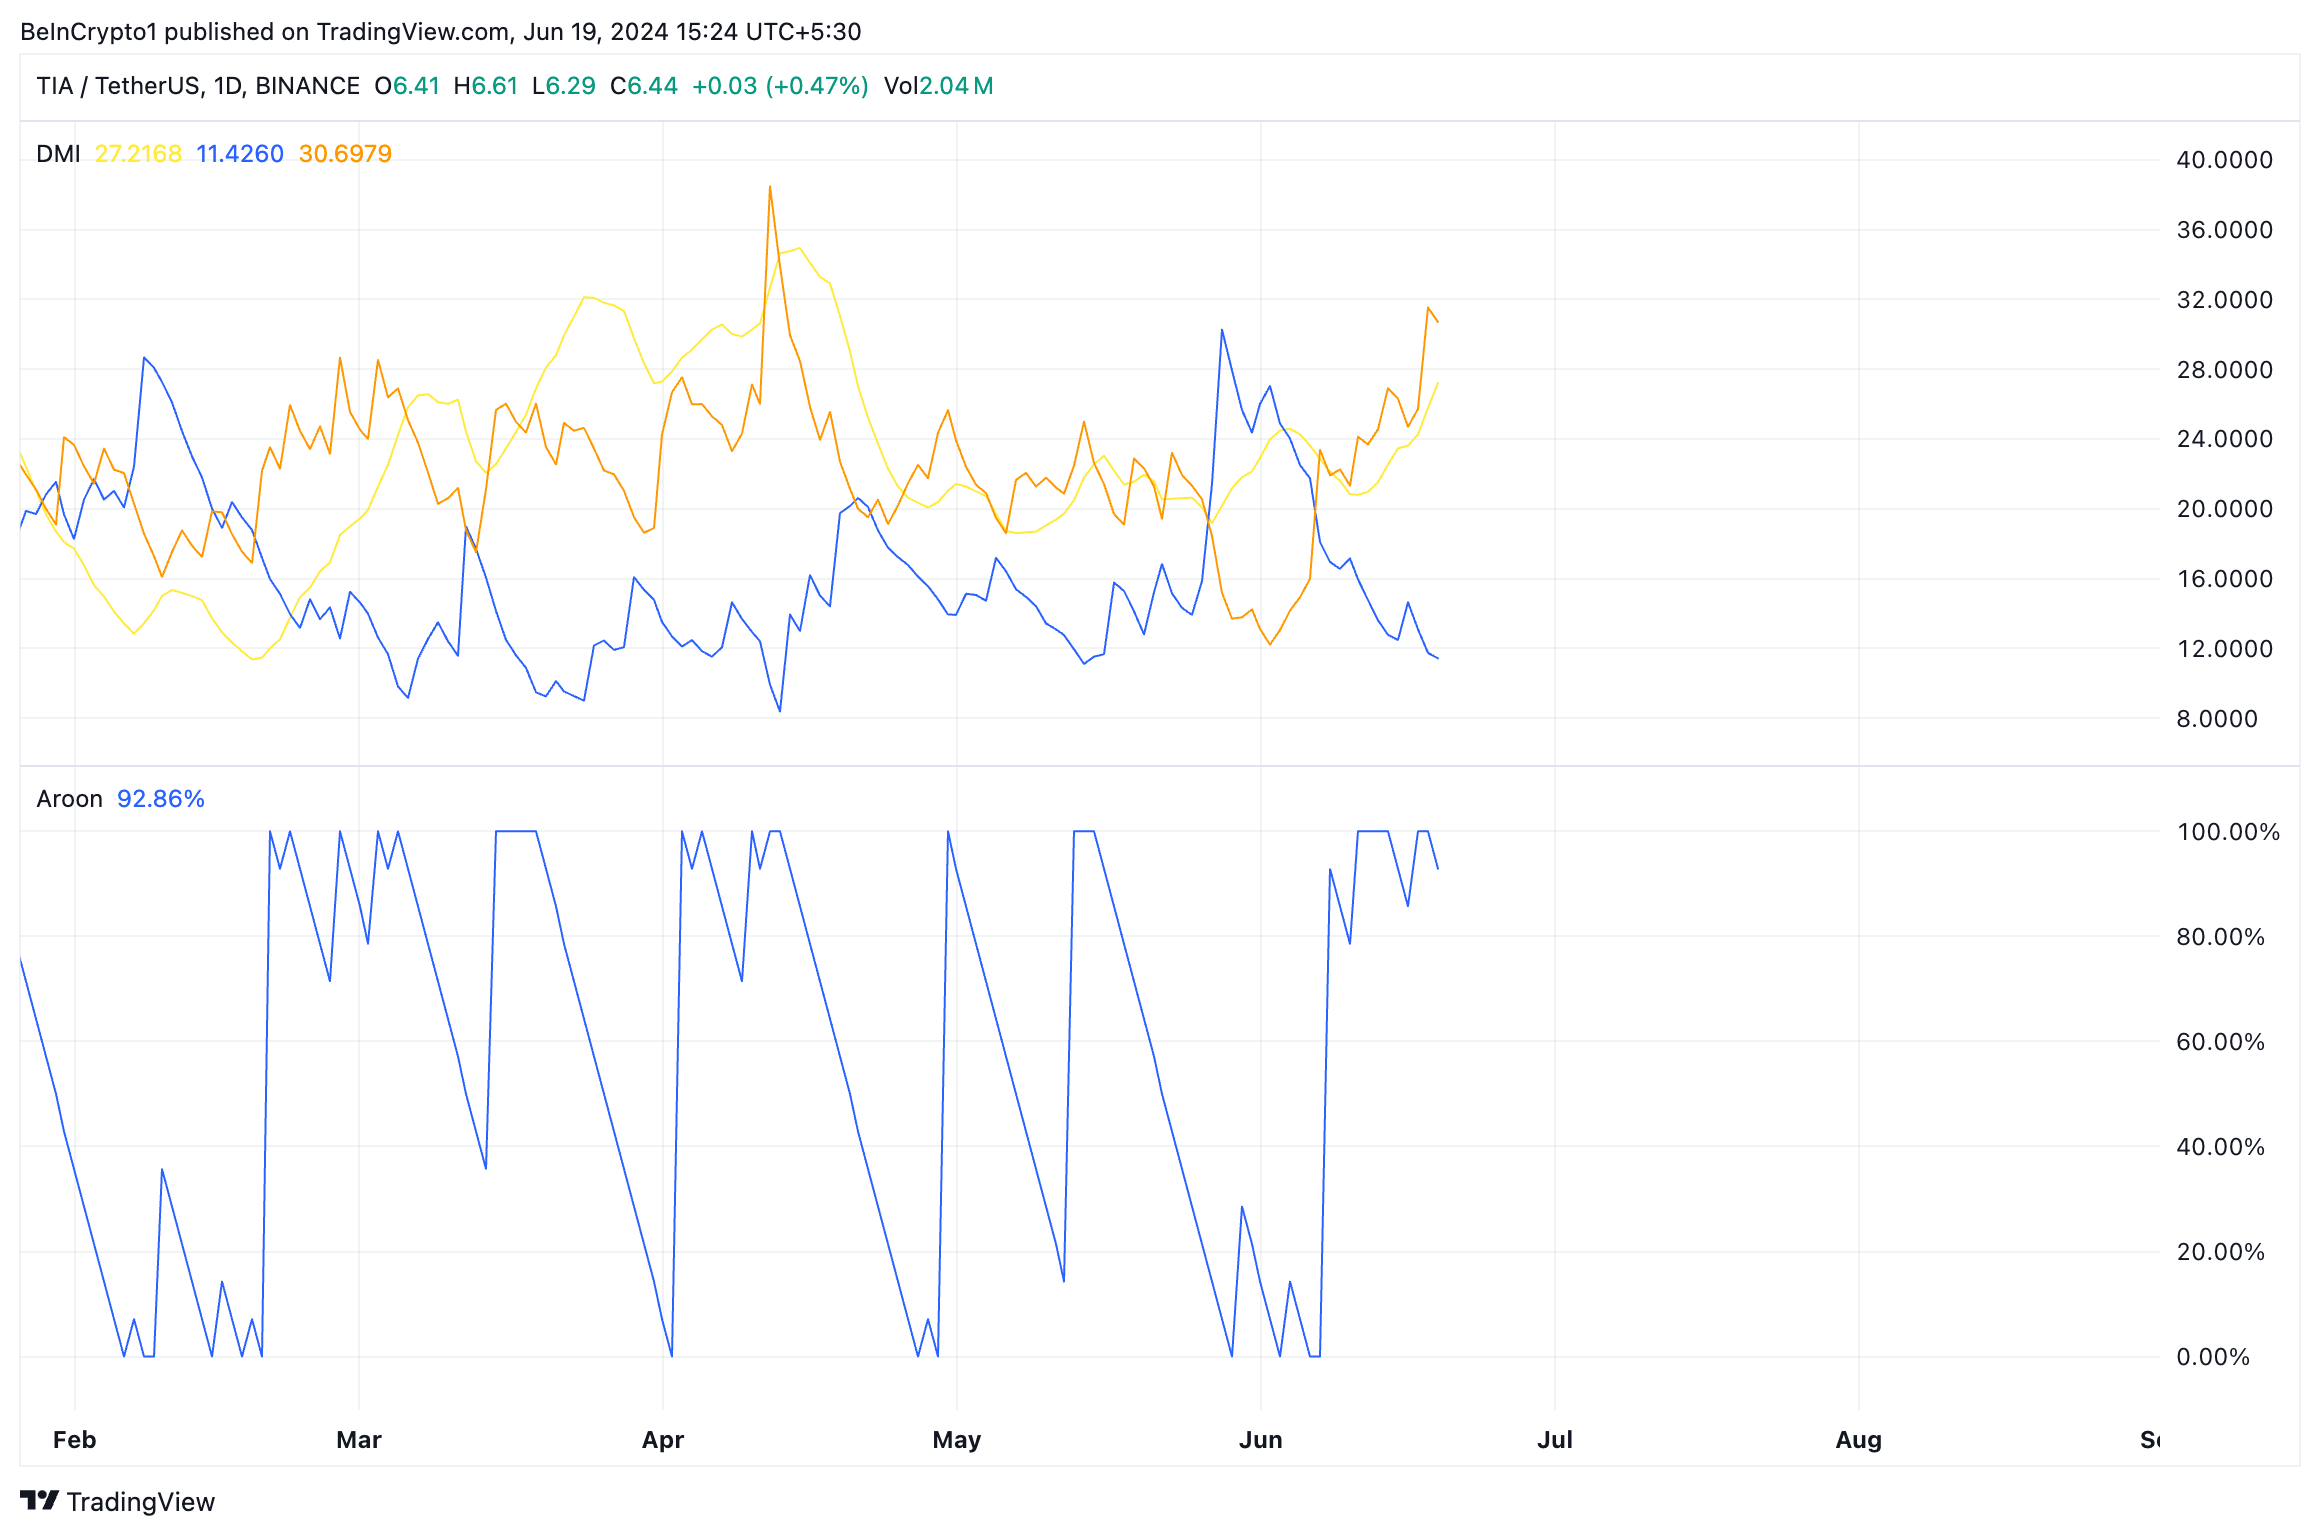
This indicator assesses the strength and direction of a market trend. When set up this way, it signals that the market is in decline.
If this downtrend continues, TIA’s value may fall to $6.02.
Read More: Best Upcoming Airdrops in 2024
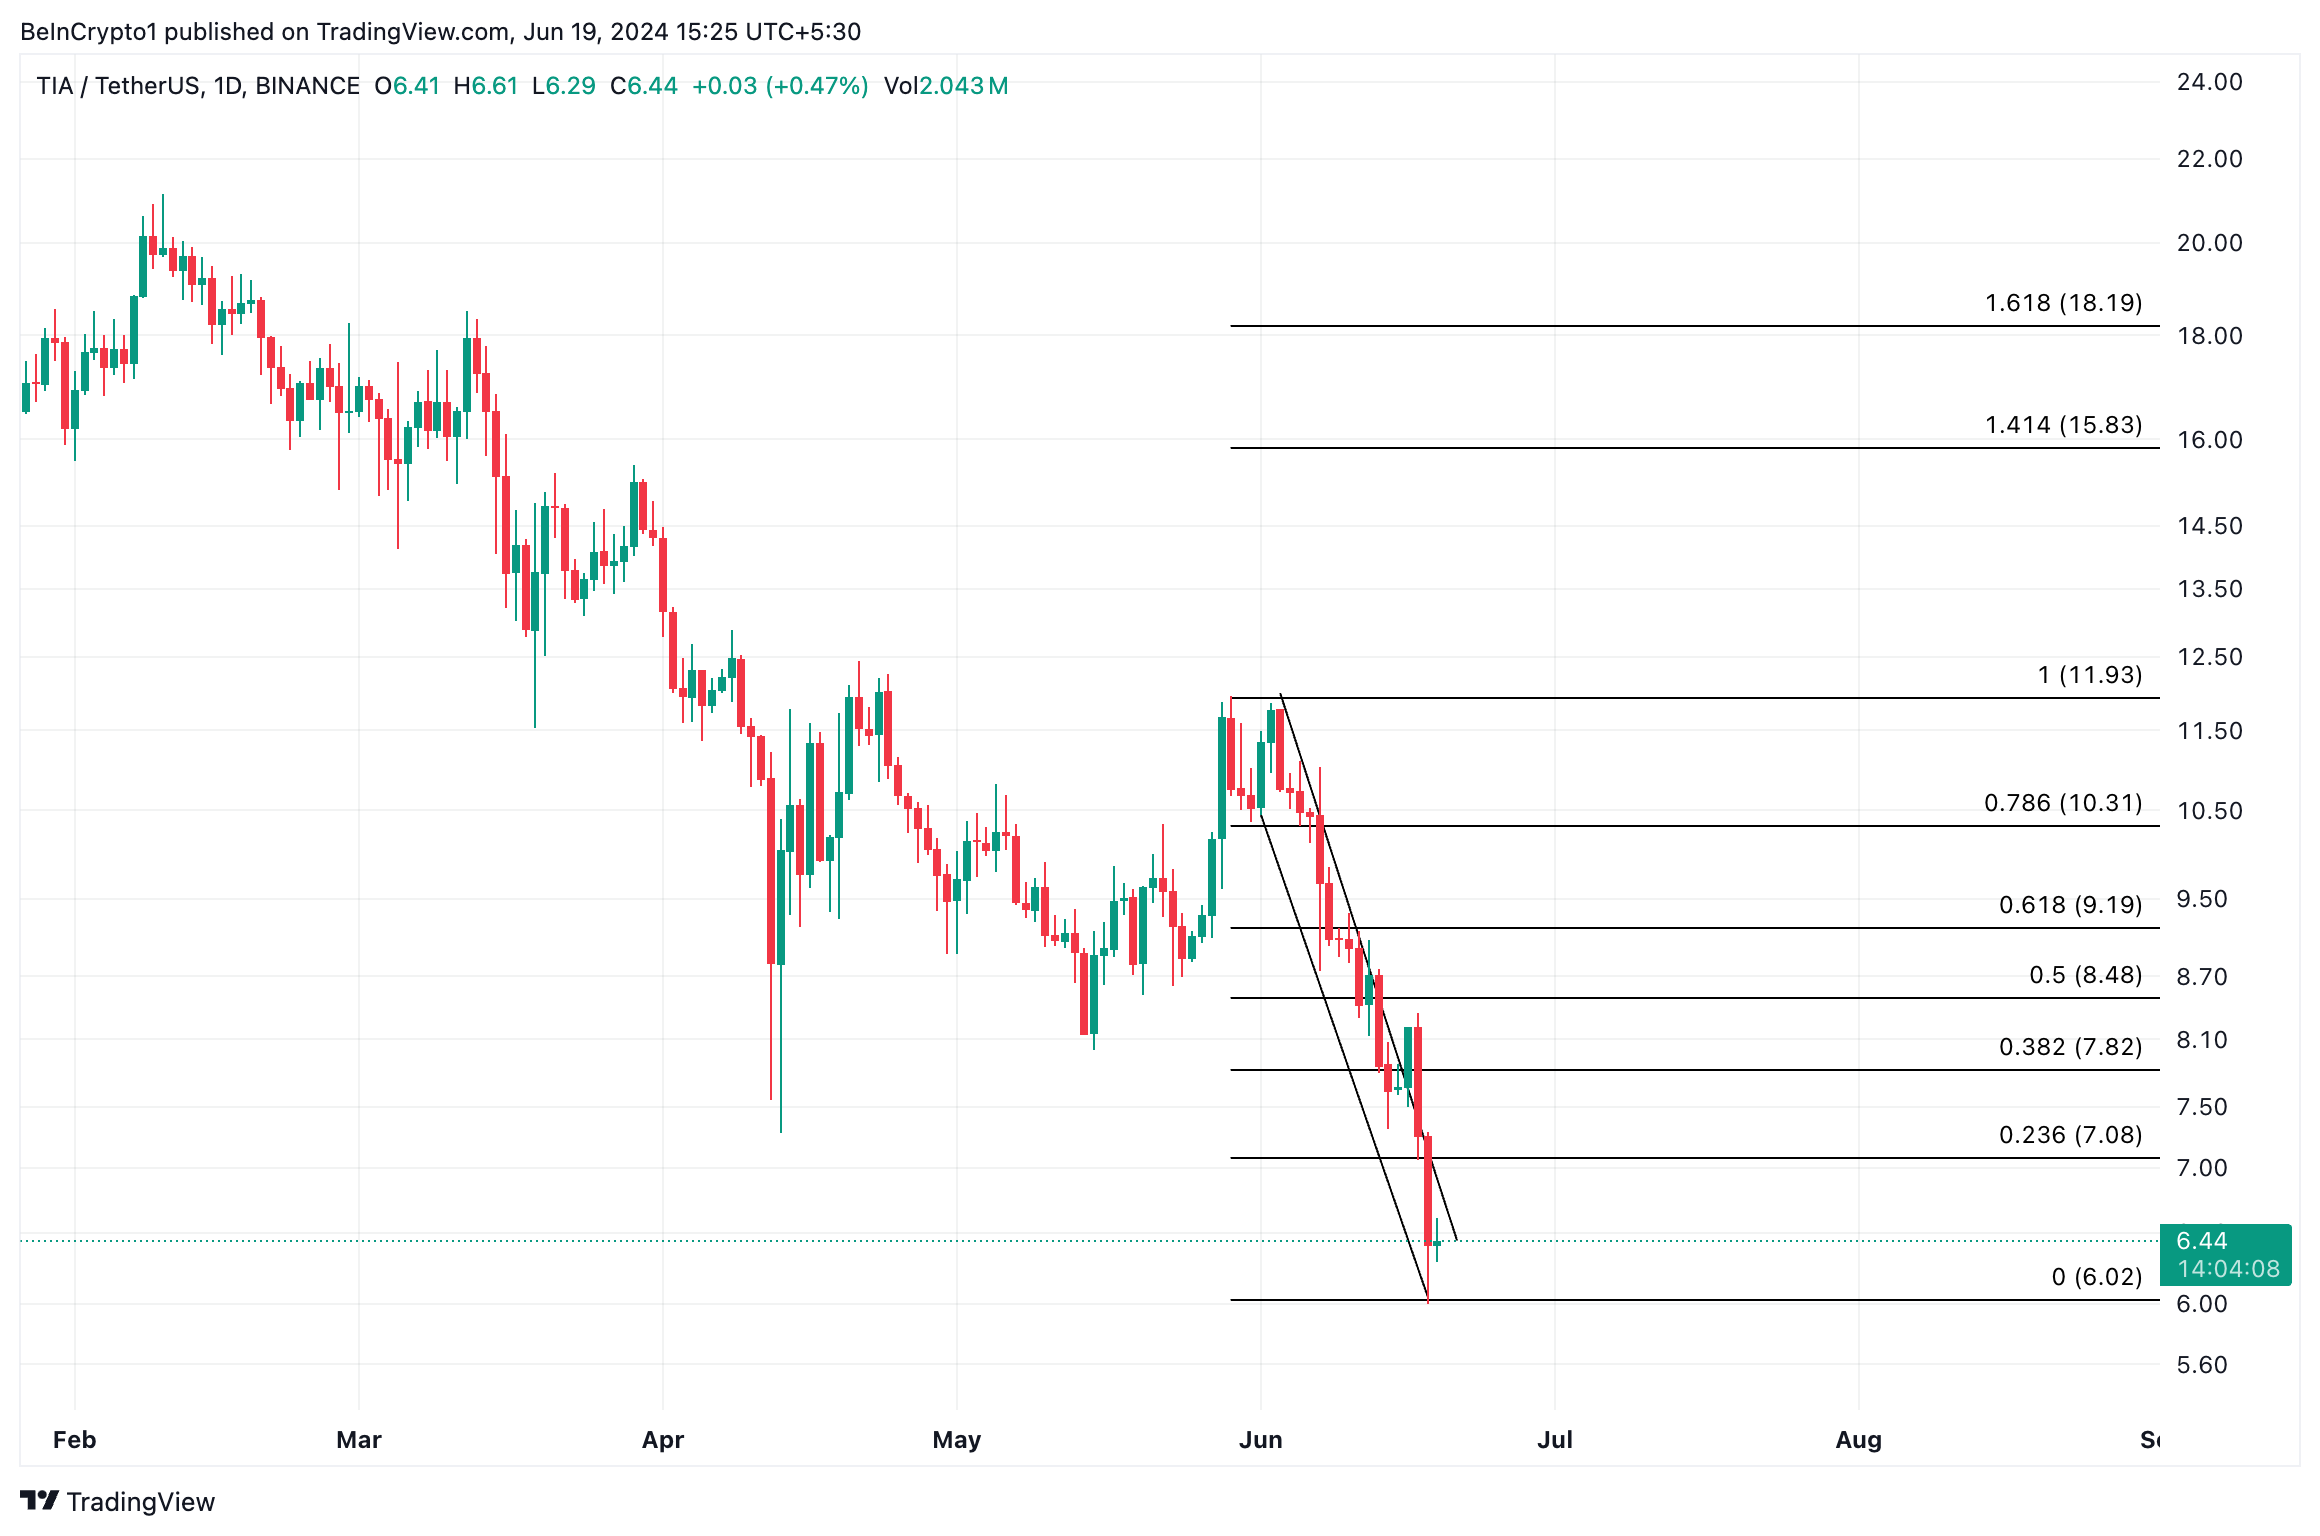
However, if this projection is invalidated, the altcoin’s price may rise to $7.09.
