


The Cardano (ADA) price shows mixed signs on different time frames. Whether it bounces or breaks down from the $0.30 level could determine the future price trend.
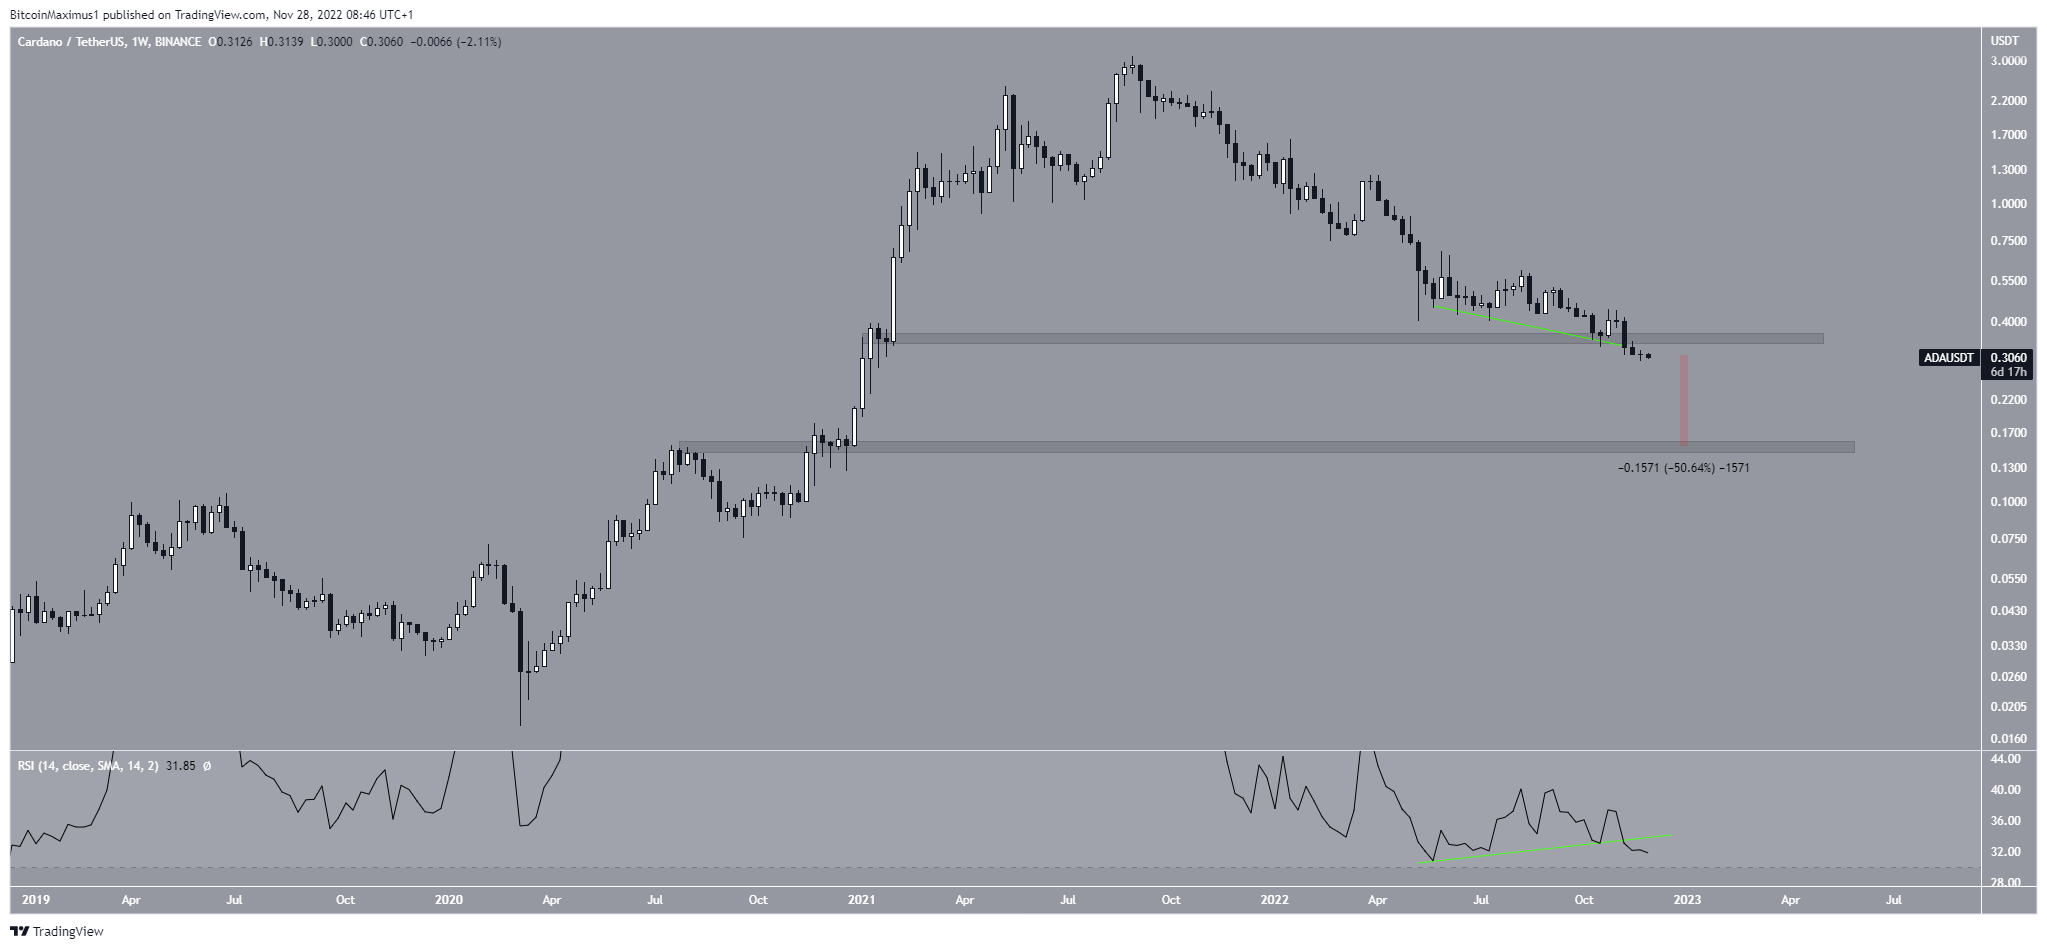
The Cardano blockchain platform is a proof-of-stake platform created by Charles Hoskinson. The Cardano price has been falling since reaching an all-time high of $3.10 on Aug. 2021. The drop led to a low of $0.29 in Nov. 2021.
This caused a breakdown from the long-term $0.35 horizontal support area. The drop accelerated during November 2022, a fall seen throughout the crypto market.
Moreover, the decrease invalidated a bullish divergence in the weekly RSI (green line). This is another sign of the continuation of the decline
If the downward movement continues, the next closest support area would be at $0.15, a 50% drop from the current level.
As a result, the weekly time frame indicates that the Cardano price prediction is bearish.
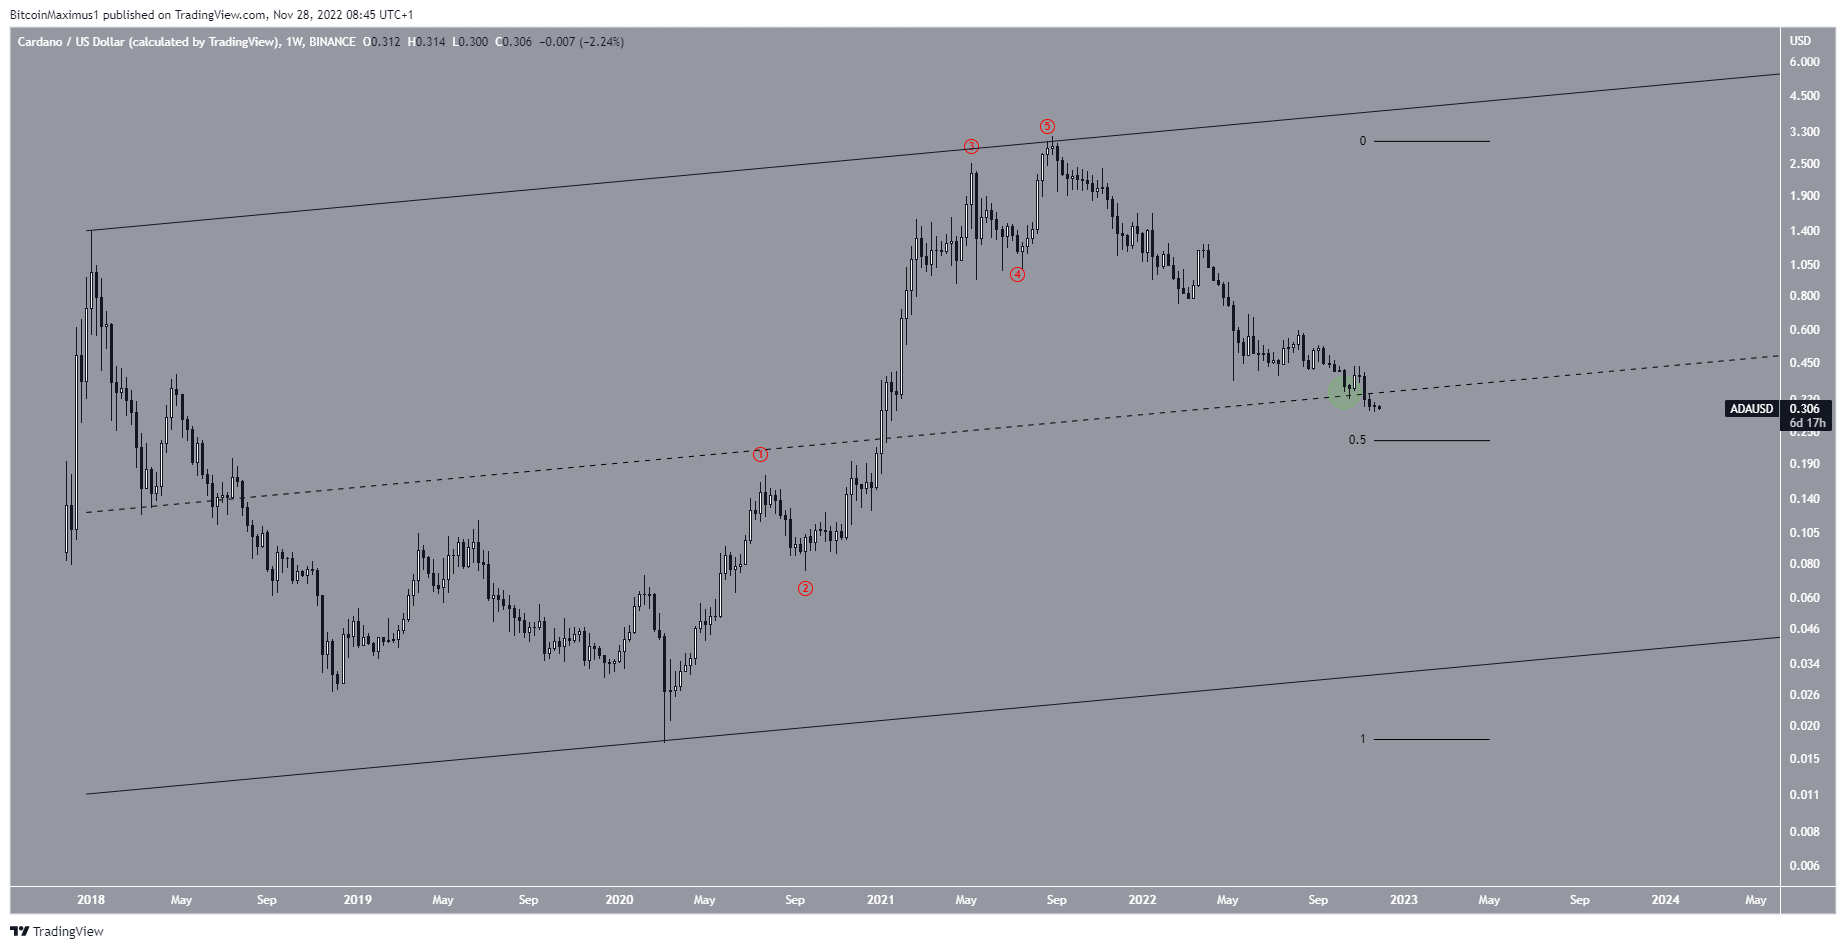
Another bearish outline is revealed by drawing an ascending parallel channel to connect the 2017 high with the all-time high. Doing so shows that the ADA price has broken down from the middle of this channel (green circle).
However, it also provides a closer support area at $0.22, created by the 0.5 Fib retracement support level. This may act as a bottom for the future price.
Will Cardano Price Bounce?
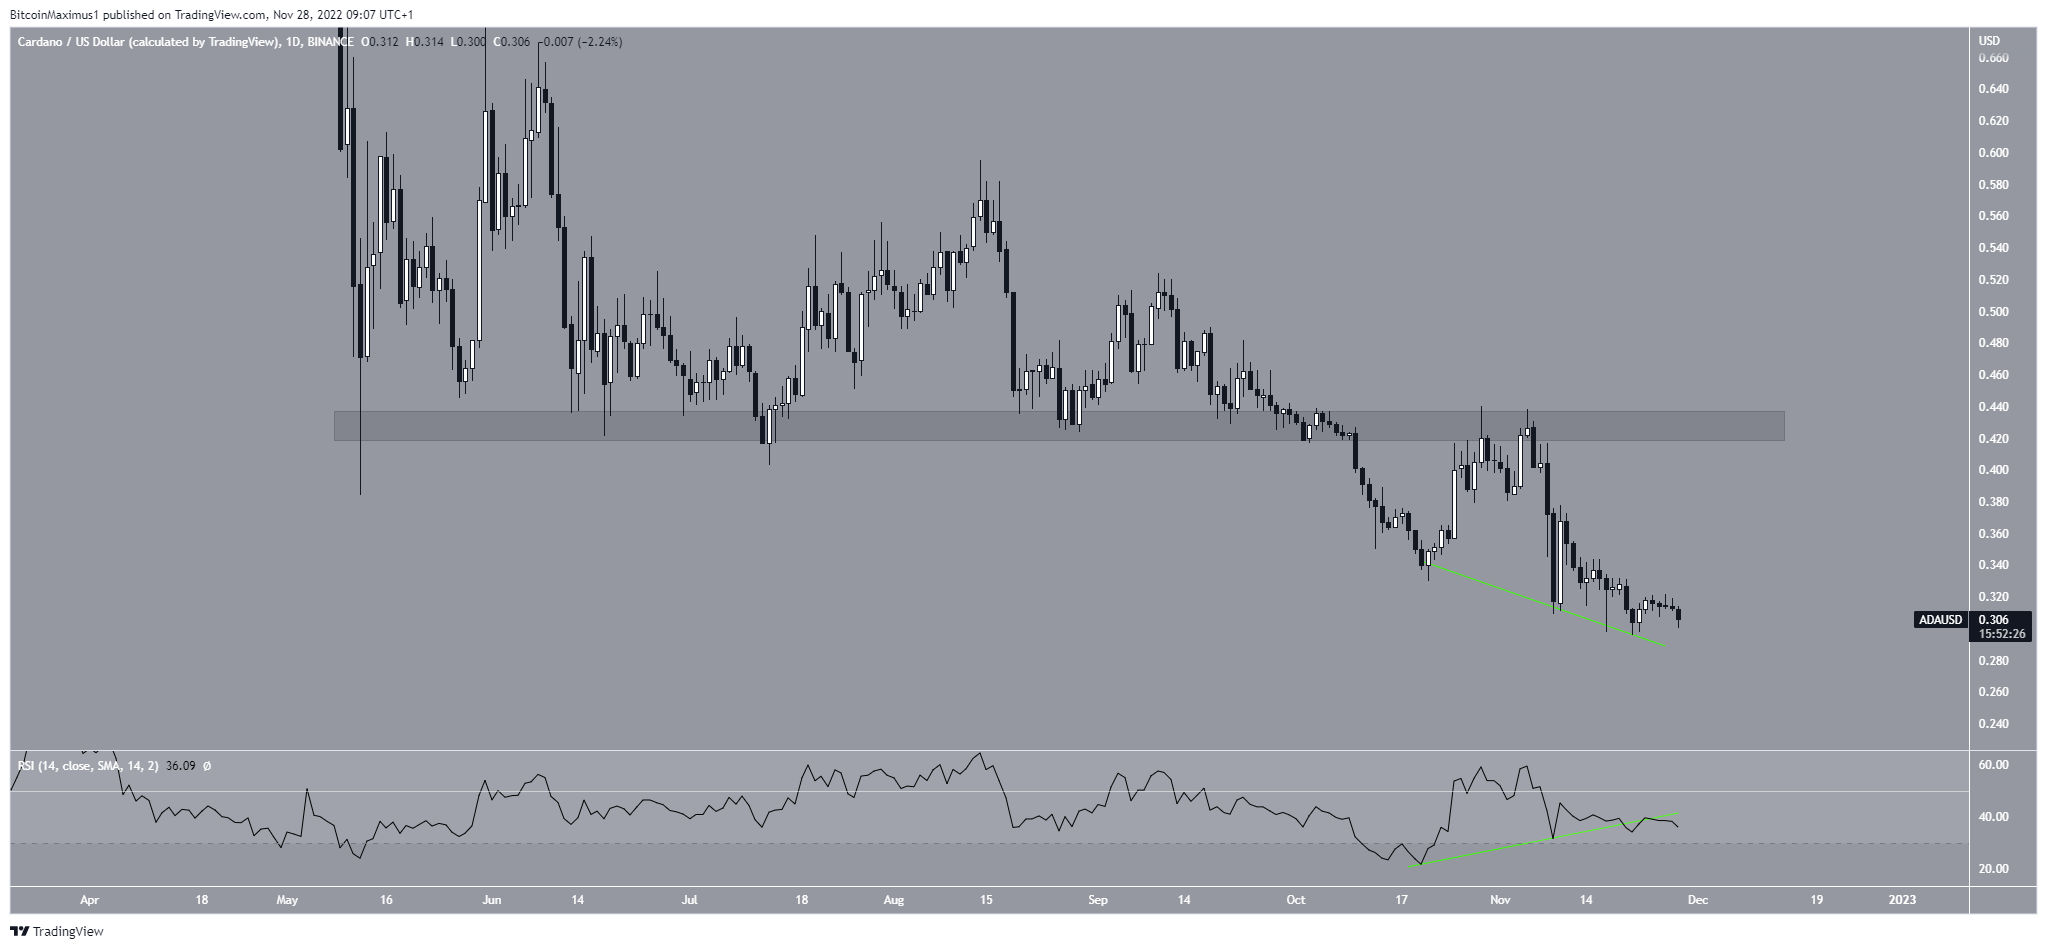
The technical analysis from the daily chart shows that the ADA price was rejected by the $0.43 horizontal resistance area at the beginning of Nov. It has been falling since. It reached a maximum price of $0.44 before the rejection.
While the daily RSI has generated bullish divergence (green line), its trend line seems to have been invalidated. As a result, it is not certain if the divergence will lead to a bounce.
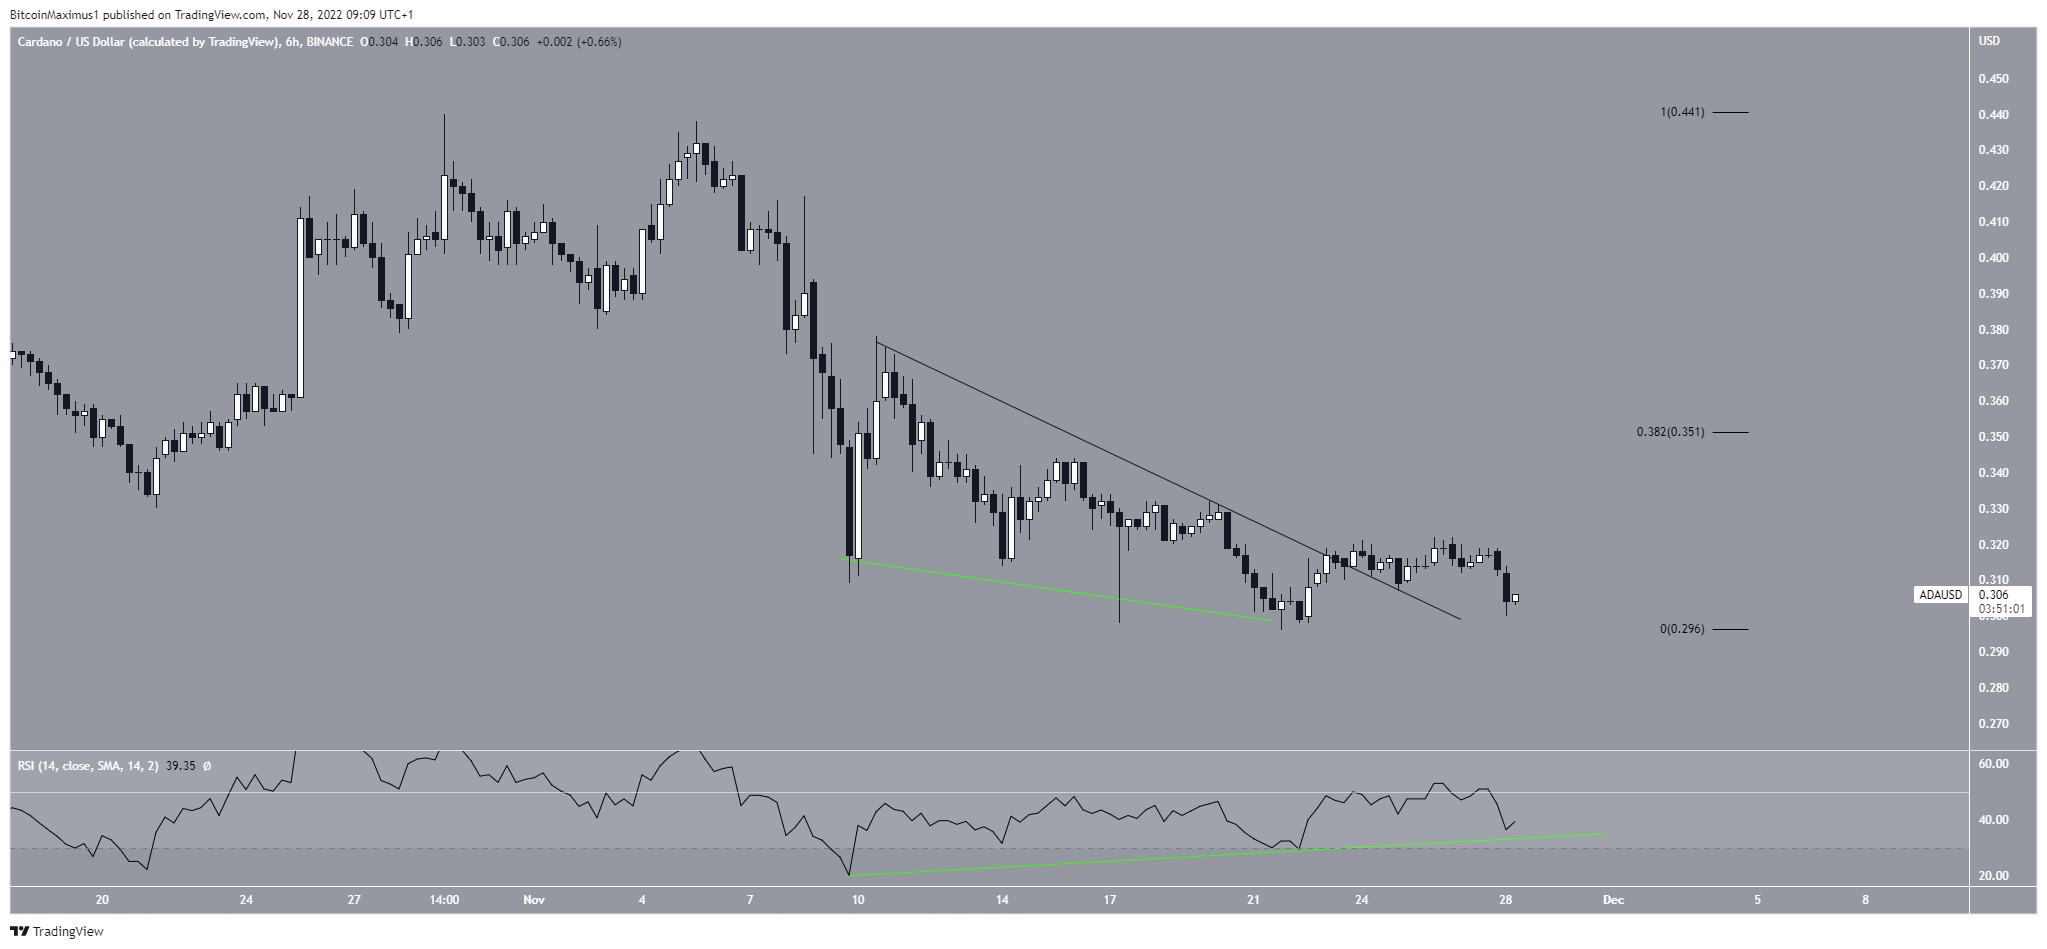
However, the six-hour time frame shows a breakout from a short-term descending resistance line.
Additionally, it shows that the bullish divergence trend line (green) is still intact. While the ADA price decreased over the next 24 hours, it could validate the line as support.
Therefore, the ADA price prediction from short-term time frames is not clear.
Cardano Wave count: Two Possibilities for Bottom
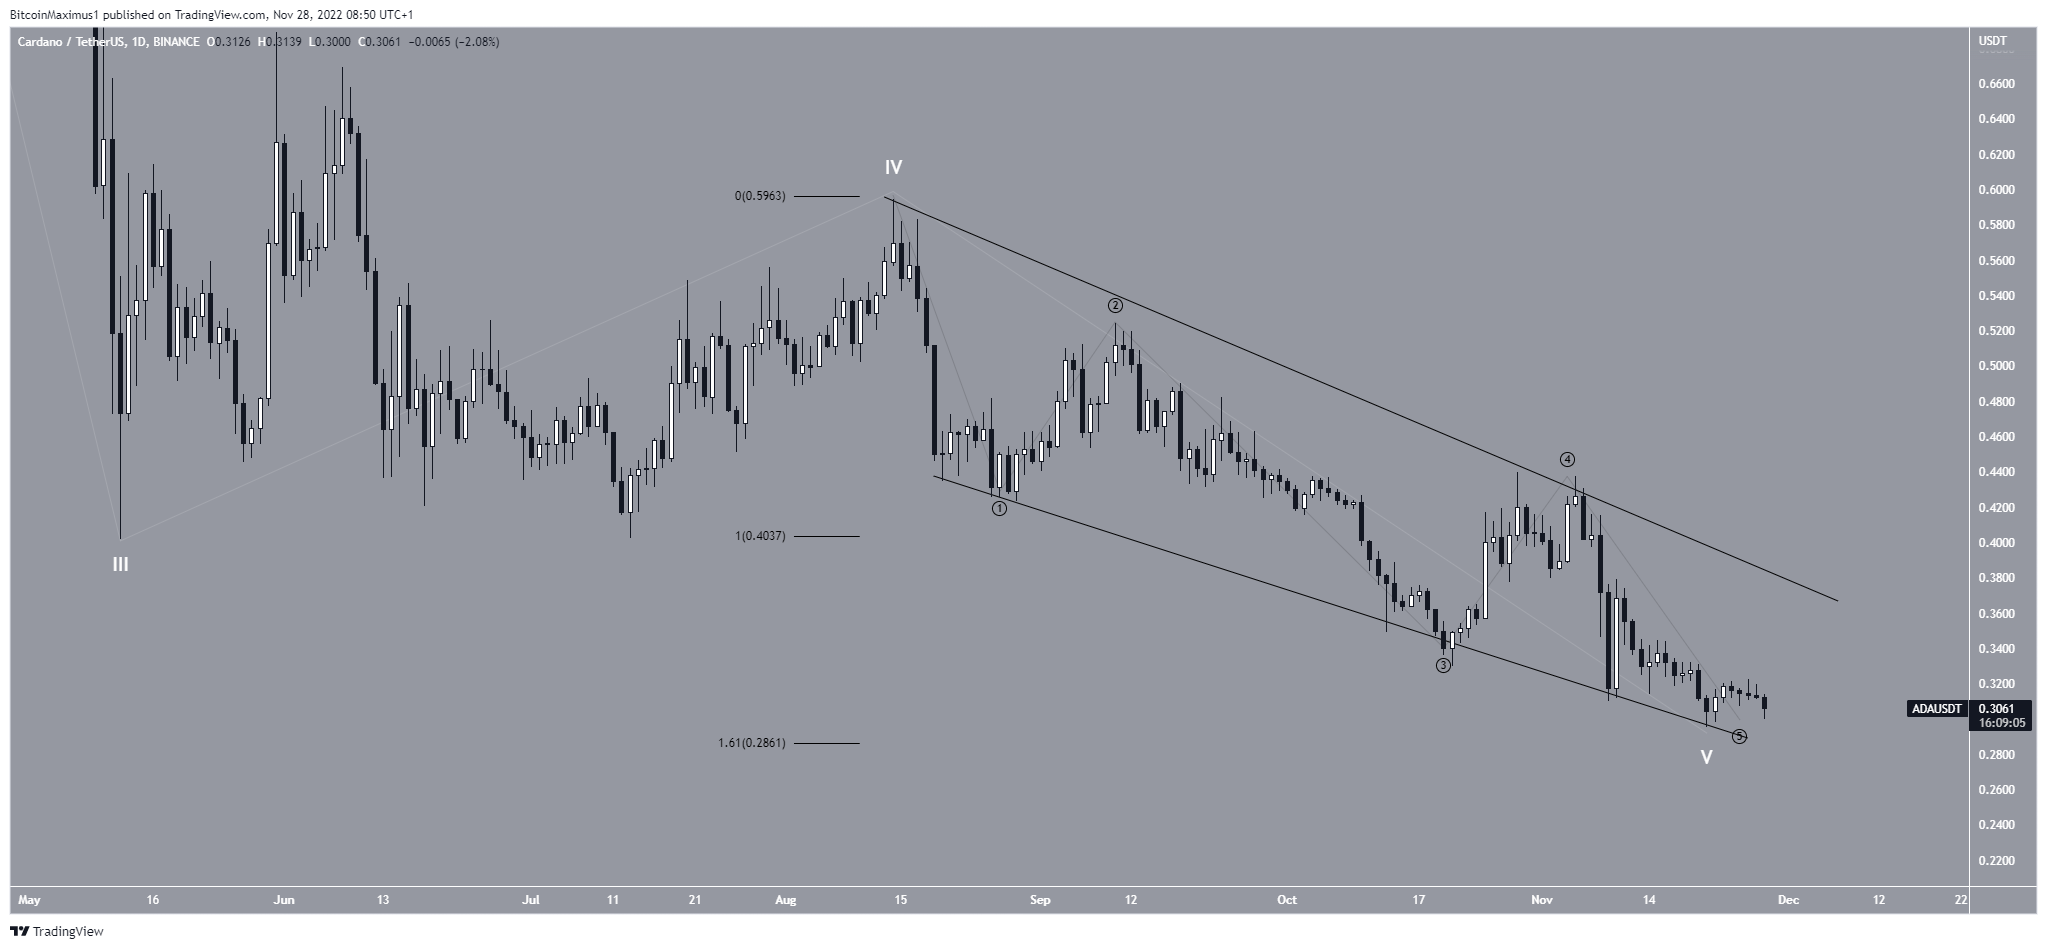
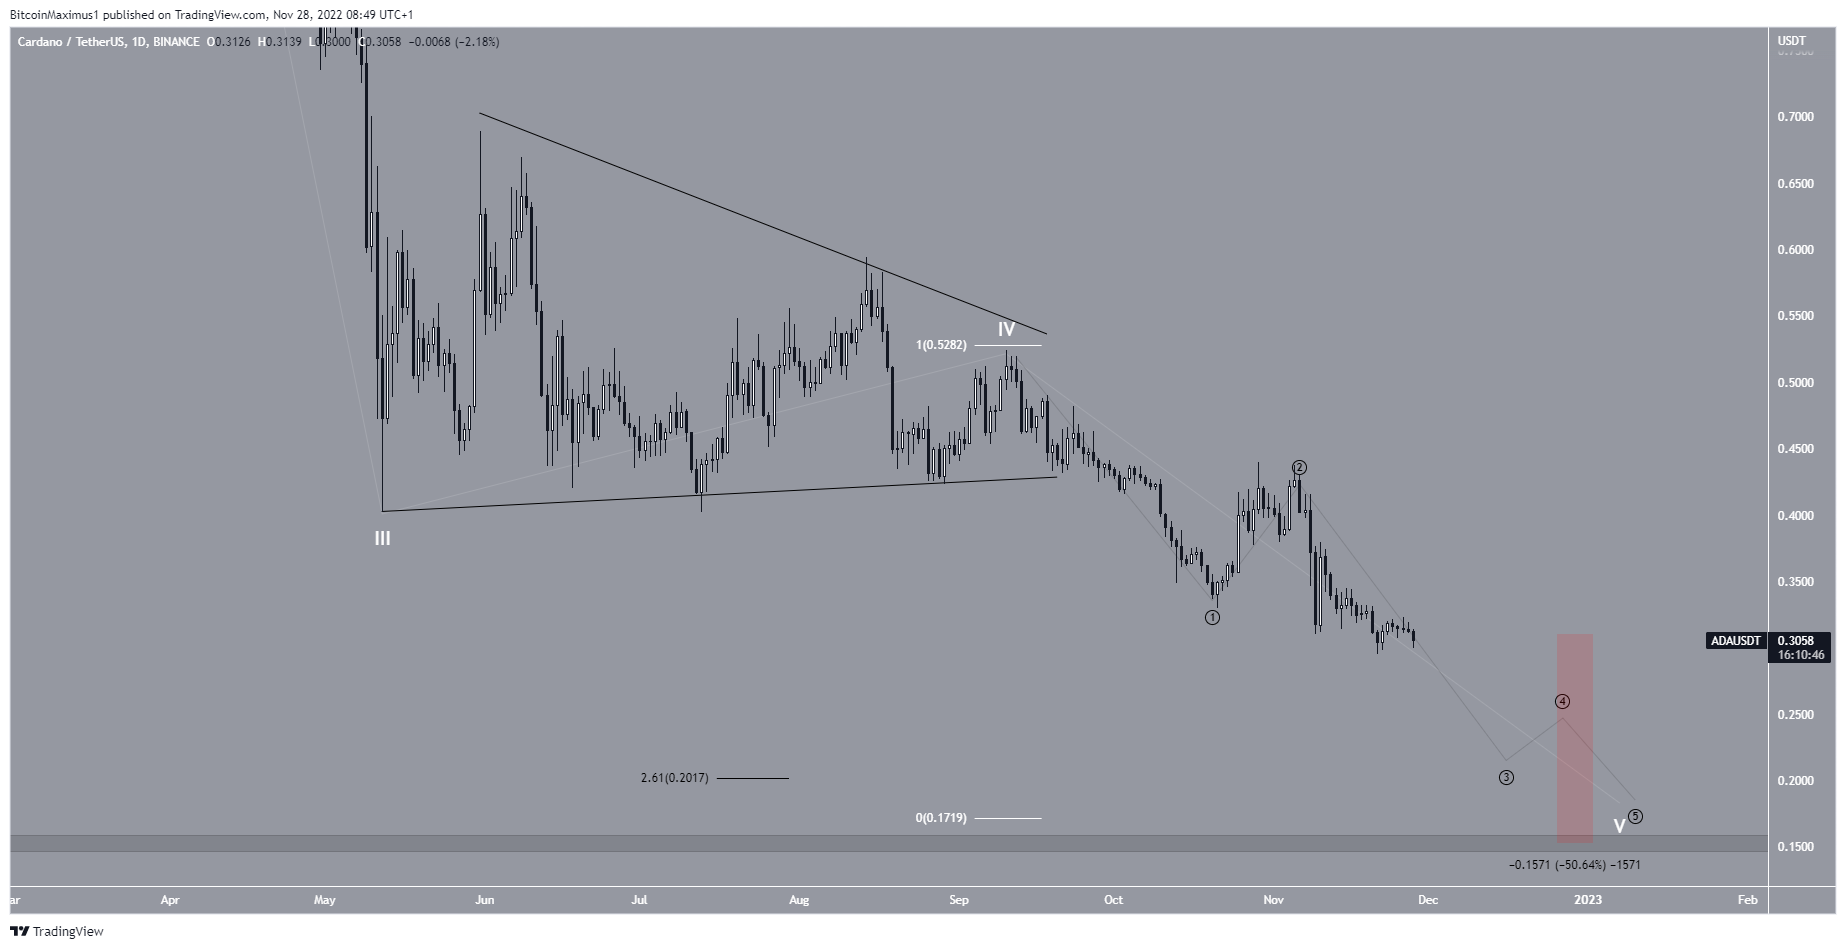
Finally, the wave count provides two possibilities for the bottom. Both suggest that the ADA price is in the fifth and final wave of a long-term downward movement (white).
The first count suggests that the ADA price is completing the fifth wave in the form of an ending diagonal. The sub-wave count is in black. It suggests that the bottom is very close.
The more bearish count indicates that the Cardano price has completed only the first portion of the decrease, and the downward movement will resume towards $0.15.
Therefore, whether the Cardano price breaks down below $0.30 or bounces will likely determine the future Cardano price forecast.
For BeInCrypto’s latest crypto market analysis, click here.
Disclaimer: BeInCrypto strives to provide accurate and up-to-date news and information, but it will not be responsible for any missing facts or inaccurate information. You comply and understand that you should use any of this information at your own risk. Cryptocurrencies are highly volatile financial assets, so research and make your own financial decisions.


