


The Cardano (ADA) price created a lower high after a rejection from the $0.36 area. A successful breakout above it could accelerate the rate of increase.
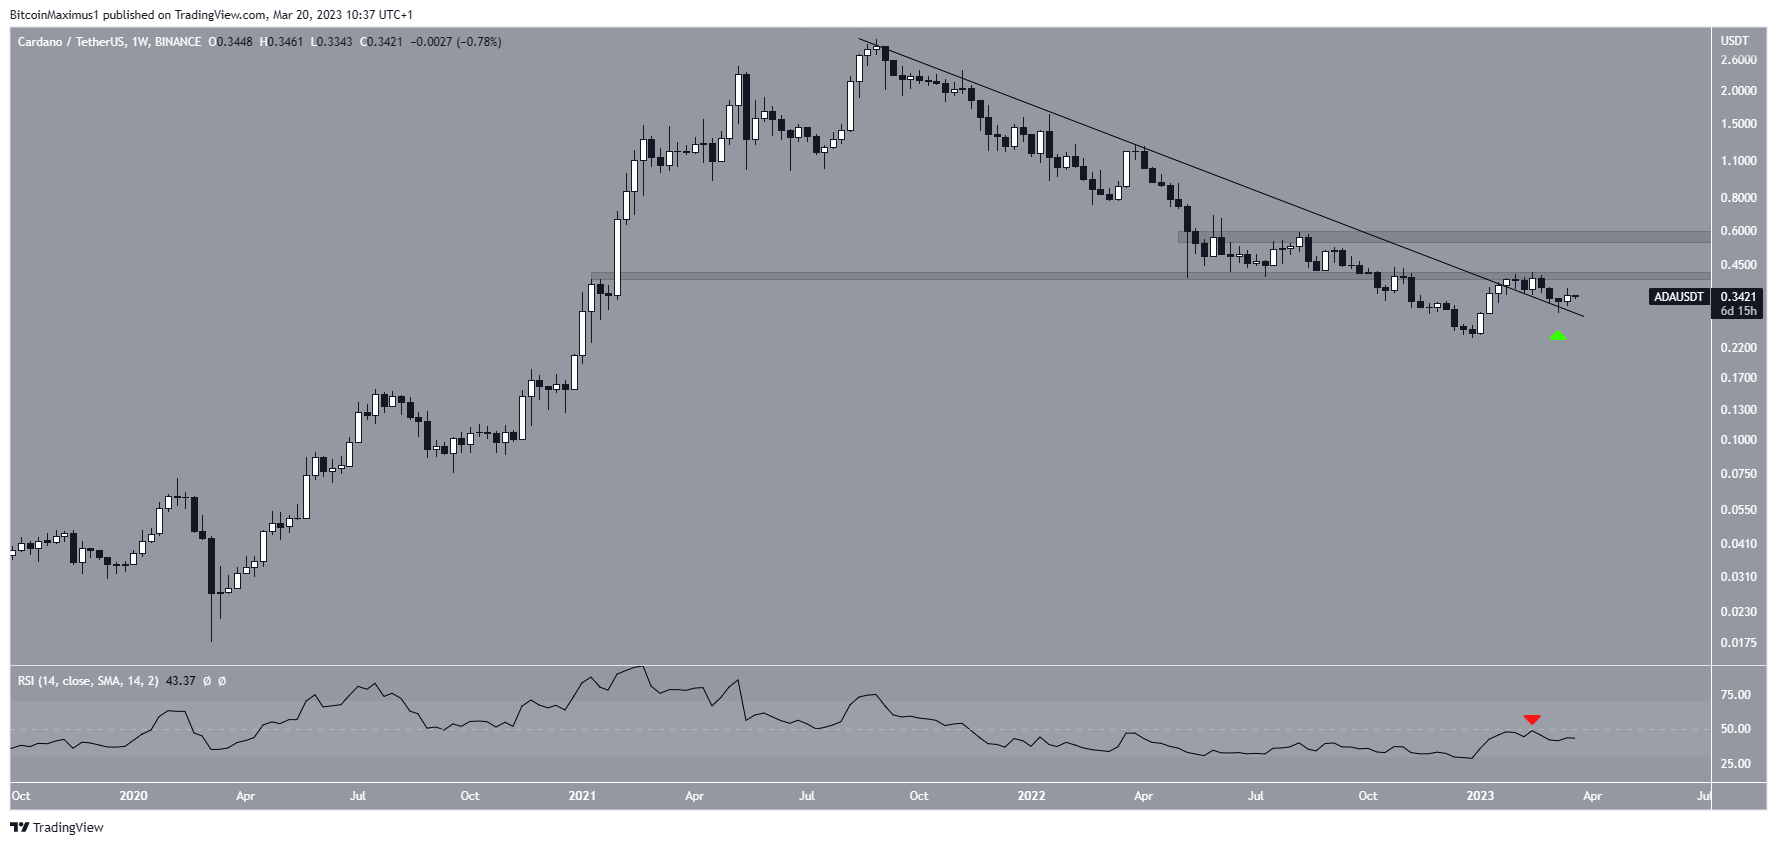
The ADA token is the native coin of the Cardano blockchain platform. The ADA price has fallen under a descending resistance line since reaching an all-time high price of $3.10 in August 2021. The decrease led to a low of $0.23 in December 2022.
The ADA price began to increase afterward and broke out from the resistance line in January 2023. While it failed to move above the $0.39 resistance area, it validated the resistance line as support (green icon).
However, the trend can only be considered bullish once the ADA price breaks out from the $0.39 area. Besides being the main horizontal resistance, the rejection from it coincided with an RSI rejection from the 50 line (red icon). As a result, a breakout above $0.39 combined with an RSI increase above 50 is required in order for the trend to be bullish. In that case, the price could increase to the next resistance at $0.59.
On the other hand, if the ADA price fall below the resistance line, a drop to $0.22 could ensue.
Cardano (ADA) Price Struggles With Short-Term Resistance
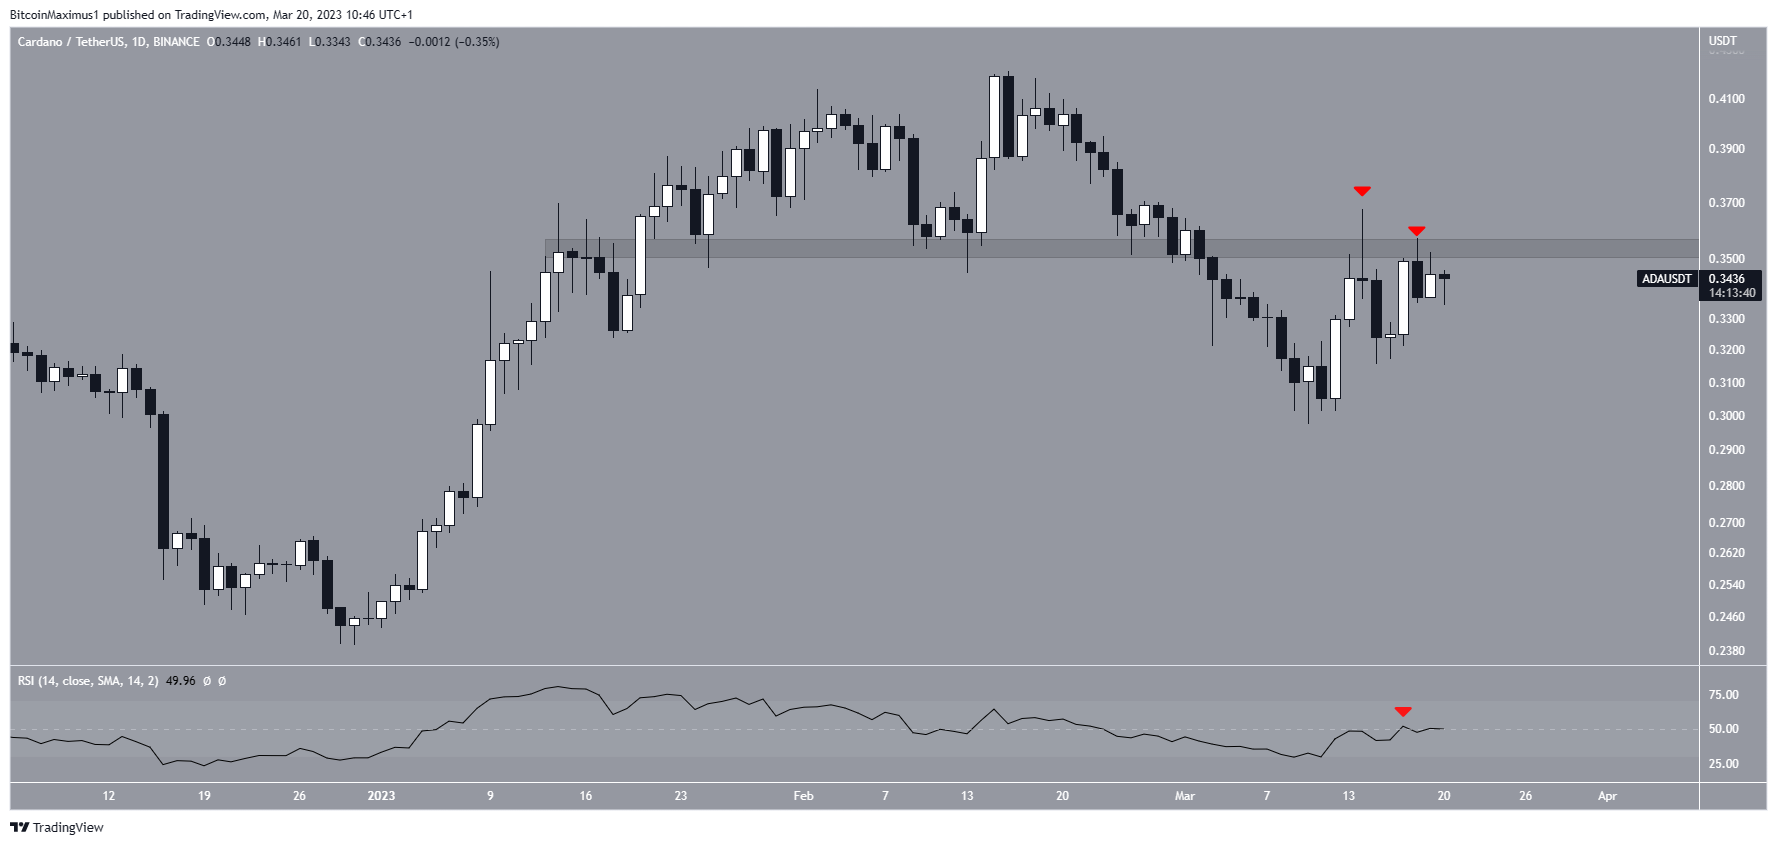
The technical analysis from the daily time frame shares several similarities with the weekly one.
In this time frame, the price was rejected by the $0.36 resistance area, creating a long upper wick and lower high (red icons). This also coincided with an RSI rejection from the 50 line.
Therefore, the price action and indicator readings are fairly neutral. In a similar fashion to the weekly time frame, whether the price breaks out or gets rejected from this area could determine the future trend.
To conclude, whether the ADA price breaks out from $0.39 or gets rejected could determine the future trend. A successful breakout could lead to an increase toward $0.59 and confirm the bullish trend reversal. On the other hand, a rejection could lead to a fall toward $0.22.


