


The Cardano (ADA) price is trading inside a corrective pattern, a breakdown from which could accelerate the rate of decrease.
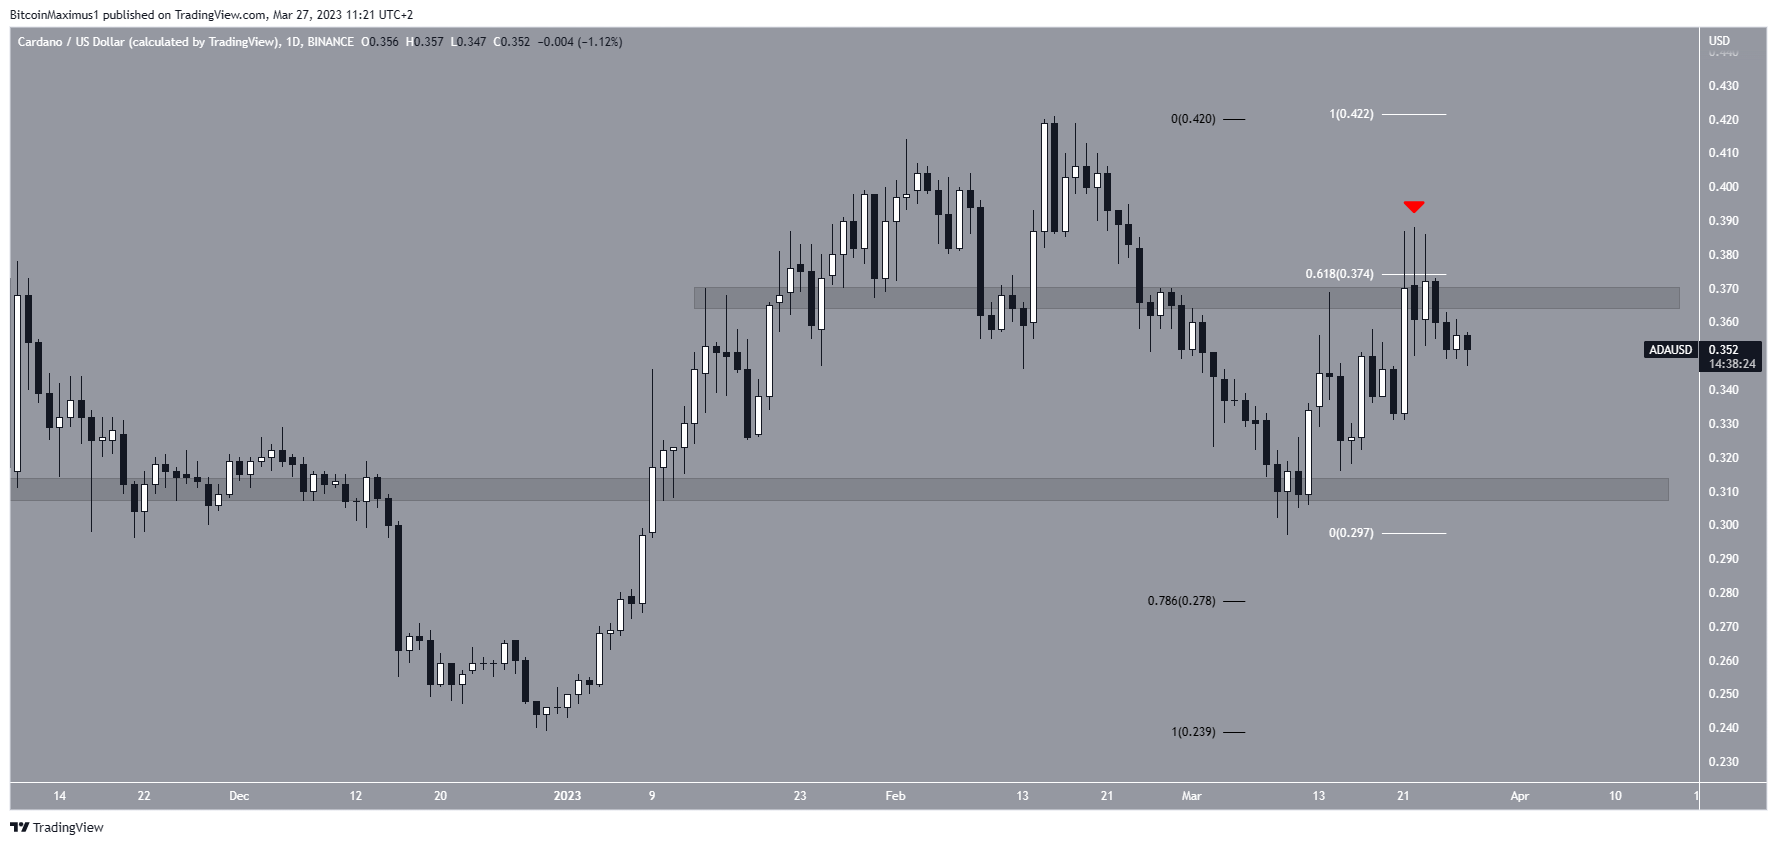
ADA is the native token of the Cardano blockchain platform. The ADA token price has fallen since reaching a yearly high of $0.421 on Feb. 16. The decrease led to a low of $0.297 on March 10.
The price bounced afterward, validating the $0.310 horizontal area as support (red icon).
However, ADA failed to break out above the 0.618 Fib retracement resistance level at $0.374 (red icon). Therefore, it is possible that the entire increase was corrective.
If that is the case, the Cardano price could fall to the $0.31 horizontal support area again and possibly break down toward the 0.786 Fib retracement support level at $0.278.
However, if ADA breaks out above $0.374, an increase toward at least $0.421 will likely follow.
Cardano (ADA) Price Bearish Pattern Could Lead to Breakdown
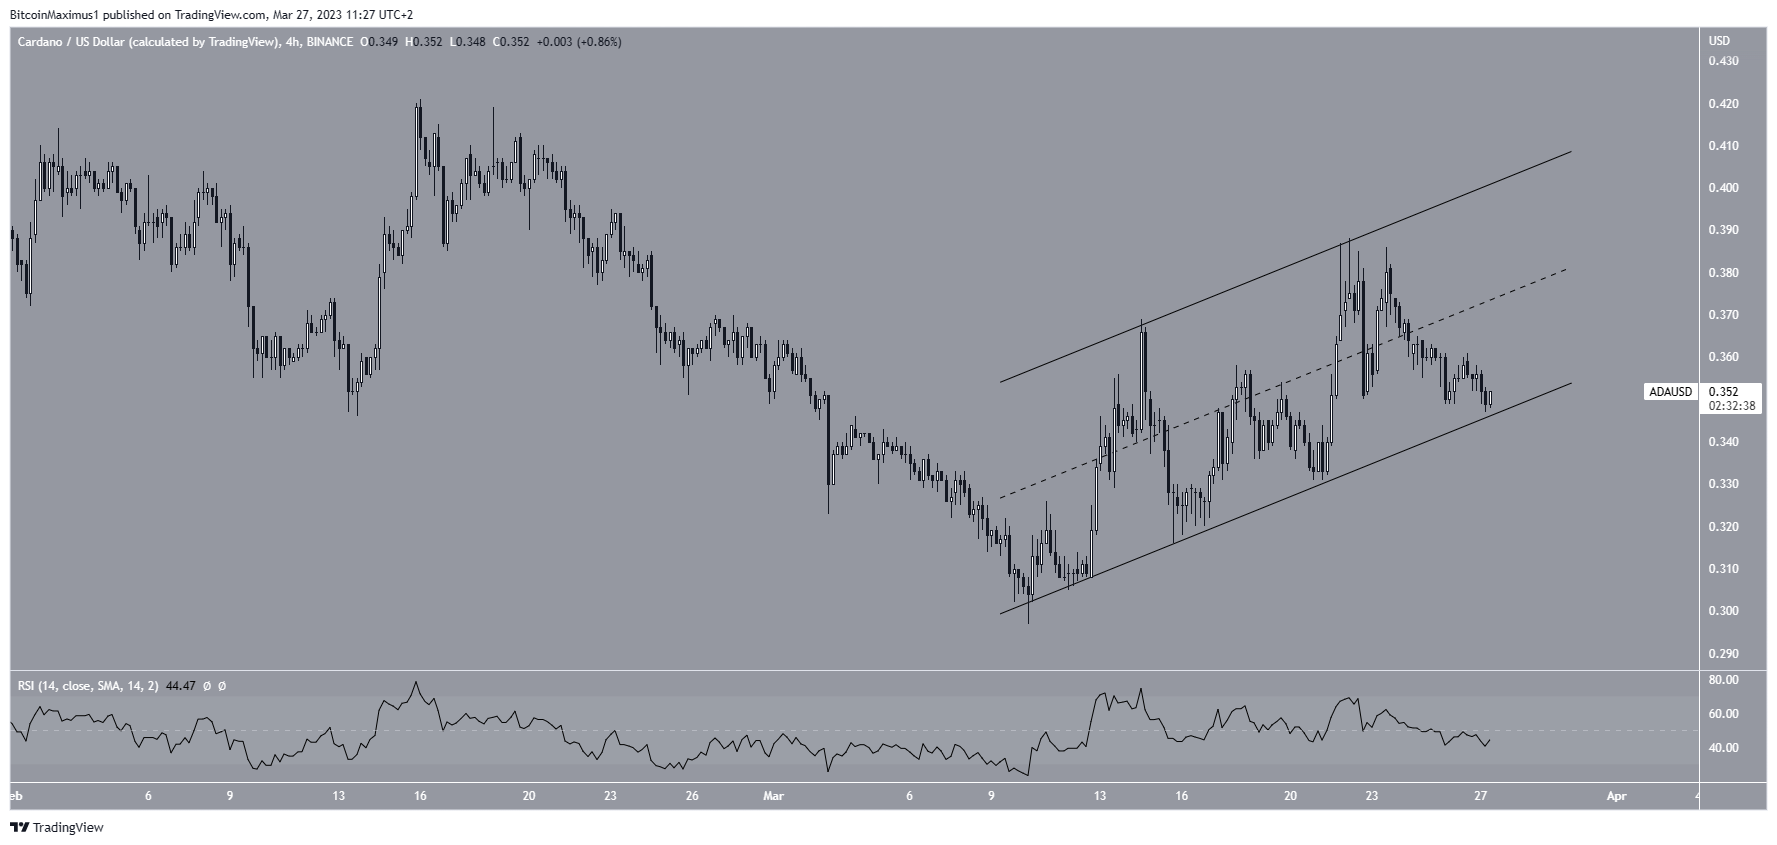
The technical analysis from the six-hour chart shows that the ADA price has traded inside an ascending parallel channel since the above-mentioned bounce. Such channels usually contain corrective patterns, meaning that a breakdown from them would be expected. This is supported by the fact that the price now trades in the lower portion of the channel, and the RSI is below 50.
Zooming out, it seems that the entire movement inside the channel is part of the B wave in an A-B-C correction.
As a result, the C wave could take the ADA price down to the 0.786 Fib retracement support level at $0.278.
On the other hand, a breakout from the channel would invalidate this bearish forecast. In that case, the ADA price could move to $0.421.
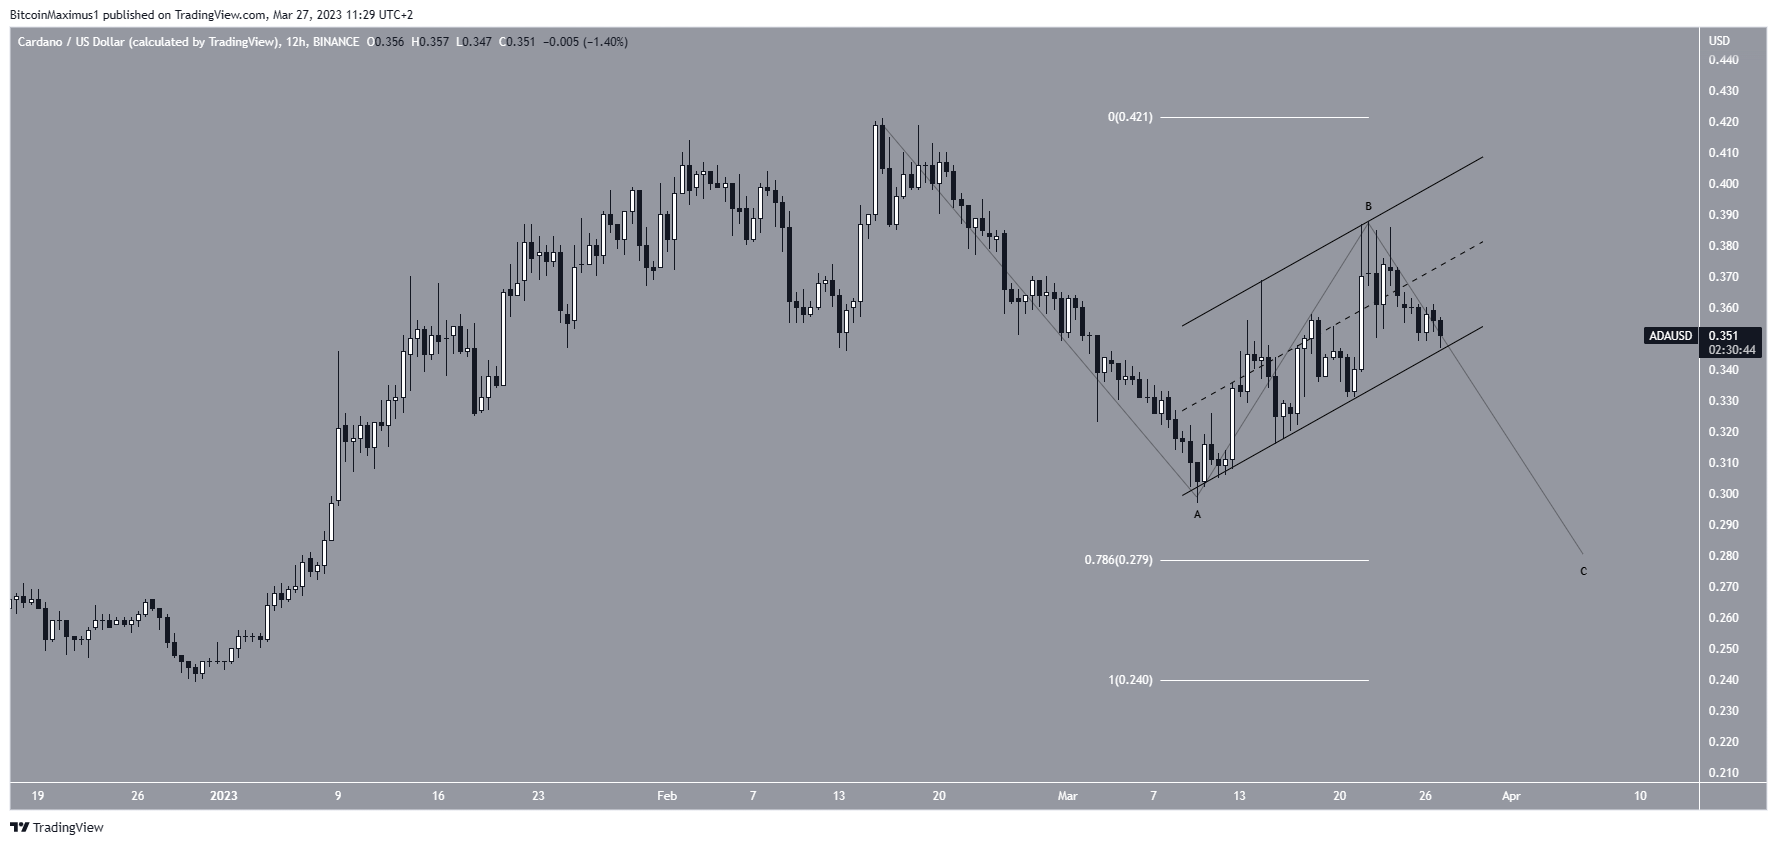
To conclude, the most likely ADA price forecast is a breakdown from the current pattern and a fall to $0.278. This would be invalidated with an increase above $0.388, something which could cause a pump to $0.421.
For BeInCrypto’s latest crypto market analysis, click here.


