
The Cardano (ADA) price broke down from a long-term horizontal support area at $0.350. The trend is considered bearish until the Cardano price reclaims the area.
ADA is the native cryptocurrency of the Cardano blockchain platform. It uses the proof-of-stake (POS) consensus mechanism and mainly deals with smart contracts and decentralized applications. Cardano was created by Charles Hoskinson.
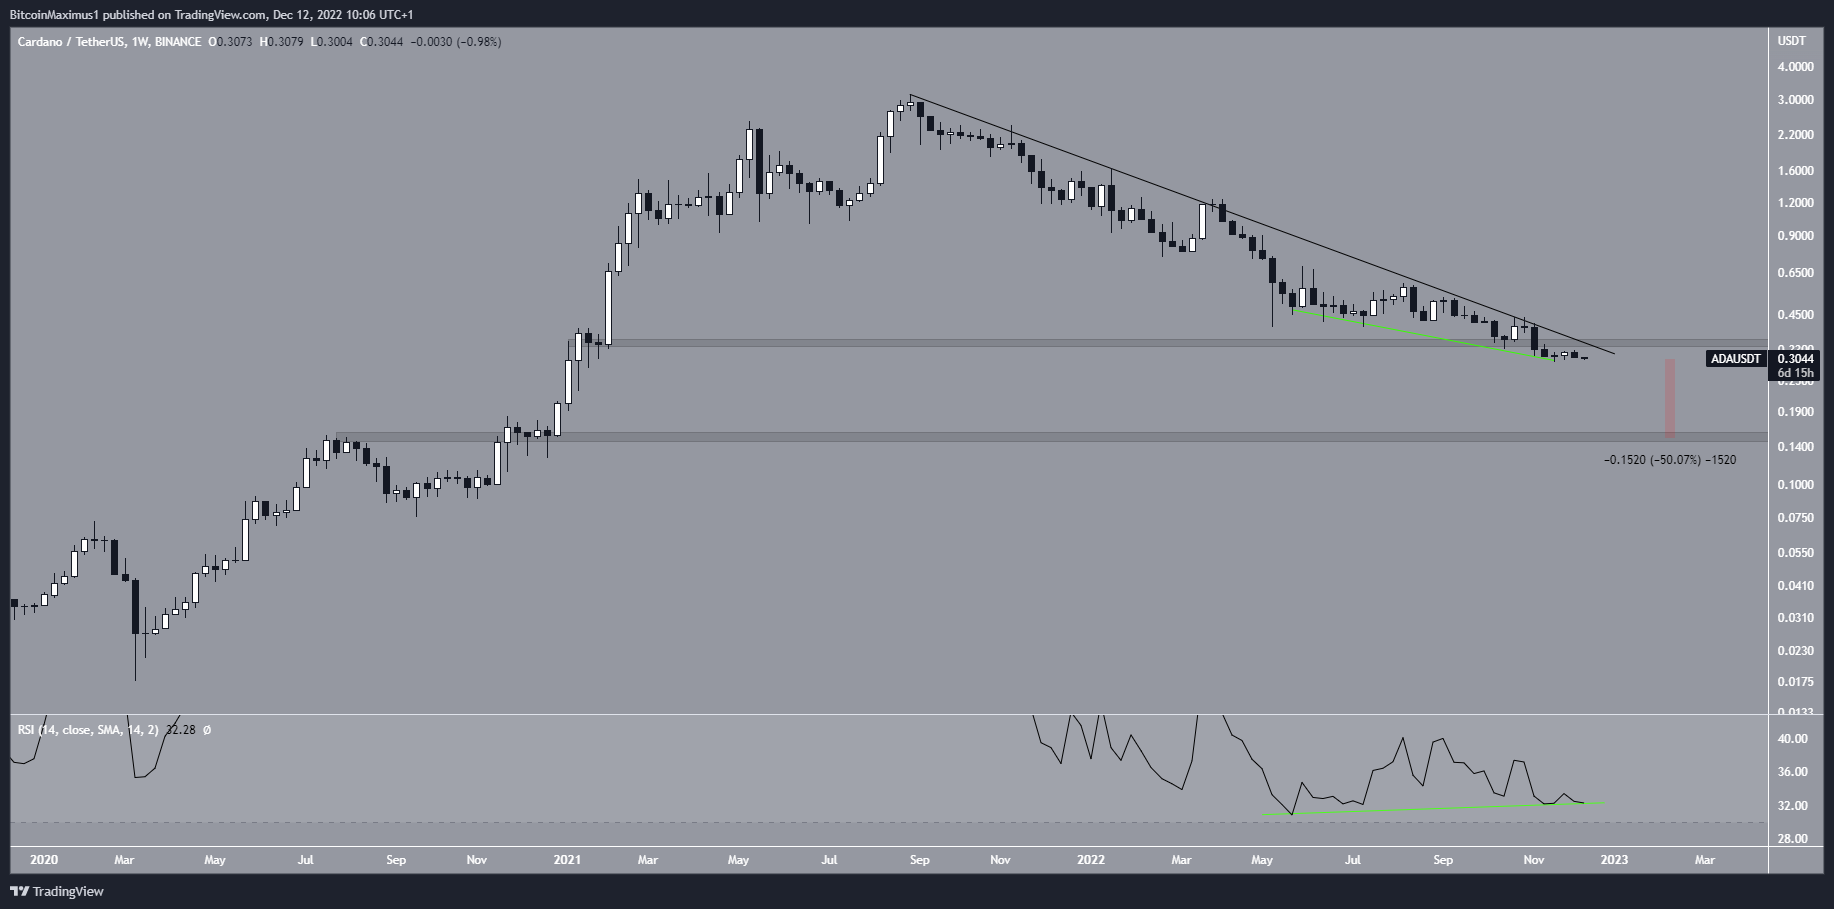
The Cardano price fell below a descending resistance line since its all-time high of $3.107 in Aug. 2021. The downward movement led to a low of $0.295 in Nov. 2021.
Besides the descending resistance line, the ADA price drop also caused a breakdown from the $0.350 horizontal support area. Since the level had been in place since 2021, a breakdown below it is a significant occurrence.
This is the final support level before $0.150, a nearly 50% drop from the current price.
The only bullish sign in place is the bullish divergence in the weekly RSI (green icon). However, that too risks being invalidated.
As a result, the most likely Cardano price forecast is a fall toward the $0.150. Reclaiming the $0.350 area would invalidate this bearish ADA price projection.
Cardano Price Still Trading in Bullish Pattern
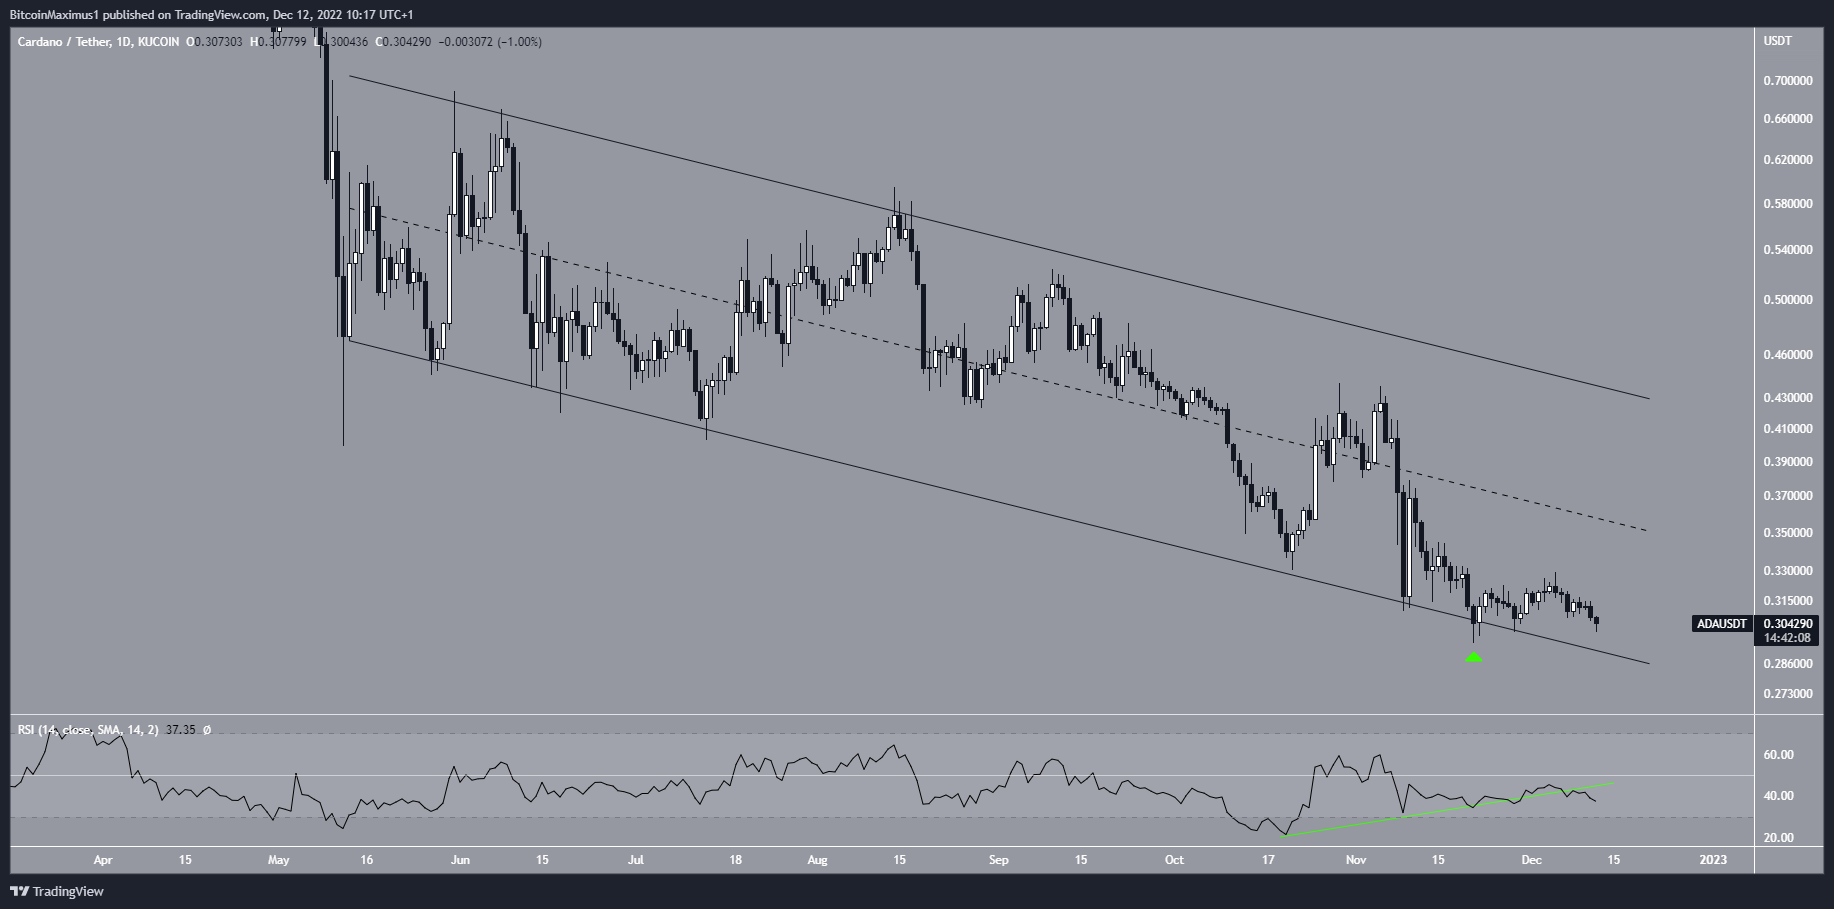
Despite the bearish outlook from the weekly time frame, the Cardano price is still trading inside a descending parallel channel in the daily one. The descending channel is considered a bullish pattern, meaning that an eventual breakout from it would be expected.
However, the presence of the channel is the only bullish sign. Moreover, the price action inside it is bearish.
Firstly, the ADA price is trading very close to the channel’s support line. It has been in its lower portion since the beginning of Nov.
Secondly, the daily RSI has broken down from its bullish divergence trend line (green). This is a sign that the bounce will not be sustained.
As a result, a breakdown seems to be the most likely scenario.
A reclaim of the middle of the channel would invalidate this bearish Cardano price projection.
For BeInCrypto’s latest crypto market analysis, click here.
