
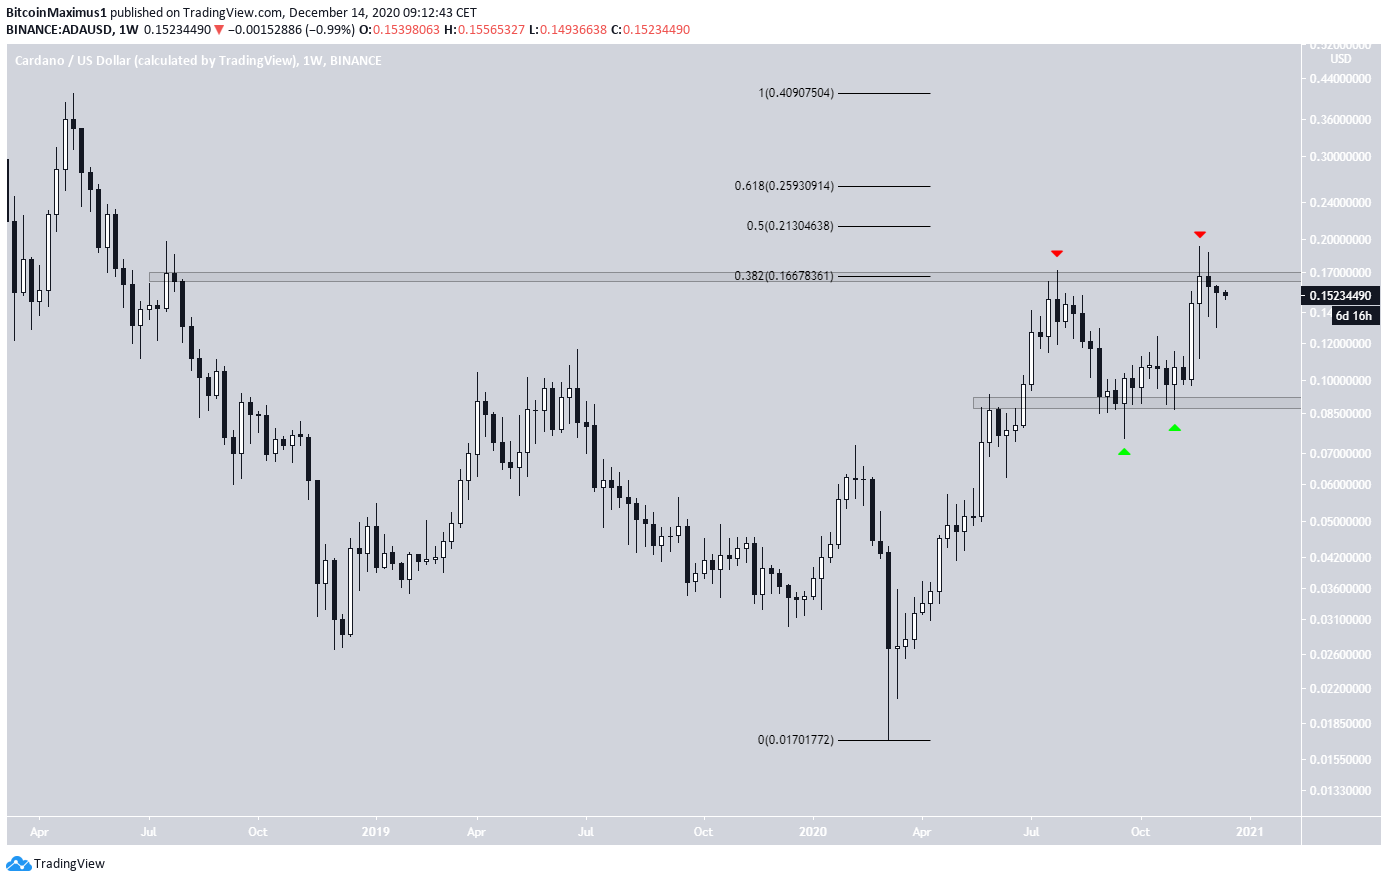
The Cardano (ADA) price has been rejected by a long-term resistance level at $0.17. It has not reached a long-term close above this resistance since June 2018.
As long as Cardano is trading inside this bullish structure, it is expected to break out and eventually be successful in finally moving above this resistance zone.
Long-Term Cardano Levels
The ADA price has been increasing since March.
It moved above the $0.095 resistance area in June, reaching a high of $0.171 before dropping in order to validate the $0.095 area as support (shown with the green arrows below).
ADA began another upward move after and is currently trading just below the $0.017 area once again (red arrows). A breakout above this level would provide a relatively resistance-free path to $0.41, with the only resistances being the 0.5 and 0.618 Fib retracement levels at $0.21 and $0.26 respectively.
However, technical indicators provide a mixed outlook. The RSI has generated a bearish divergence and is falling below the overbought territory. Similarly, the Stochastic oscillator has made a bearish cross. On the other hand, the MACD is moving upwards and is above 0 — a bullish sign.
Therefore, a closer look at lower time-frames is required in order to determine what direction ADA will likely be heading next.
Channel Breakout
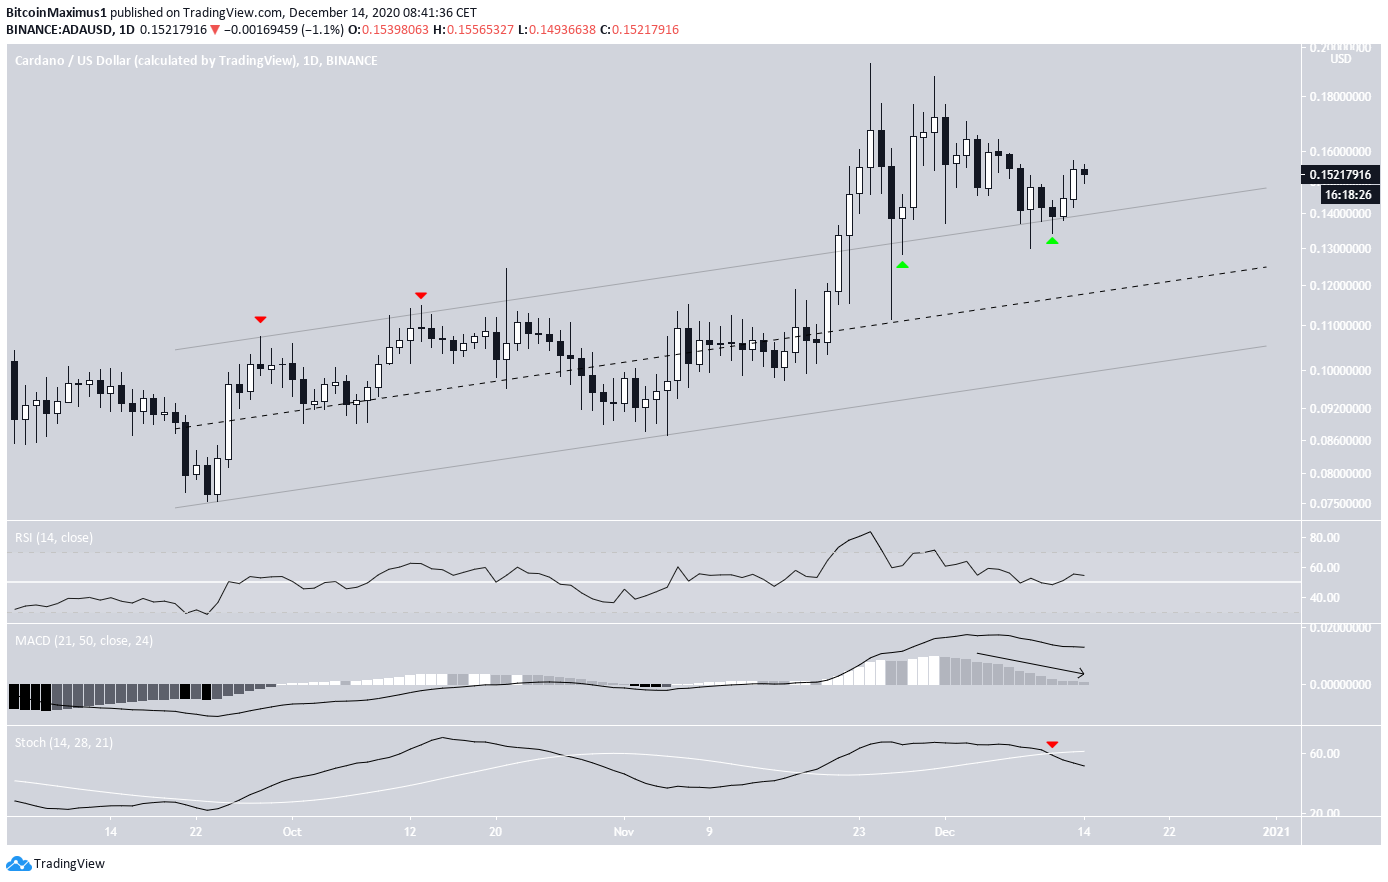
A look at the daily time-frame shows that ADA began trading inside a parallel channel on Sept. 22. It finally broke out from this channel on Nov. 21 and validated it as support afterward (green arrows). This is likely the beginning of an impulsive movement.
As long as ADA is trading above this channel, it is expected to continue moving upwards, possibly towards the resistance level outlined in the previous section.
However, technical indicators are still undecided. The RSI is bullish, the MACD is neutral, and the Stochastic oscillator is bearish.
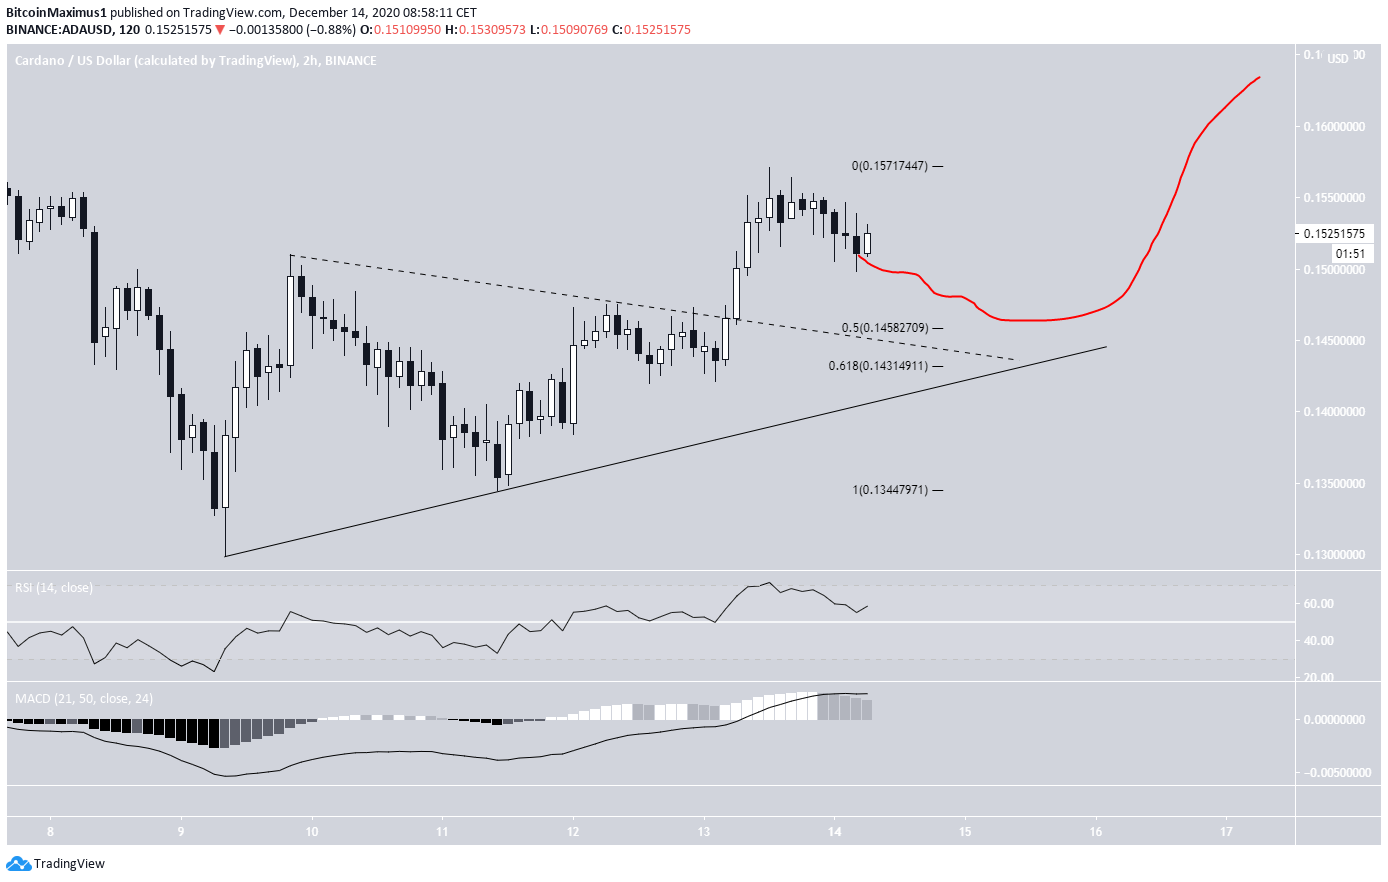
The short-term chart shows the possible creation of a bullish structure since ADA is following an ascending support line (solid) and has broken out from a descending resistance line (dashed).
While a short-term decrease to validate these lines could transpire, ADA is expected to continue moving upwards.
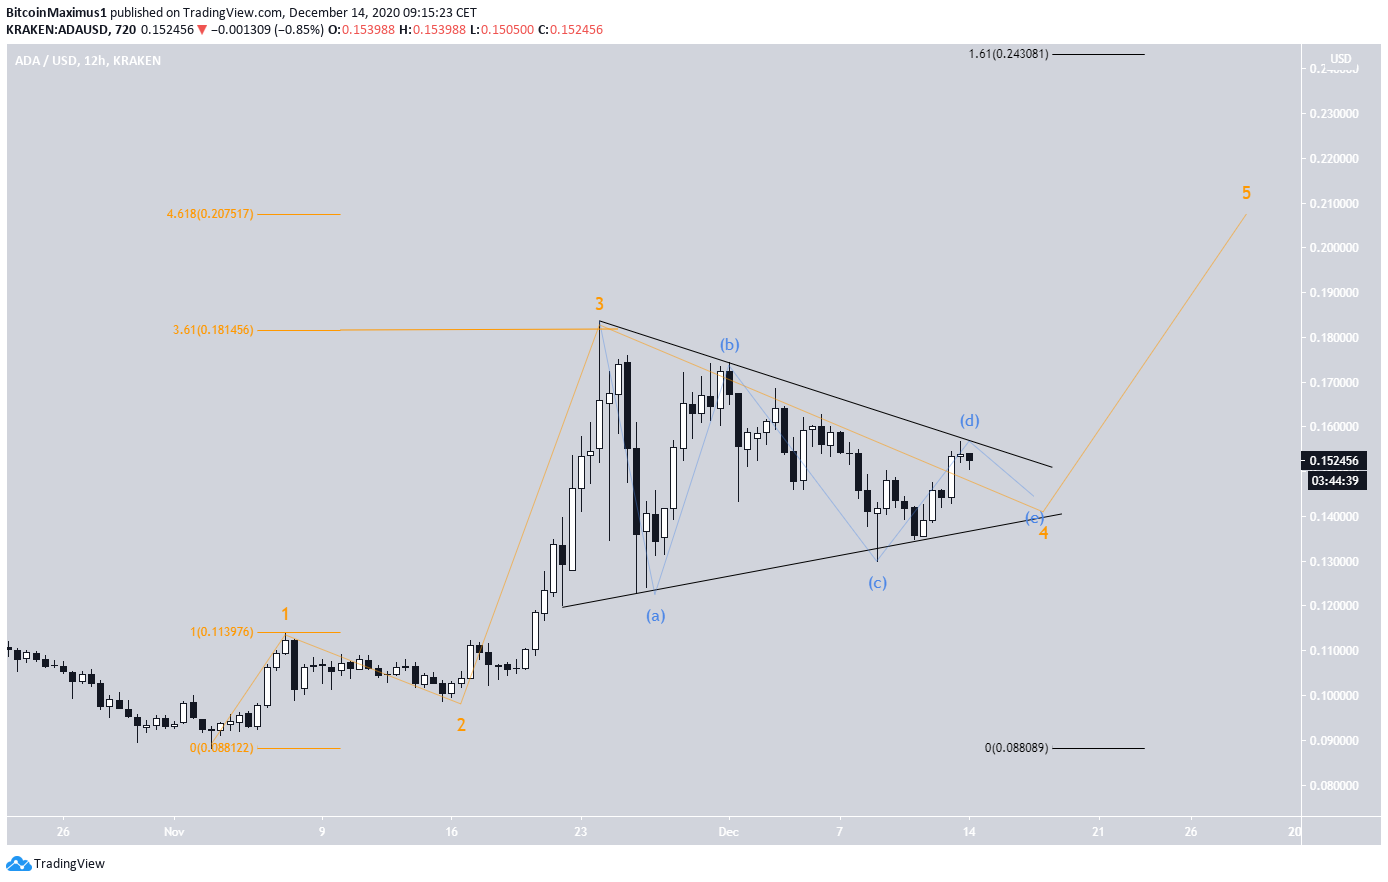
Cardano Wave Count
Cryptocurrency trader @Thetradinghubb stated that ADA is likely trading inside a long-term fourth wave triangle.
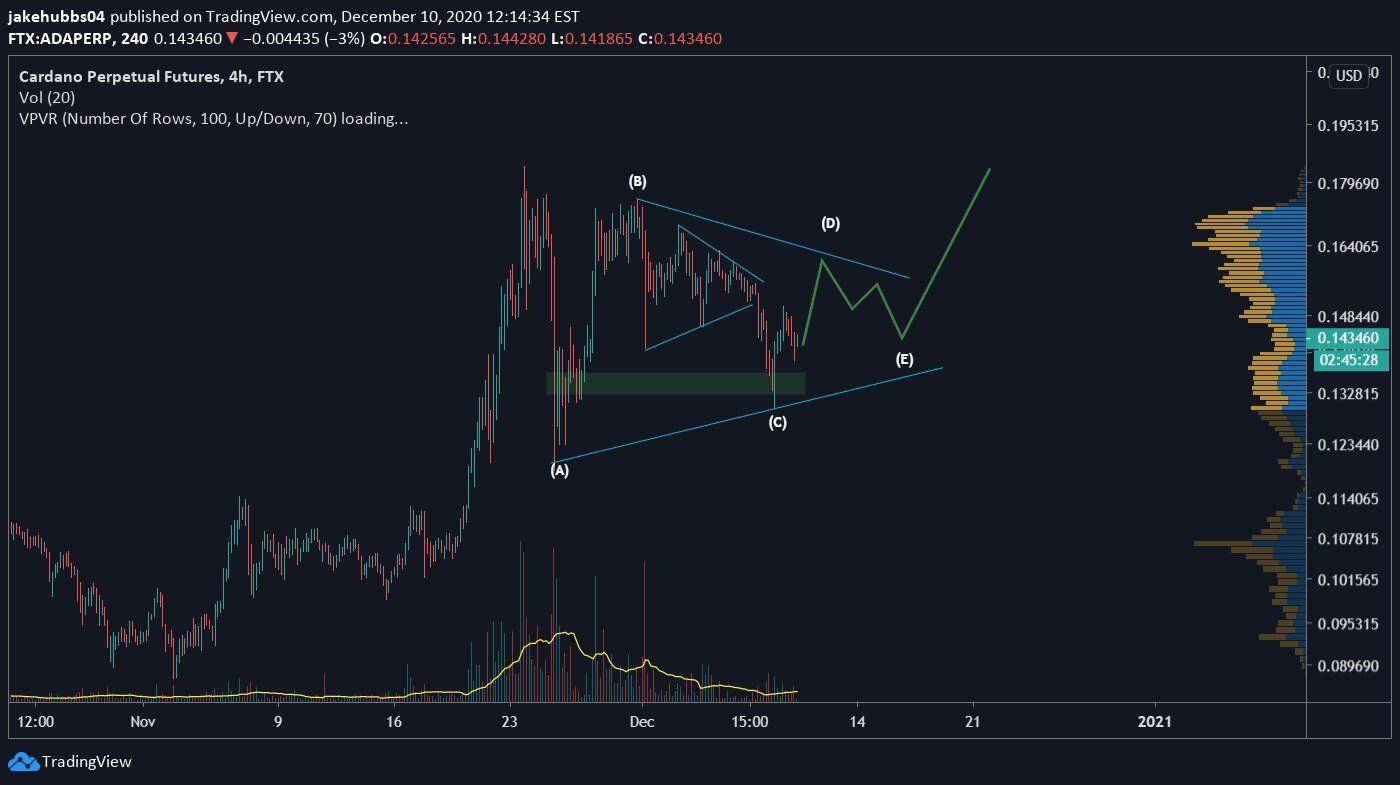
The possibility that ADA is in its fourth wave (shown in orange below) fits with the wave count outlined in our previous analysis. The sub-wave count for the fourth wave triangle is given in blue.
The third wave ended at the 3.61 Fib extension of wave 1, and a possible target for the top of wave 5 is found at $0.208 (the 4.61 Fib extension of wave 1). This target also coincides with the long-term resistance level at $0.21 outlined in the first section.
The next most likely target for the top of wave 5 would be at $0.243, which is the 1.61 Fib extension of waves 1-3. A more clear-cut target should reveal itself once wave 4 ends and wave 5 begins.
A decrease below the C sub-wave low (blue) of $0.13 would invalidate this particular wave count.
Conclusion
The Cardano price is expected to break out from its symmetrical triangle and move towards the resistance levels between $0.21 and $0.25. A decrease below $0.13 would invalidate this bullish scenario.
For BeInCrypto’s latest ICX analysis, click here!
Disclaimer: Cryptocurrency trading carries a high level of risk and may not be suitable for all investors. The views expressed in this article do not reflect those of BeInCrypto.
