


The Cardano (ADA) price has just reached a new yearly high. While a short-term retracement could occur, ADA should eventually resume its upward movement towards the resistance areas outlined below.
Long-Term Breakout
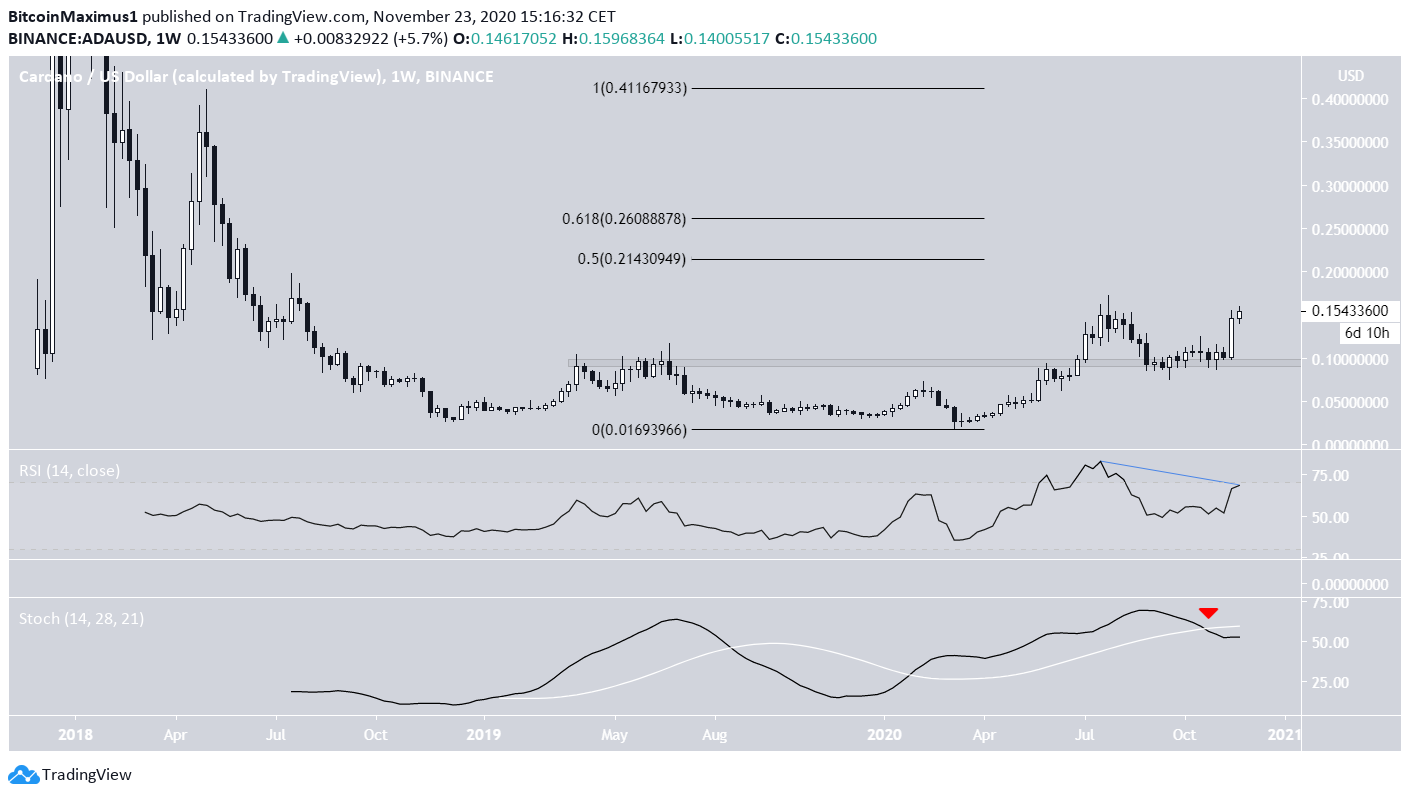
The ADA price broke out from the $0.10 resistance area at the beginning of July. The price returned to validate this level as support. After a period of consolidation, ADA created a massive bullish candlestick during the week of Nov 15-22, increasing by 45%.
The price followed that up with another slight rally today, which took it to $15.92, just above the previous yearly high at $15.46. If the price continues increasing, the next resistance areas would be between $0.214 and $0.26, the 0.5 – 0.618 Fib retracement levels from the previous decline.
Despite the rise, technical indicators show considerable weakness. There is a significant bearish divergence developing in the weekly RSI, albeit unconfirmed, while the Stochastic Oscillator has already made a bearish cross.
Cryptocurrency trader @TradingTank outlined an ADA chart, stating that the price has reached its previous highs, and will either be rejected or begin a massive pump.
Since the price has not yet been rejected and has actually moved above the high, a price rally is likely.
Future Movement
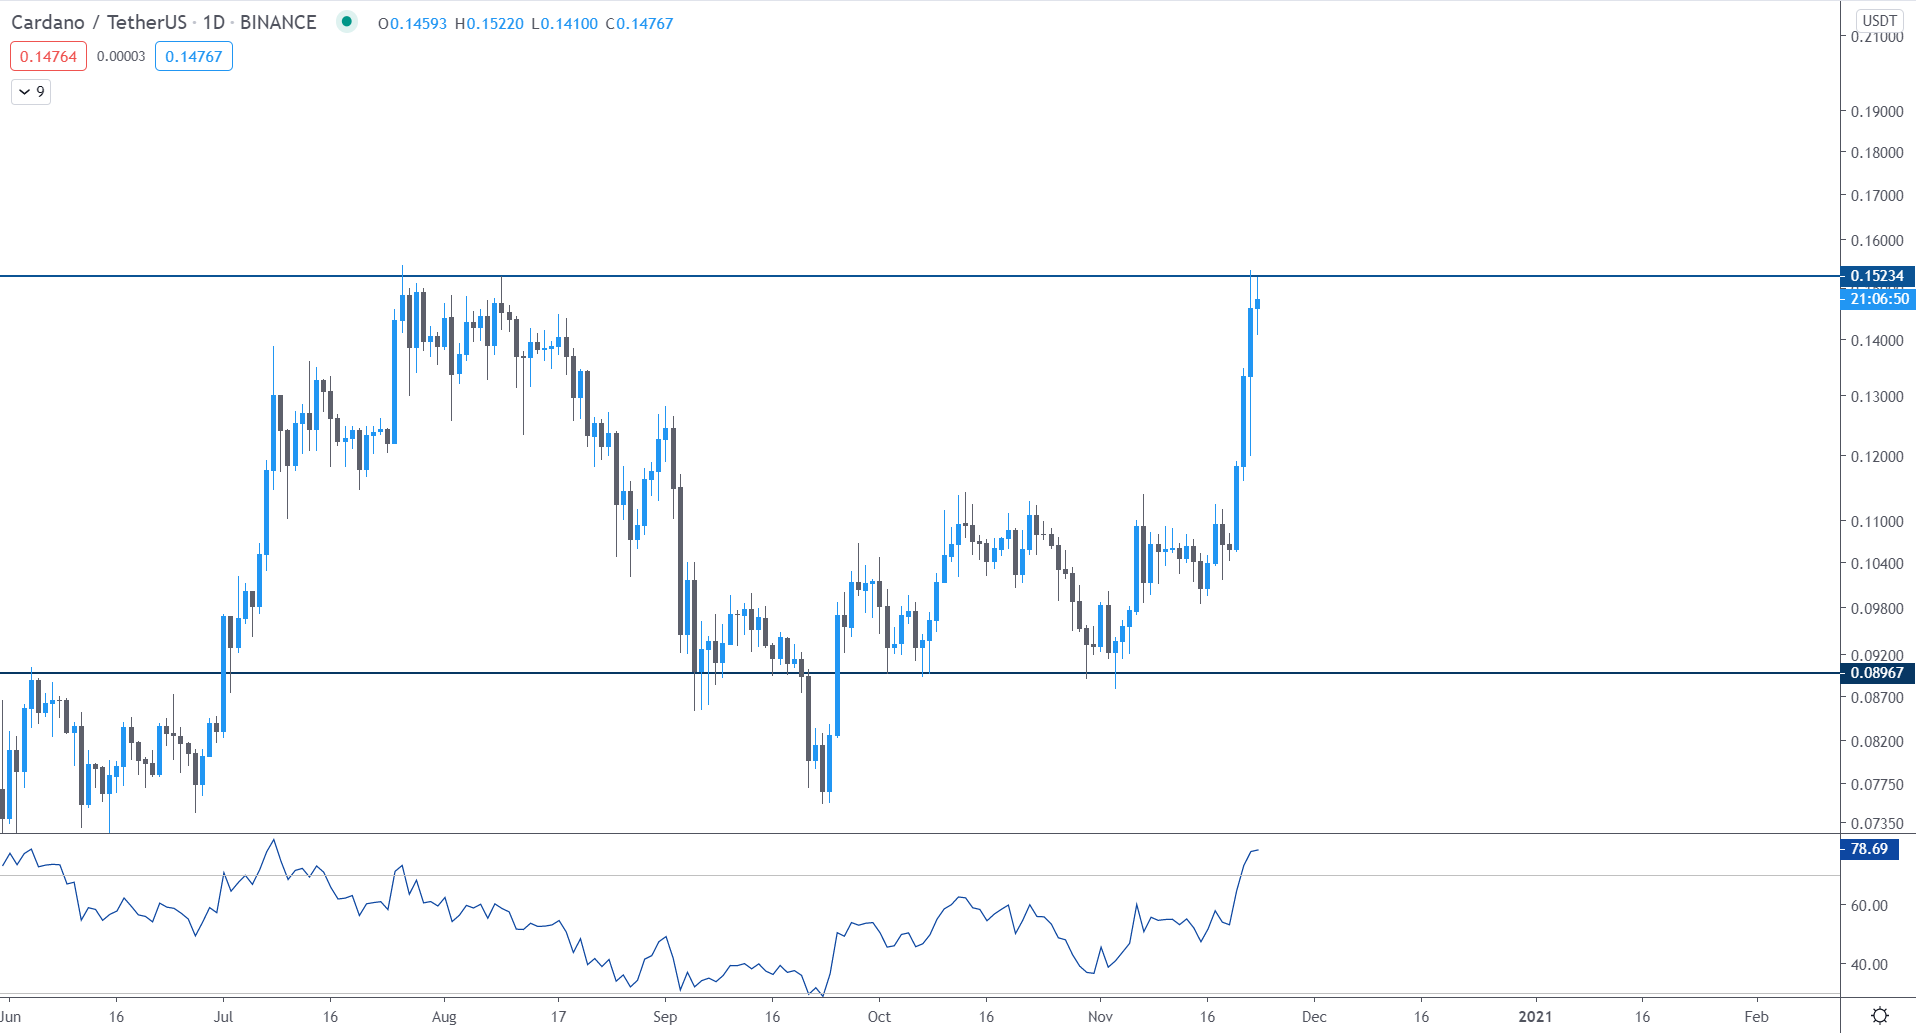
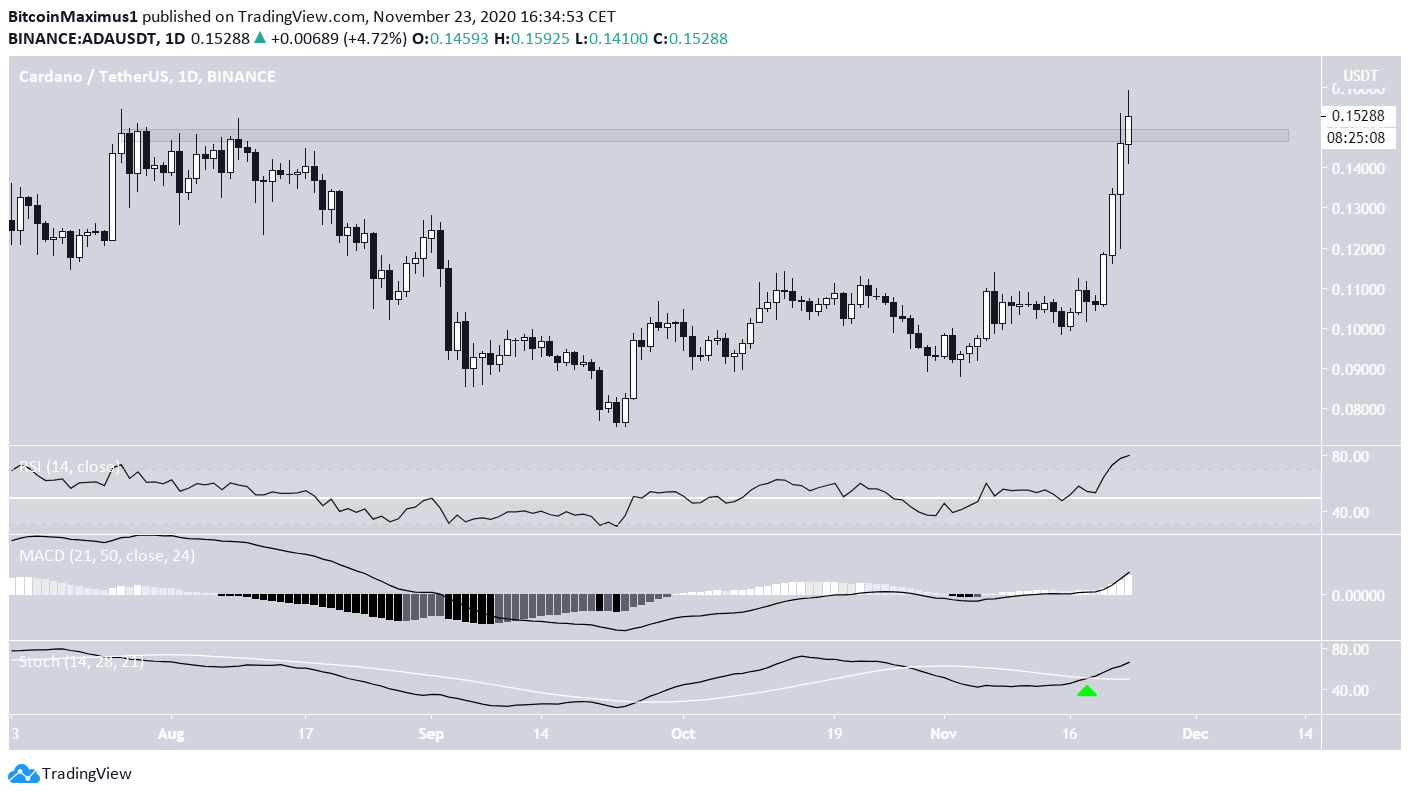
The daily chart for ADA shows that the price has just broken out from the main resistance area near $0.15, but has yet to reach a close above it.
Technical indicators are bullish, even if they show an overbought rally. All three of the: MACD, RSI, and Stochastic Oscillator are increasing and none have formed bearish divergence yet.
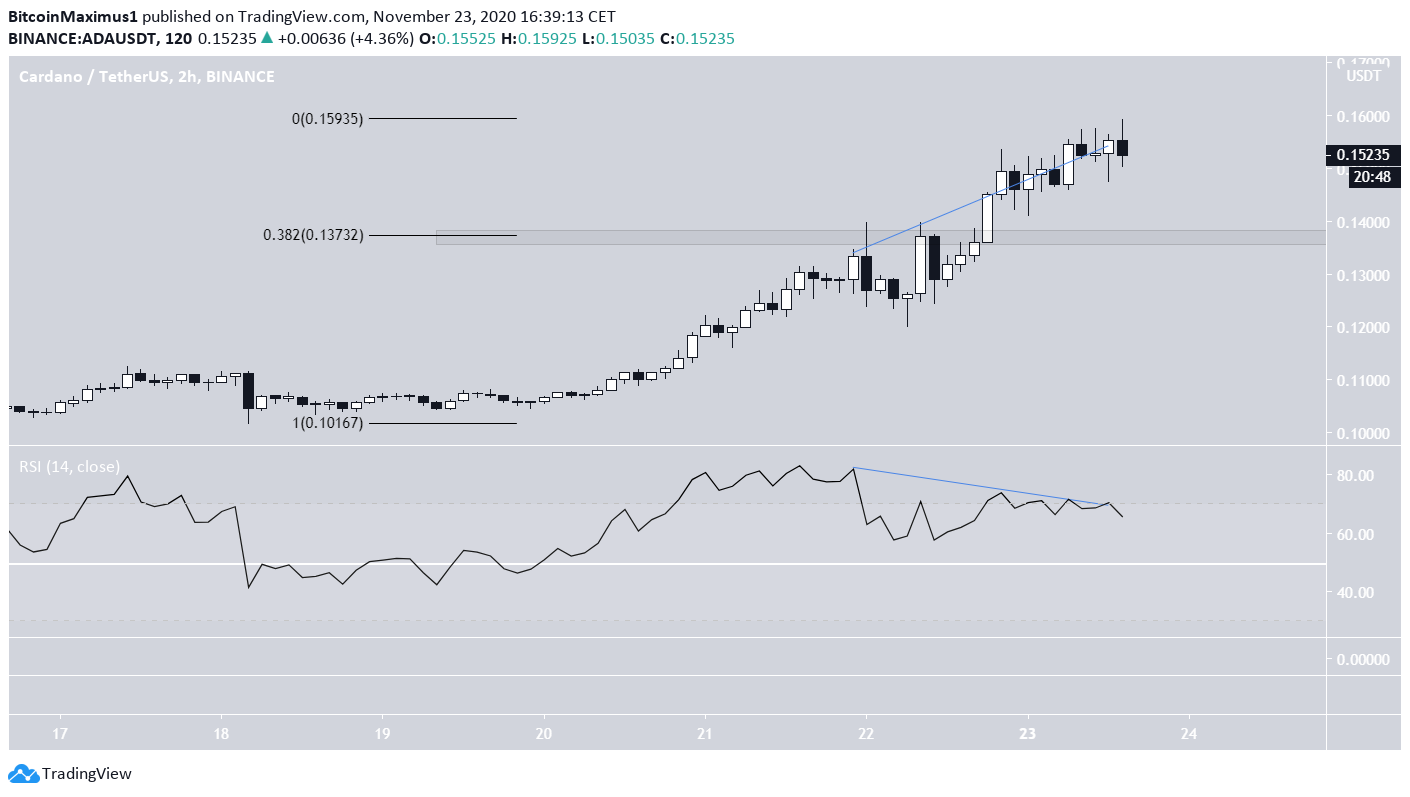
The short-term two-hour chart shows the first clear instance of weakness, in the form of a considerable bearish divergence in the RSI.
Therefore, a short-term retracement towards $0.137 could take place before the price eventually resumes its upward movement towards the resistance areas outlined in the first section.
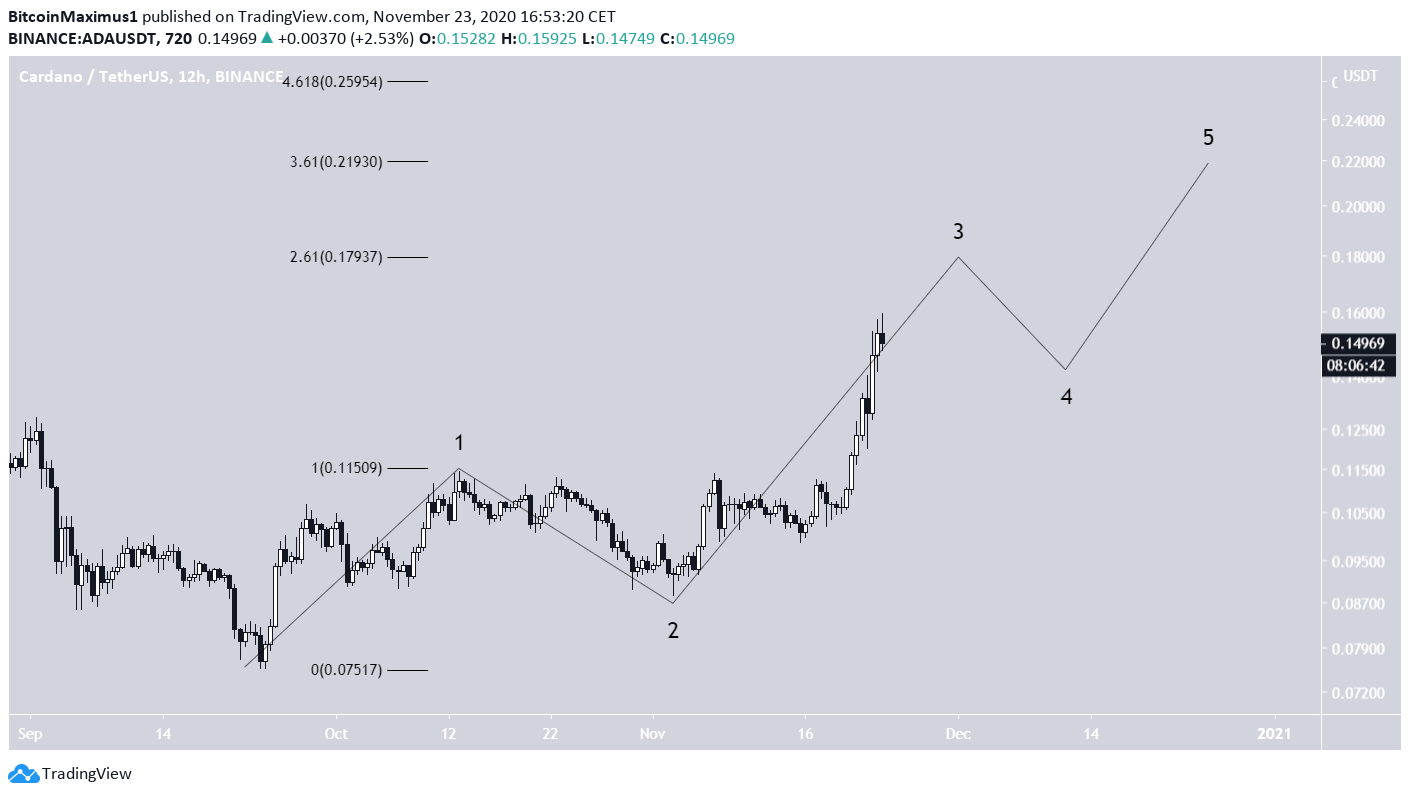
Wave Count
The wave count for ADA suggests that the price began a bullish impulse (shown in black below) on Sept 23. If accurate, the price is currently in wave 3, which is likely to end near $0.181, the 2.61 Fib extension of wave 1.
After a decline in wave 4, ADA should continue the upward move. The two most likely targets for the top of wave five are at $0.219 and $0.259, also coinciding with the Fib retracement levels from the first section.
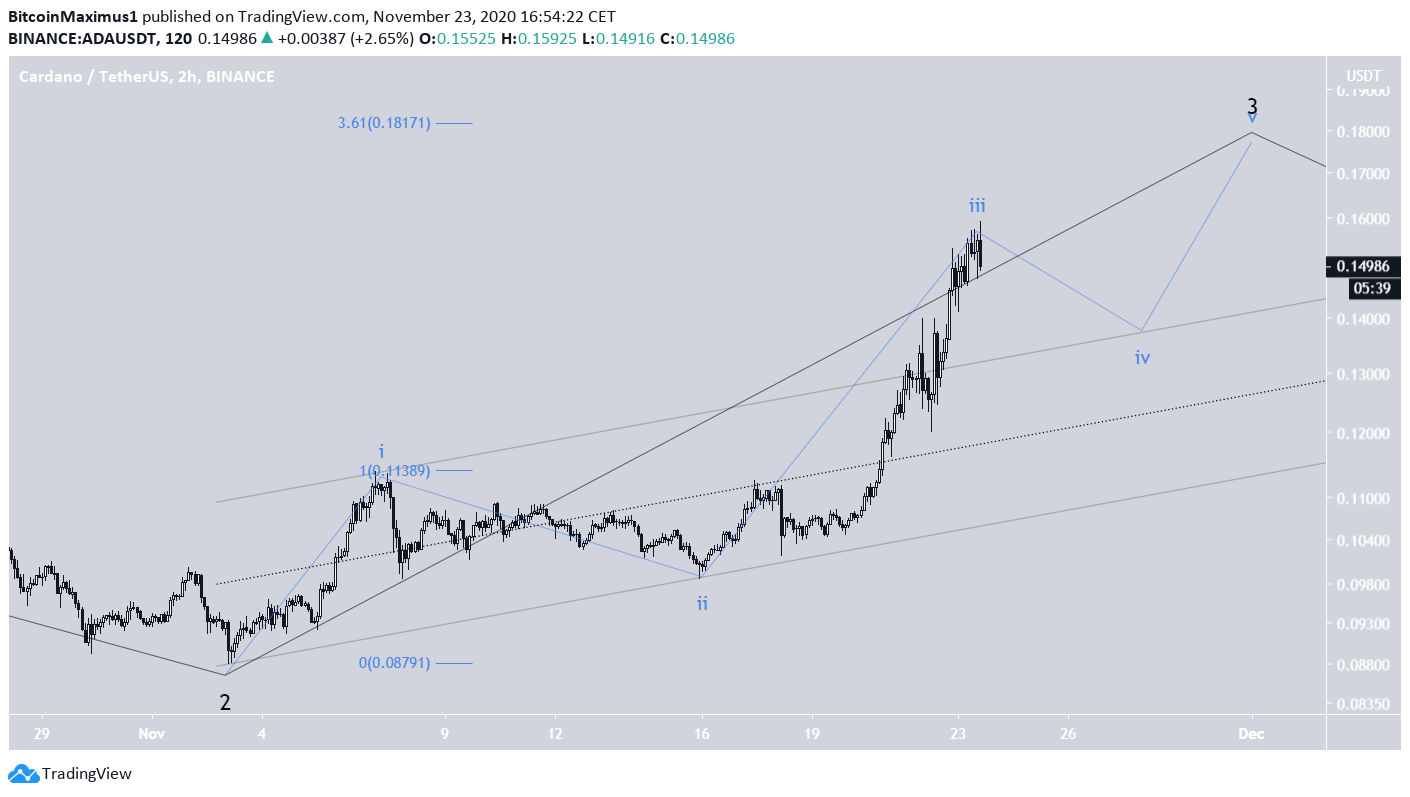
The shorter-term count (blue) suggests that the price has completed sub-wave three, and after a small corrective movement in what is known as a fourth wave pullback, ADA will complete the fifth sub-wave and the longer-term wave 3 (black).
The Fib extension for sub-wave one aligns with the previously given target, giving a high near $0.181 for the top of wave three.
Conclusion
To conclude, while a short-term decline could occur, ADA is likely to eventually resume its upward movement targeting the Fib resistance area between $0.21 and $0.26.
For BeInCrypto’s previous Bitcoin analysis, click here!
Disclaimer: Cryptocurrency trading carries a high level of risk and may not be suitable for all investors. The views expressed in this article do not reflect those of BeInCrypto


