
According to the recently published Capitulation Confluence Model, the current phase of the Bitcoin market is similar to the ends of all 3 historical bear markets. If this is true, BTC may soon start a new bull run. Moreover, this remains partially consistent with readings from the on-chain indicator: Realized Price.
Plan C is a cryptocurrency market analyst who is known for publishing cutting-edge models that combine multiple technical and on-chain analysis indicators. Back in May, BeInCrypto wrote about his Confluence Floor Model, which was supposed to indicate the price below which the BTC price would not fall. Unfortunately, just a month later, it turned out that the model had failed, and the largest cryptocurrency fell far below what was supposed to be the “floor.”
Capitulation Confluence Model readings
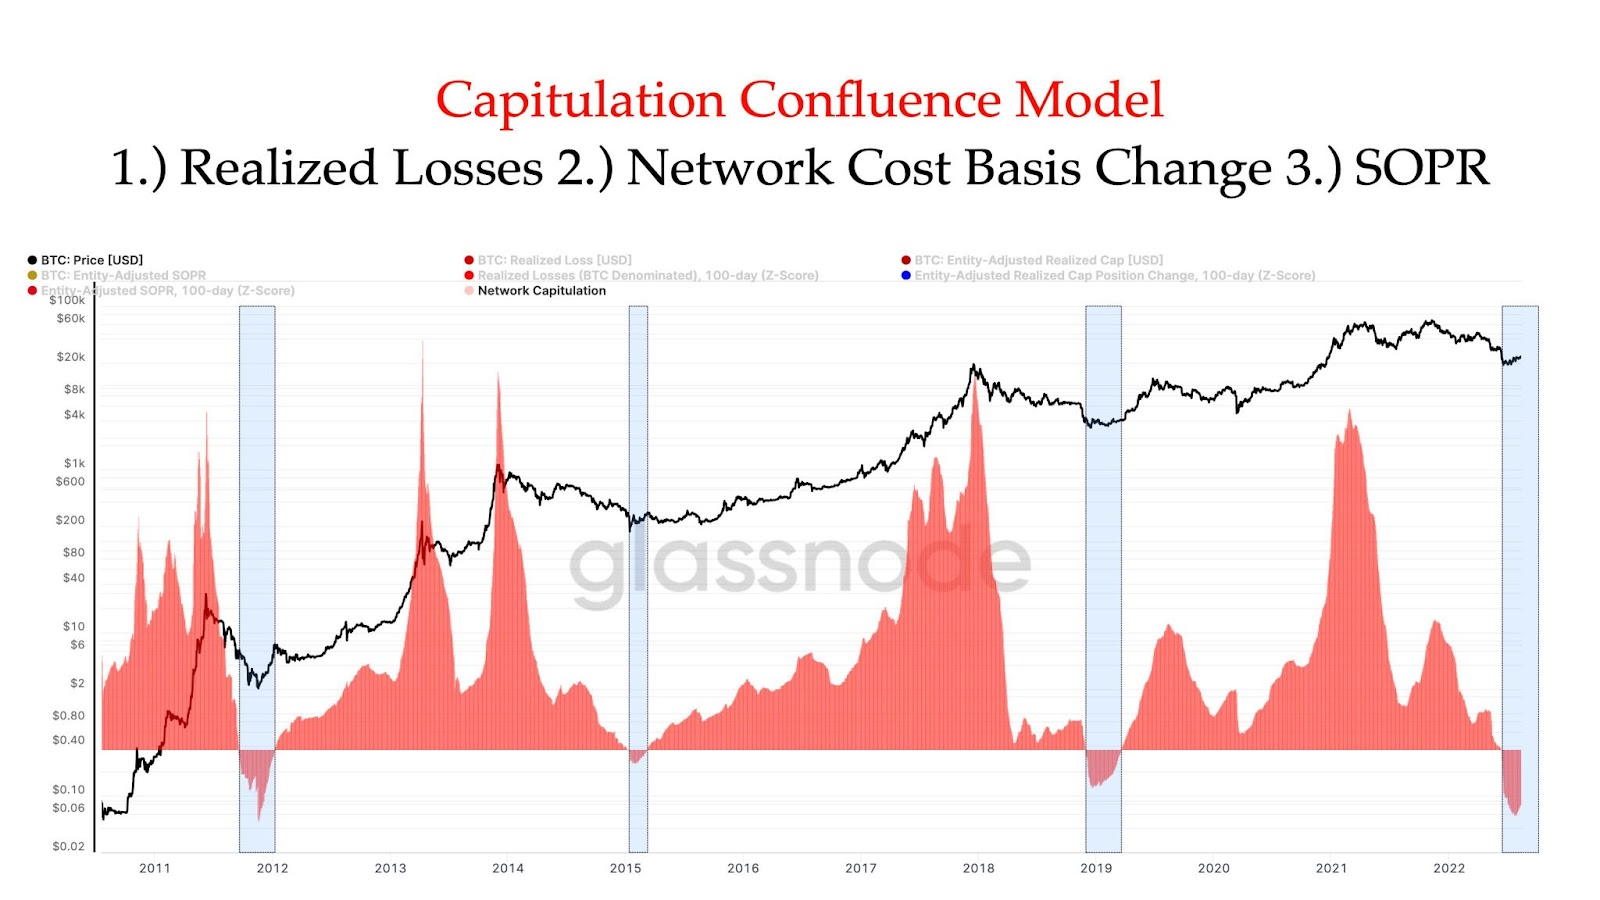
The analyst’s latest model called Capitulation Confluence Model combines 3 on-chain indicators: Realized Loss, Network Cost Basis Change, and SOPR. The graph derived from their combination suggests that Bitcoin is today in the negative territory of the new indicator. Historically, this territory has been correlated with the period of the macro bottom in the BTC price and the subsequent accumulation.
In the chart below, we see that so far the Capitulation Confluence Model indicator has been in negative territory 4 times:
- at the end of 2011: the BTC bottom at $2.05
- in early 2015: the BTC bottomed at $164
- at the turn of 2018-2019: the BTC bottom at $3148
- currently as of June 2022: BTC bottom at $17,600
Moreover, usually (except in 2011) the entry into negative territory was correlated with a sharp drop in the BTC price, leading to a macro bottom. This was followed by several months of accumulation. As the analyst calculates, it lasted 112 days in 2011, 62 days in 2015, and 113 days in 2018-2019, respectively.
Averaging these three historical periods, we get 96 days, after which Bitcoin ended capitulation and began a new bull market. Plan C adds that the current capitulation, according to the Capitulation Confluence Model, has already lasted 65 days. Thus, it has already lasted longer than the corresponding period in 2015. Moreover, there are only 31 days, or a month, left to equal the average of previous historical capitulation periods.
DCA: comment on the model
One of the first commentators on the Capitulation Confluence Model was its author himself. A few dozen minutes later, he published a tweet in which he suggested that the capitulation period indicated by the indicator is the best opportunity for “simply DCAing everyday.”
According to Plan C, we cannot accurately identify the bottom of the current bear market, but with the help of the indicator it has created, we can identify with high probability the ongoing capitulation phase. Thus, this provides an excellent opportunity for systematic BTC accumulation through the well-known dollar cost averaging (DCA) strategy.
BTC capitulation vs. Realized Price
Another interesting comment was made by user @TheChainRN, who referred his tweet to an on-chain indicator: the Realized Price. Regarding this well-known indicator, he points out that historical capitalization periods have lasted longer than the previously mentioned 65 days. The user concludes that #BTC has more work to do.”
Looking at the Realized Price indicator, we see that the periods when Bitcoin was below the orange line (green areas) were indeed quite long:
- 116 days between September 2011 and January 2012
- 295 days between January and October 2015
- 135 days between November 2018 and April 2019

In addition, on the chart, we see another short phase when the BTC price dived below the Realized Price. This was the short 7-day period of the COVID-19 crash in March 2020.
But most interesting are the current readings from this indicator, which seem to contradict the narrative from the Capitulation Confluence Model. Bitcoin indeed broke below the orange line on June 13. However, just one month later – on July 18 – it broke out above it. Currently, the price of BTC is around $2,000 above the Realized Price indicator.
If so, capitulation may already be coming to an end, and the average of 96 days from the Capitulation Confluence Model may be too long. However, on the other hand, we can see on the Realized Price chart that during the accumulation period of 2011-2012, as well as in 2015, the price of BTC broke out above the orange line, but shortly after that returned below it again. Thus, regaining positive territory on the 3-indicator Capitulation Confluence Model may be a better signal of the end of capitulation than the mere fact of a breakout above the Realized Price chart.
For Be[In]Crypto’s latest Bitcoin (BTC) analysis, click here.
Disclaimer
In line with the Trust Project guidelines, this price analysis article is for informational purposes only and should not be considered financial or investment advice. BeInCrypto is committed to accurate, unbiased reporting, but market conditions are subject to change without notice. Always conduct your own research and consult with a professional before making any financial decisions. Please note that our Terms and Conditions, Privacy Policy, and Disclaimers have been updated.