
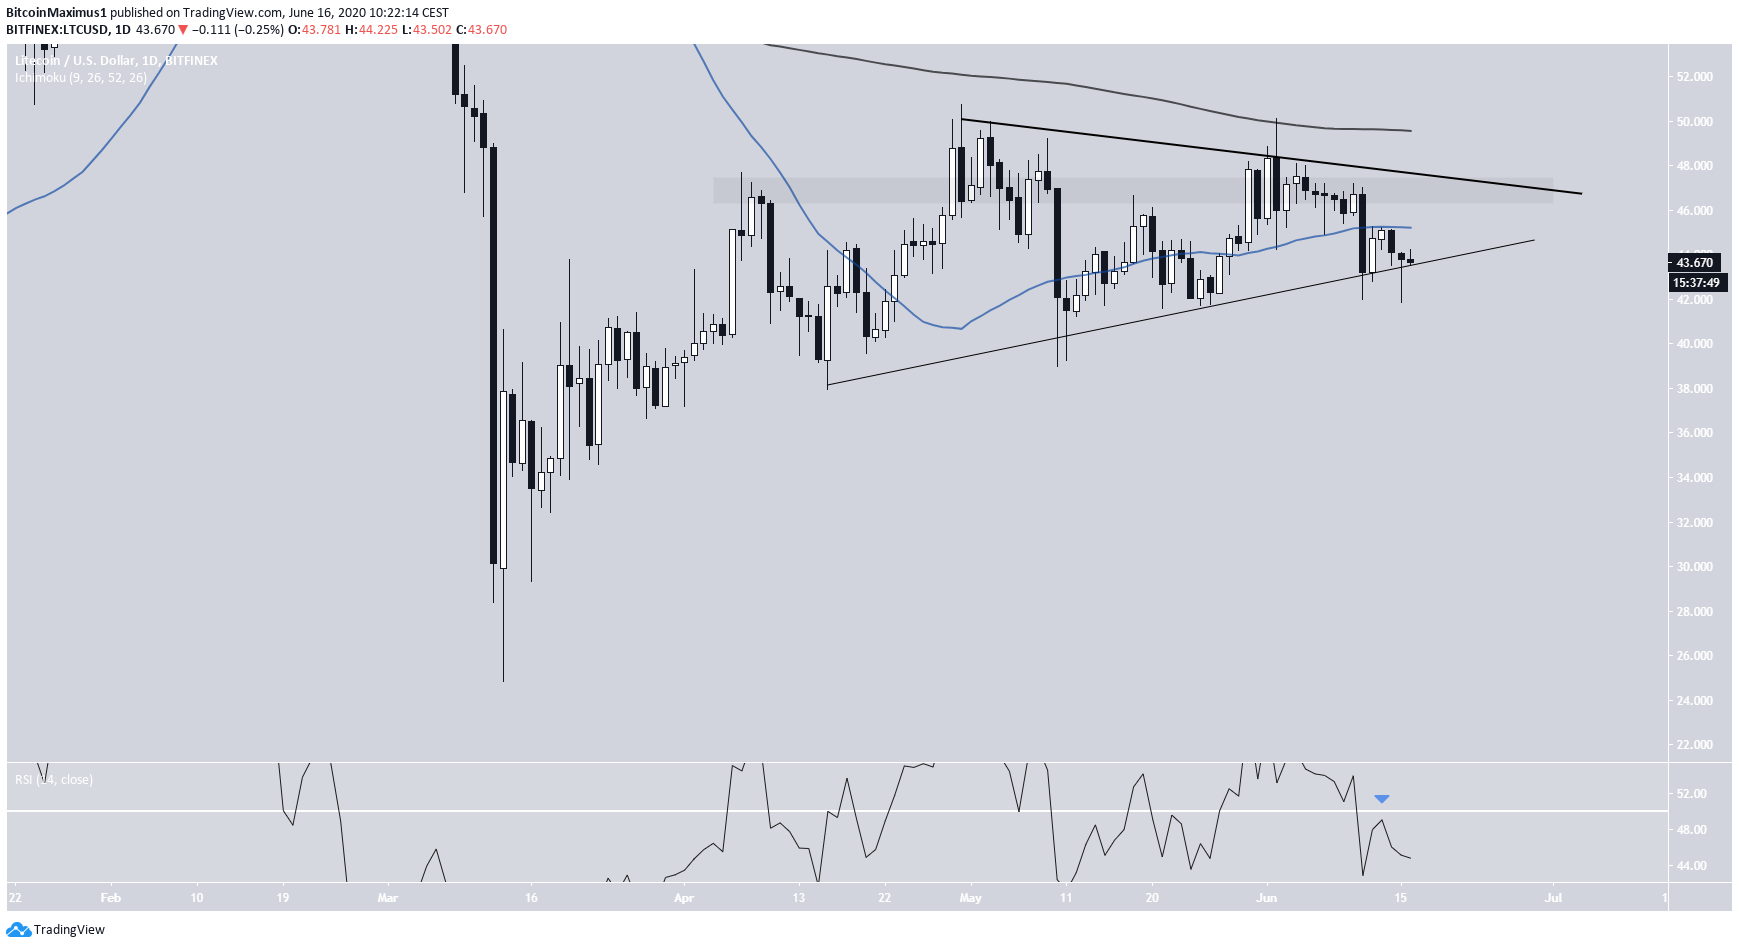
The Litecoin price has been trading inside a massive symmetrical triangle since April 16. The price is expected to eventually break out from this triangle and move towards long-term resistance levels.
The Litecoin price has been increasing since March 13. However, in the period from April 16, it has been trading inside a symmetrical triangle. While the symmetrical triangle is often considered a neutral pattern, the fact that the pattern is transpiring after an upward move makes a breakout more likely.
Litecoin Symmetrical Triangle
There is, however, considerable resistance zones above the current price. First, there are the 50 and 200-day moving averages (MA), both of which are above the current price. Second, there is the $47 horizontal resistance area. Finally, the daily RSI was rejected by the 50-line and is moving downwards.
Cryptocurrency trader @Mesawine1 believes that the price will break out from the symmetrical triangle, stating that :
$ltc update:
It’s taking a bit longer than expected, but #litecoin is still looking primed for a blast.
C’mon #ltc show me some of that juicy stuff
#crypto

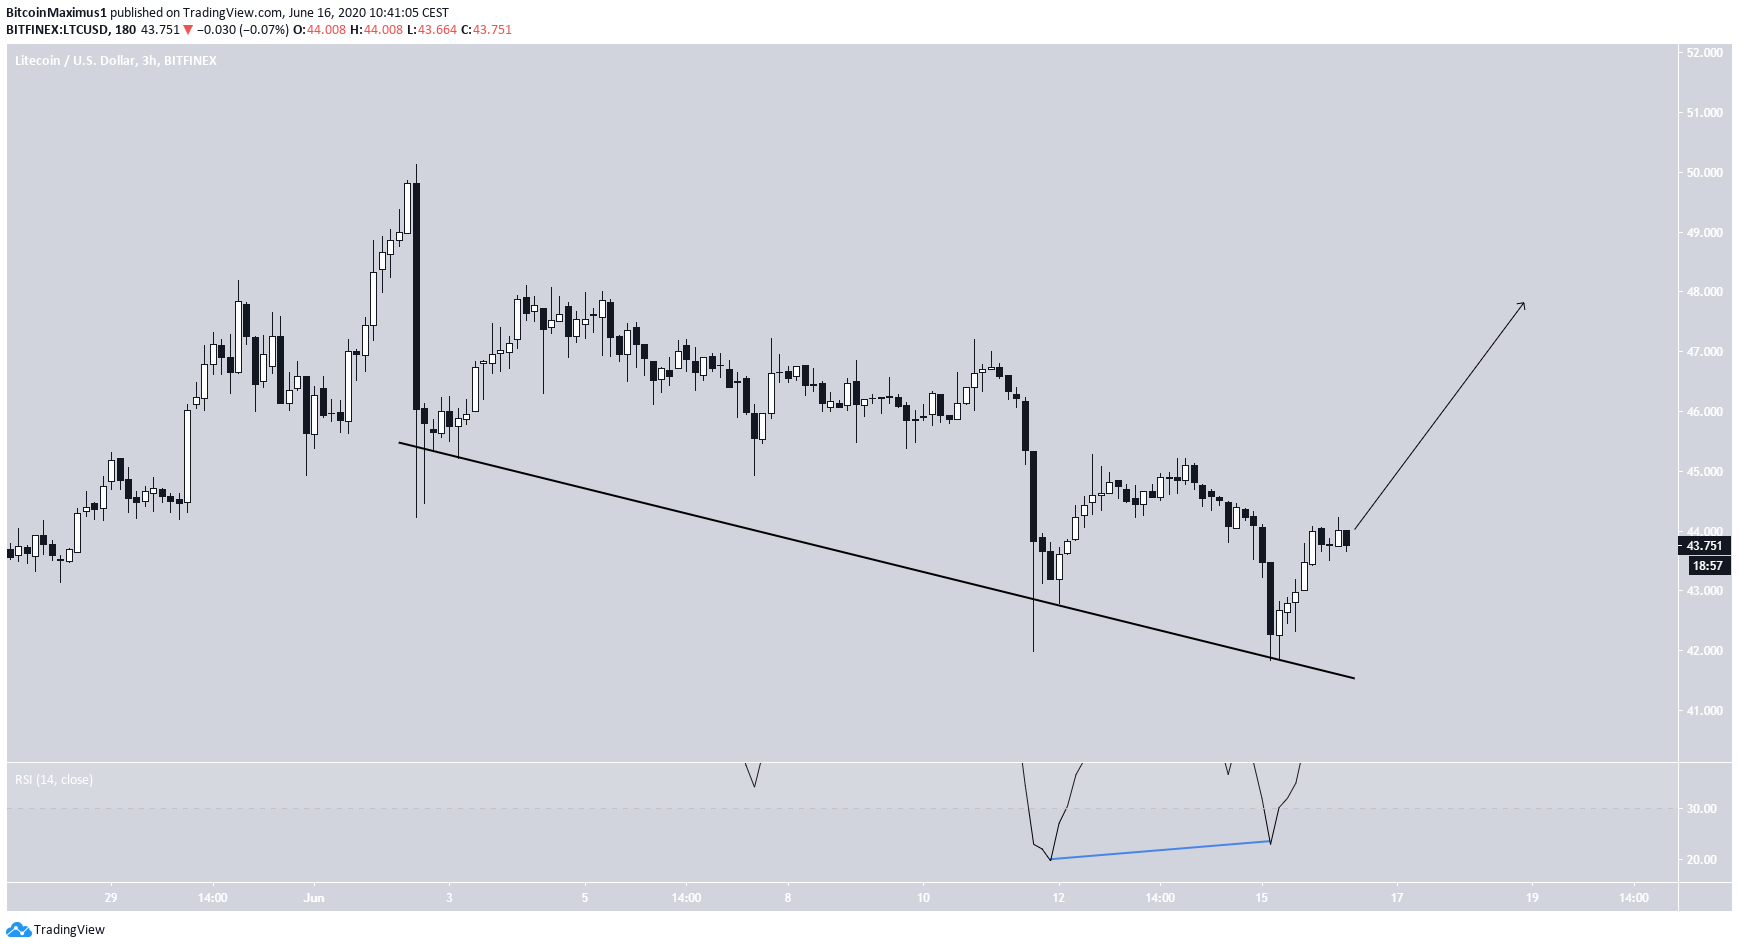
A look at the short-term chart supports the possibility of a breakout. The price has been following a short-term descending support line that has been in place since June 2. In addition, during the most recent lows, the price has created a double-bottom alongside bullish divergence in the RSI.
Therefore, the price is expected to begin moving upwards towards the resistance area previously outlined and possibly break out from the triangle.
Future Movement
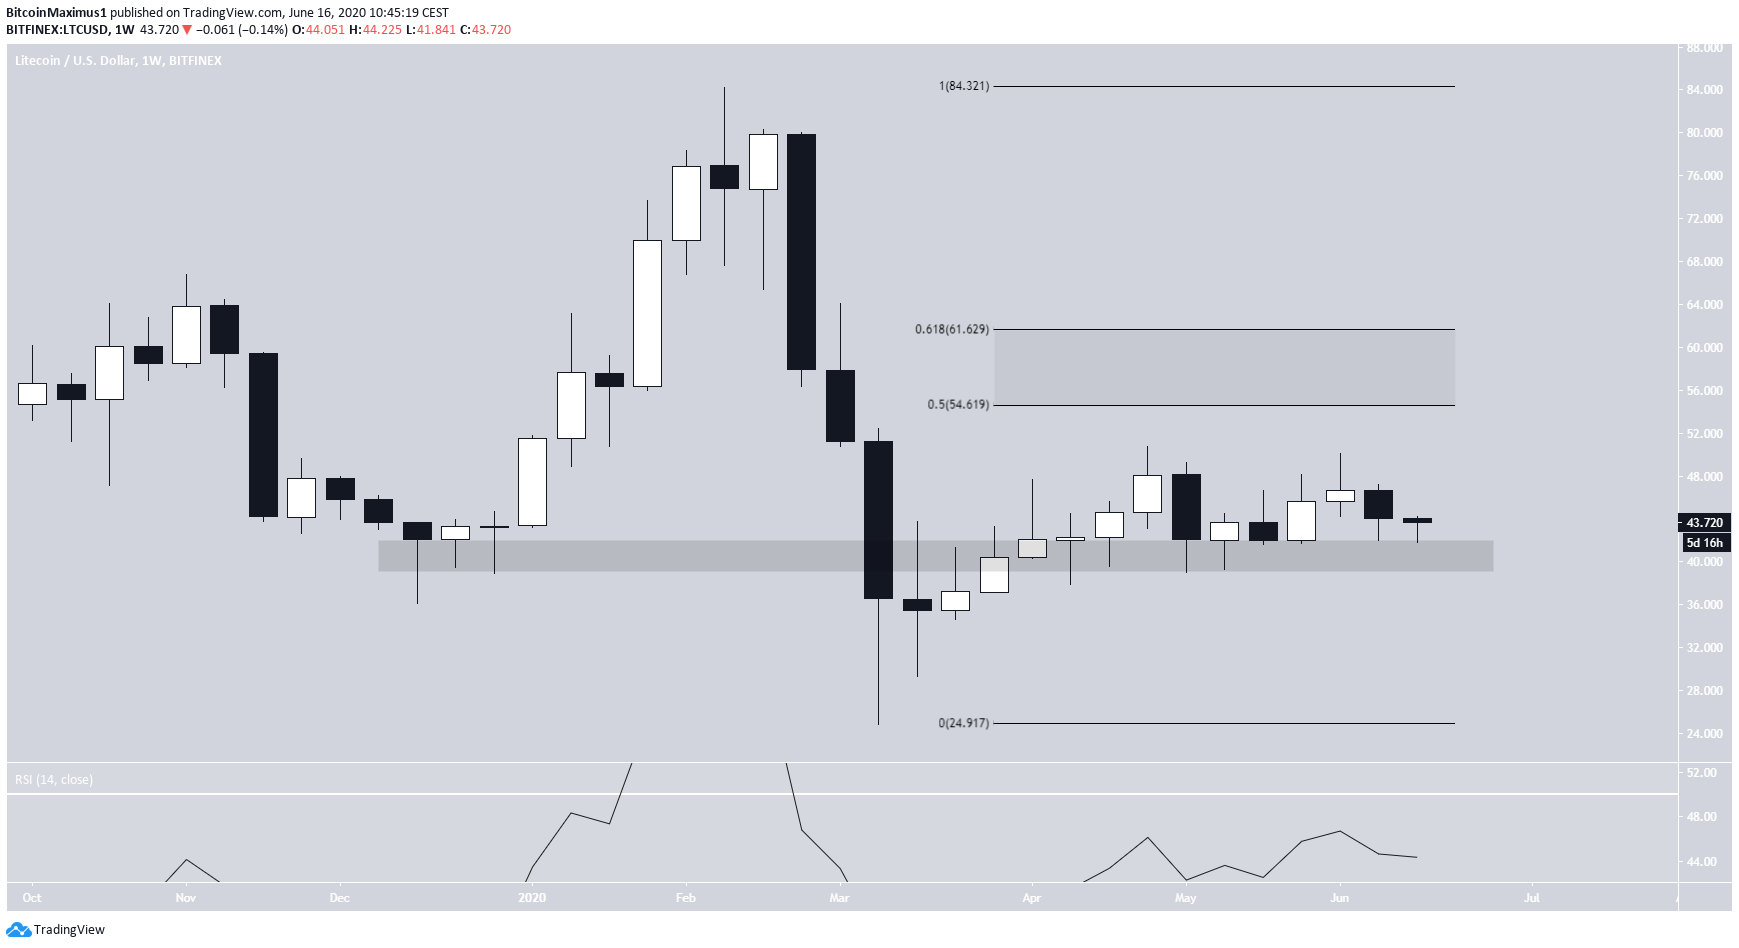
The weekly chart reveals a slightly bullish bias. Even though the price decreased below $40 at the beginning of March, the price has reclaimed the level as support. This makes the aforementioned March movement a likely fake out below support, which was followed by an increase.
If the price breaks out from the symmetrical triangle, the closest resistance levels would be found between $55-$61.50.
For this movement to be confirmed, the weekly RSI would have to move above 50.
To conclude, the LTC price has been trading inside a symmetrical triangle, out of which a breakout is expected. The price is likely to reach the resistance areas outlined above.
