


The Chainlink (LINK) price broke out from a descending wedge on Nov. 23. This could be a rally that will take it back to double digits.
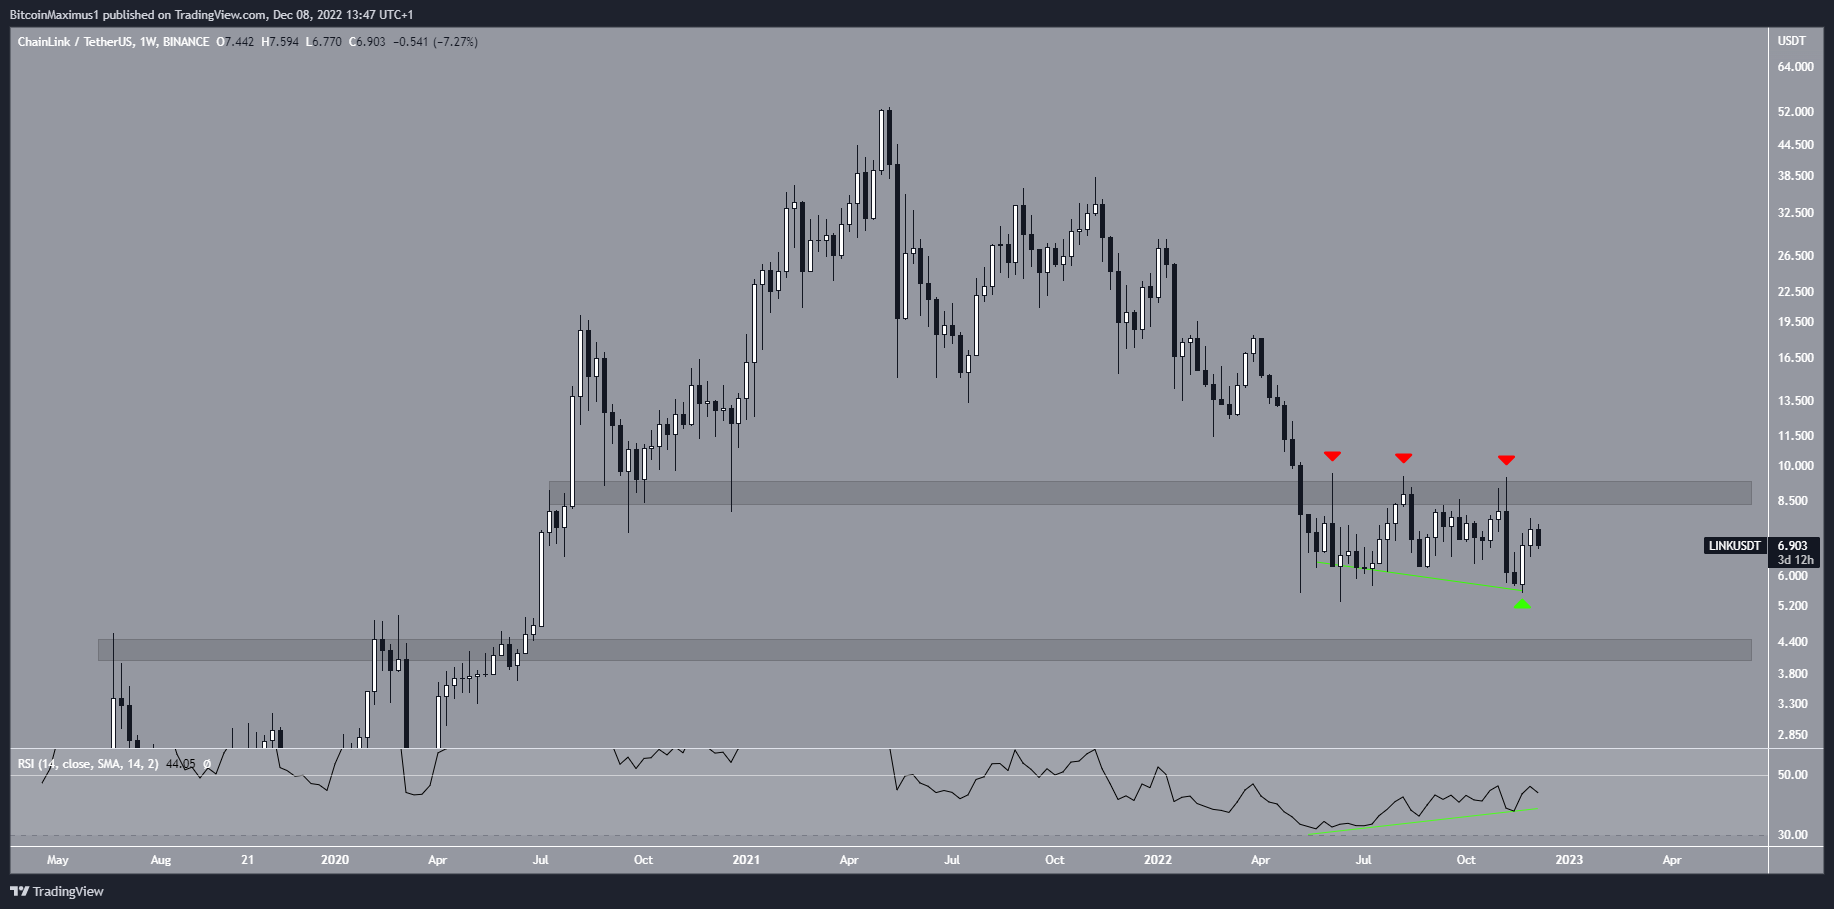
The Chainlink price has traded close to $6.40 since May 9. While Chainlink reached a minimum price of $5.30, the lowest weekly close was at $5.80. Immediately after the close, the LINK price created a bullish engulfing candlestick (green icon).
The candlestick also validated a bullish divergence (green line) in the weekly time frame. This is the first time in the price history of Chainlink that the weekly RSI has generated bullish divergence.
However, the price movement is bearish, since Chainlink was rejected thrice (red icon) by the $9.40 horizontal resistance area.
As a result, the price action and the weekly RSI give an opposite outlook on the price forecast. While the RSI is bullish and suggests that the LINK price will successfully move above $8.90, the price action indicates that a fall toward the long-term $4.40 support area is expected.
Chainlink Price Wave Count Supports Eventual Breakout
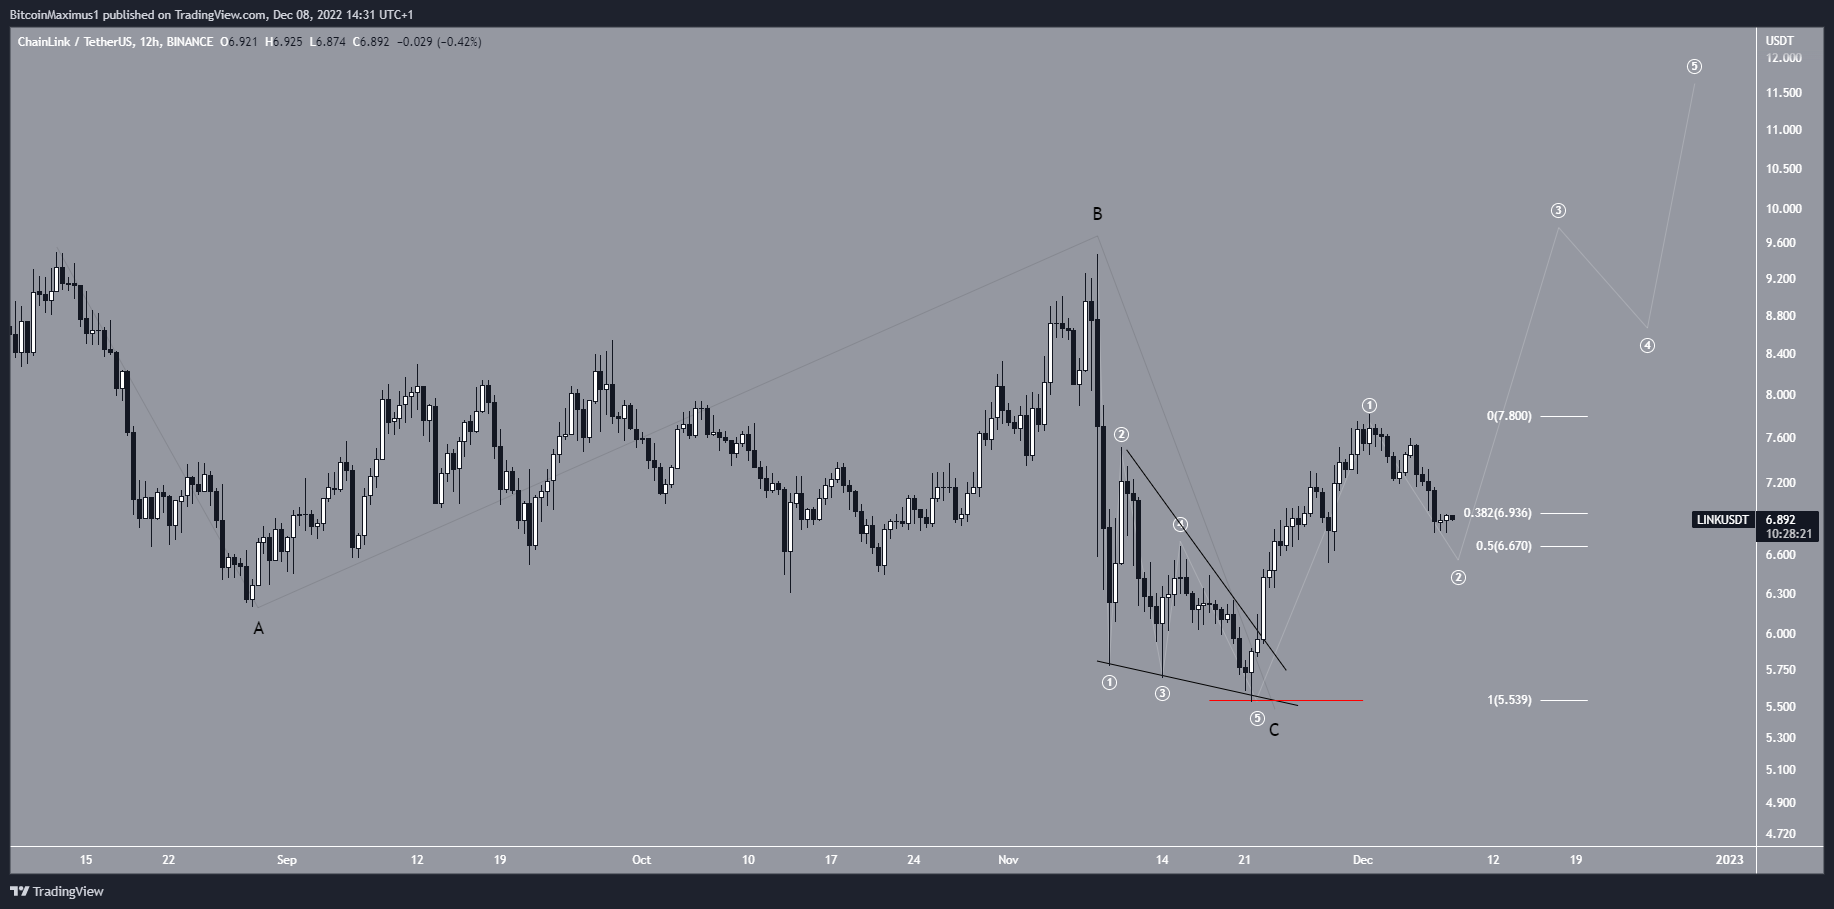
The wave count provides a bullish price analysis, indicating that the future price will successfully move above the $9.40 resistance area. In turn, this would confirm the bullish divergence in the weekly RSI.
The most likely wave count suggests that the LINK price has completed an A-B-C corrective structure (black). In it, wave C developed into an ending diagonal, hence the shape of the wedge. The sub-wave count is given in white.
As a result, the most likely Chainlink price prediction is bullish. Conversely, falling below the wave C low (Red line) at $5.52 would invalidate this bullish forecast.
For BeInCrypto’s latest crypto market analysis, click here.


