


PancakeSwap (CAKE) has completed a double bottom pattern inside the $9.80 horizontal support area.
Afterwards, it proceeded to break out from a descending resistance line and has been moving upwards since.
Double bottom leads to breakout
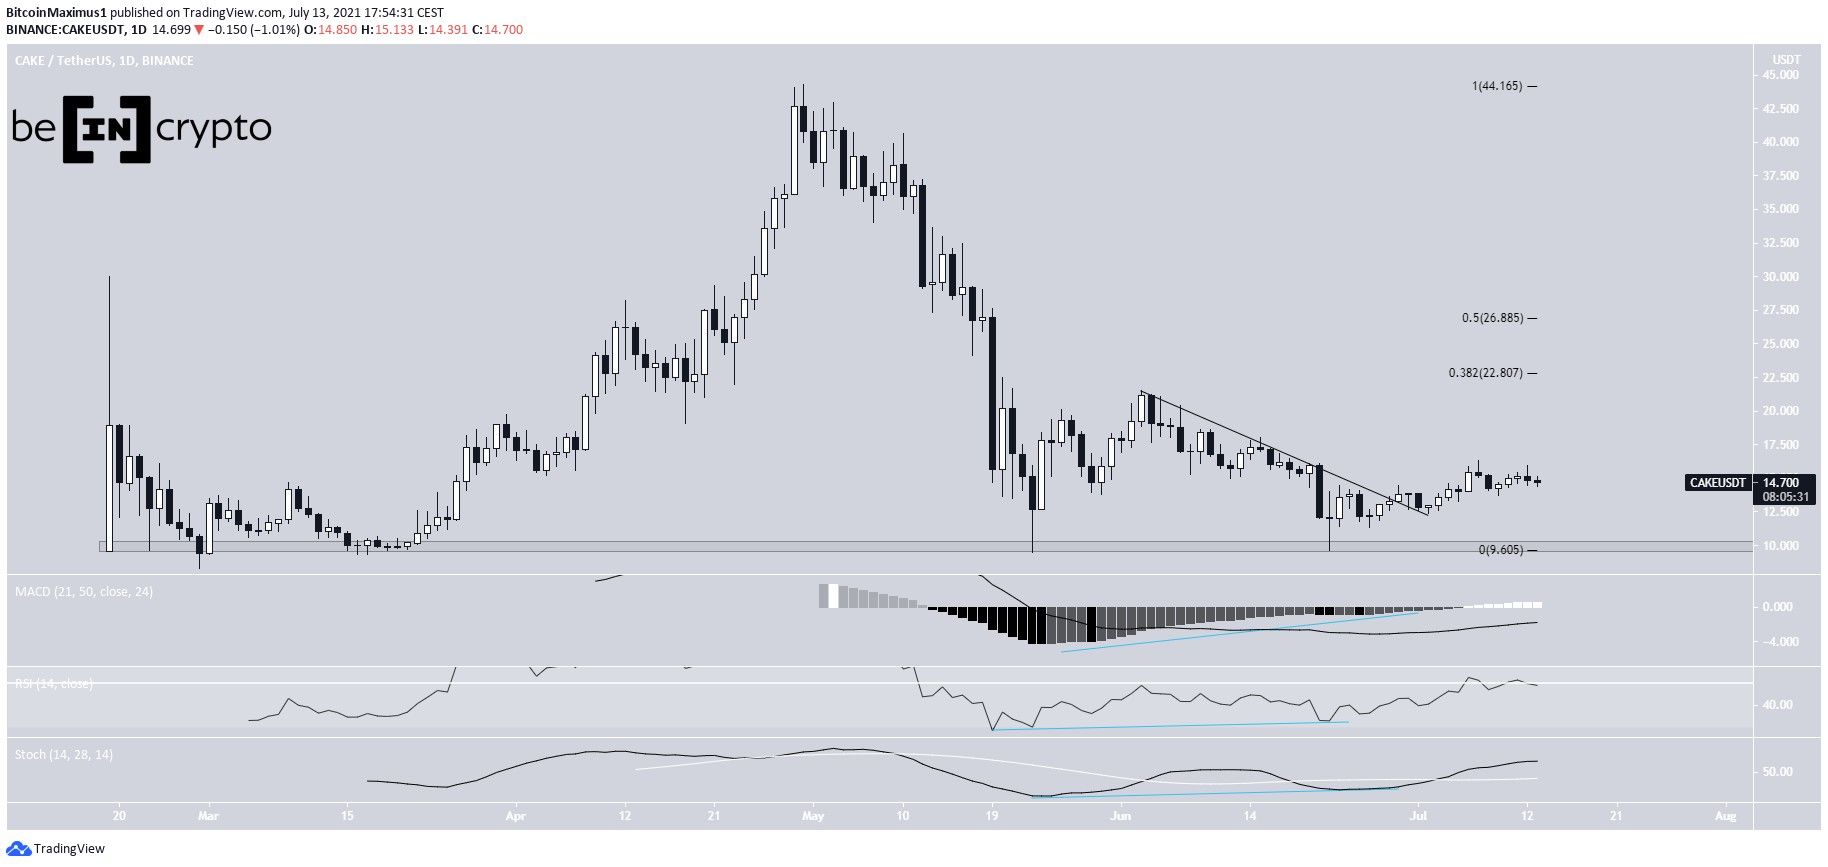
CAKE has been decreasing since April 30, when it reached an all-time high price of $44.27. The token decreased until a low of $9.44 was reached on May 23.
After a bounce, the token returned to the same level on June 22, creating a double bottom pattern, in which both lows had long lower wicks.
In addition, the pattern was combined with significant bullish divergence in the RSI, MACD & Stochastic oscillator. The latter made a bullish cross, afterwards while the RSI moved above 50.
After its completion, CAKE managed to break out from a descending resistance line, and has been moving upwards since.
The closest resistances are at $22.8 and $26.8, the 0.382 and 0.5 Fib retracement resistance levels.
Short-term movement
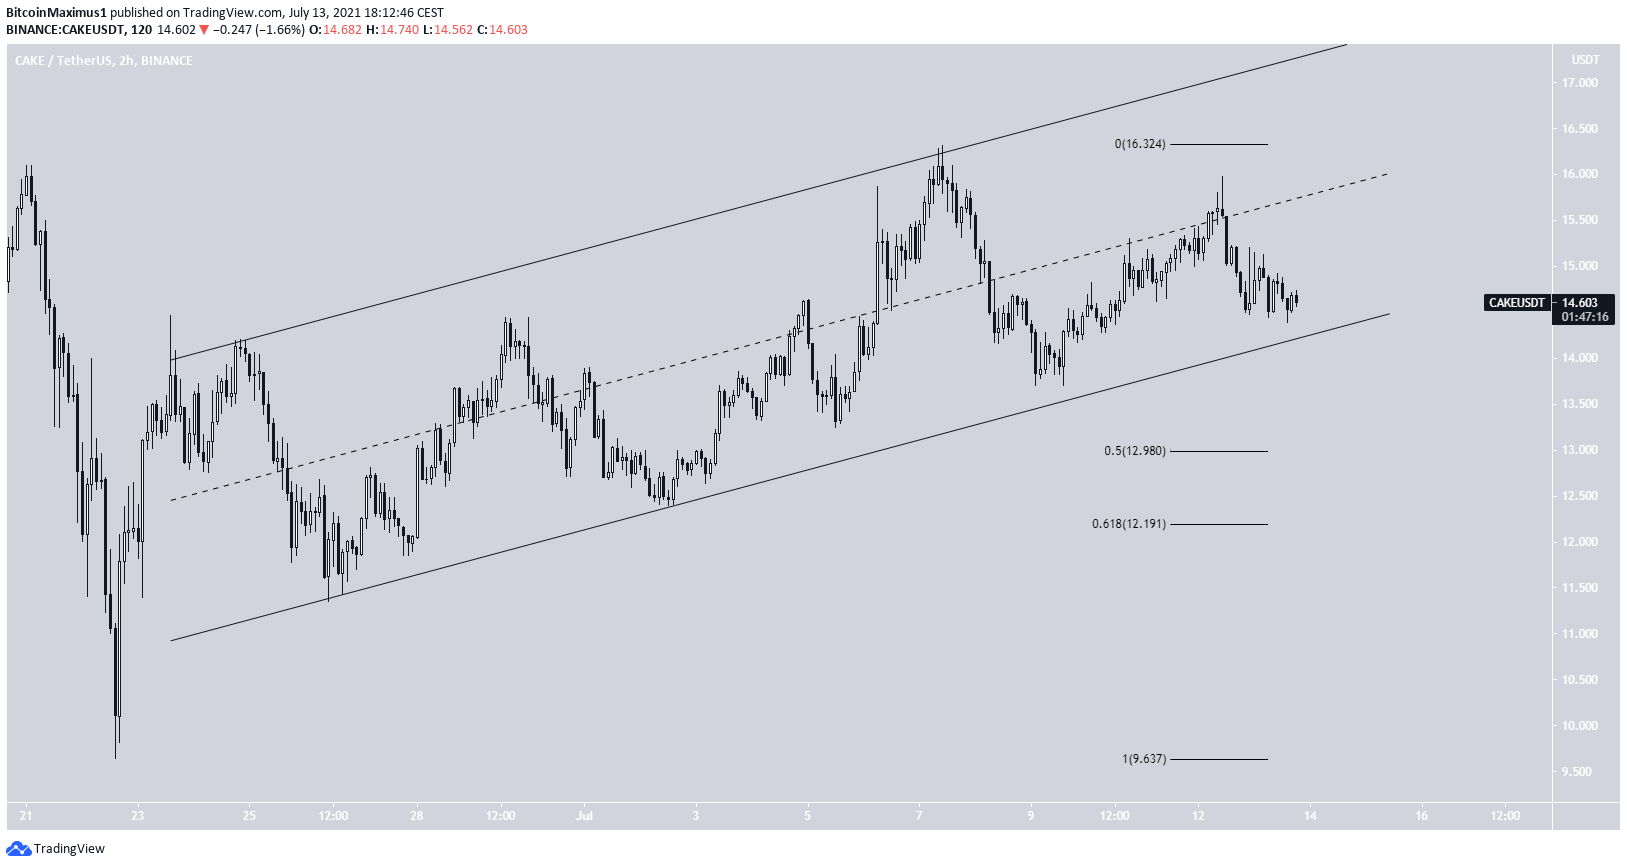
In the short-term, it seems that CAKE is trading inside an ascending parallel channel. Such patterns often contain corrective movements.
Therefore, an eventual breakdown from the pattern would be likely, before CAKE resumes its upward movement towards the outlined target.
If one occurs, the main support areas would be at $12.2 and $12.98, the 0.5 and 0.618 Fib retracement support levels.
CAKE/BTC
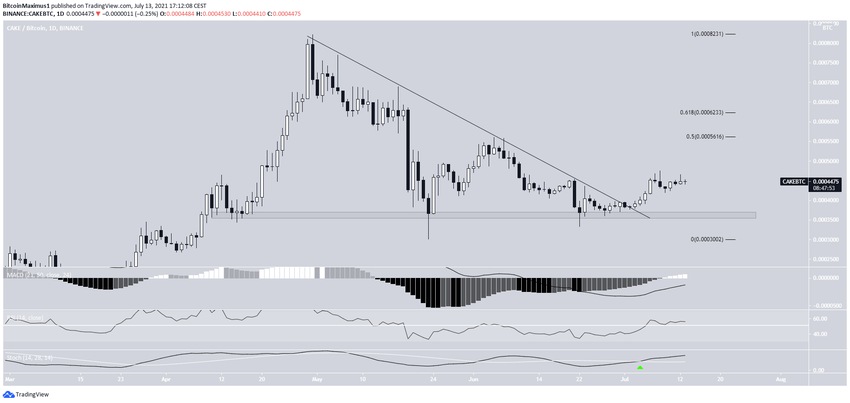
Cryptocurrency trader @CryptoNTez outlined a CAKE/BTC chart, which shows a breakout from a descending resistance line
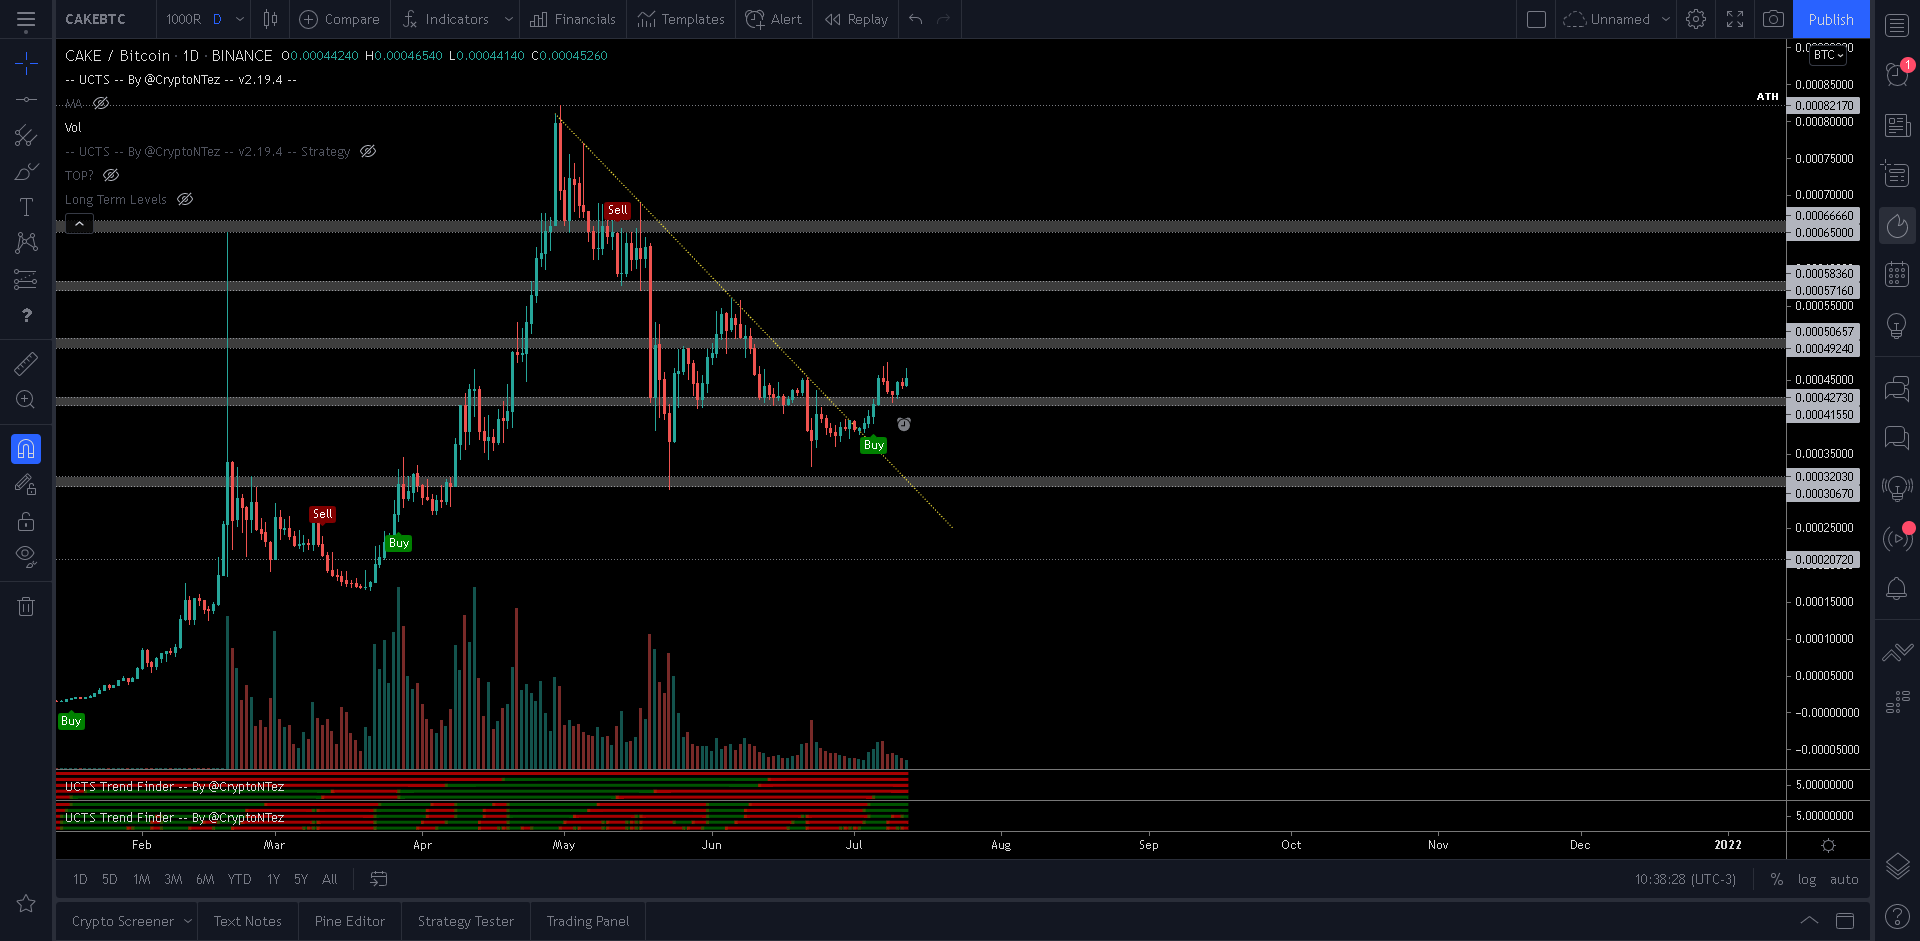
The resistance line had been in place since April 30, while the token managed to break out on July 2.
Technical indicators are bullish, supporting the continuation of the upward movement. The RSI is above 50, the Stochastic oscillator has made a bullish cross and the MACD is nearly positive.
The closest resistances are between 56,160 and 62,333, the 0.5-0.618 Fib retracement resistance levels.
For BeInCrypto’s latest bitcoin (BTC) analysis, click here.


