


Bitcoin (BTC) decreased considerably on July 12, creating a bearish engulfing candlestick and reaching a low of $32,658.
BTC is still trading inside a short-term descending parallel channel, from which a breakout could occur.
BTC trading range
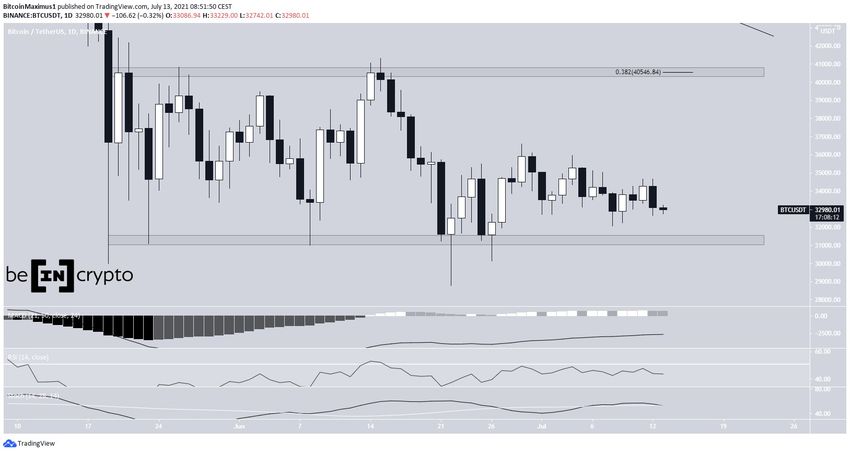
BTC has been trading inside a range between $31,300 and $40,550 since May 19. It’s currently in the lower portion of this range.
On July 12, BTC created a bearish engulfing candlestick and fell to a low of $32,658. However, it has bounced back to the $33,000 level since.
Technical indicators are leaning bearish. The Stochastic oscillator is close to making a bearish cross and the RSI is below 50. In addition, the MACD has created one lower momentum bar. Another bearish close with another lower momentum bar would give a bearish reversal signal in the MACD.
Short-term movement
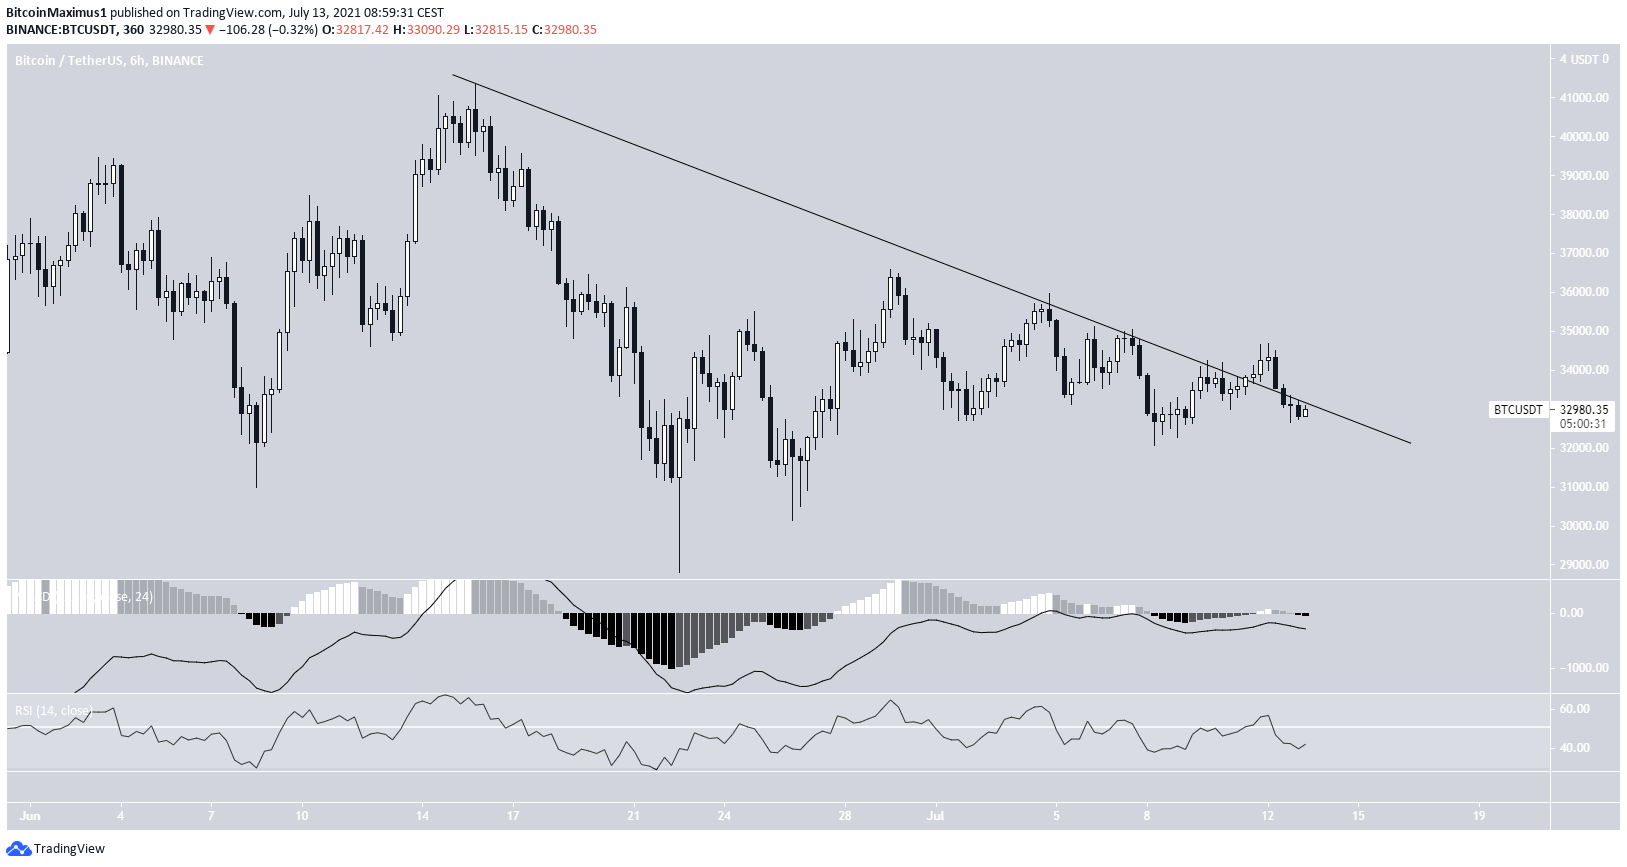
The six-hour chart shows that BTC initially broke out from a descending resistance line which had been in place since June 15. However, the breakout could not be sustained and the token has fallen back below the support line.
In addition, six-hour indicators are bearish, as both the RSI and MACD are falling.
BTC has to reclaim this line in order for the trend to be considered bullish.
Wave count
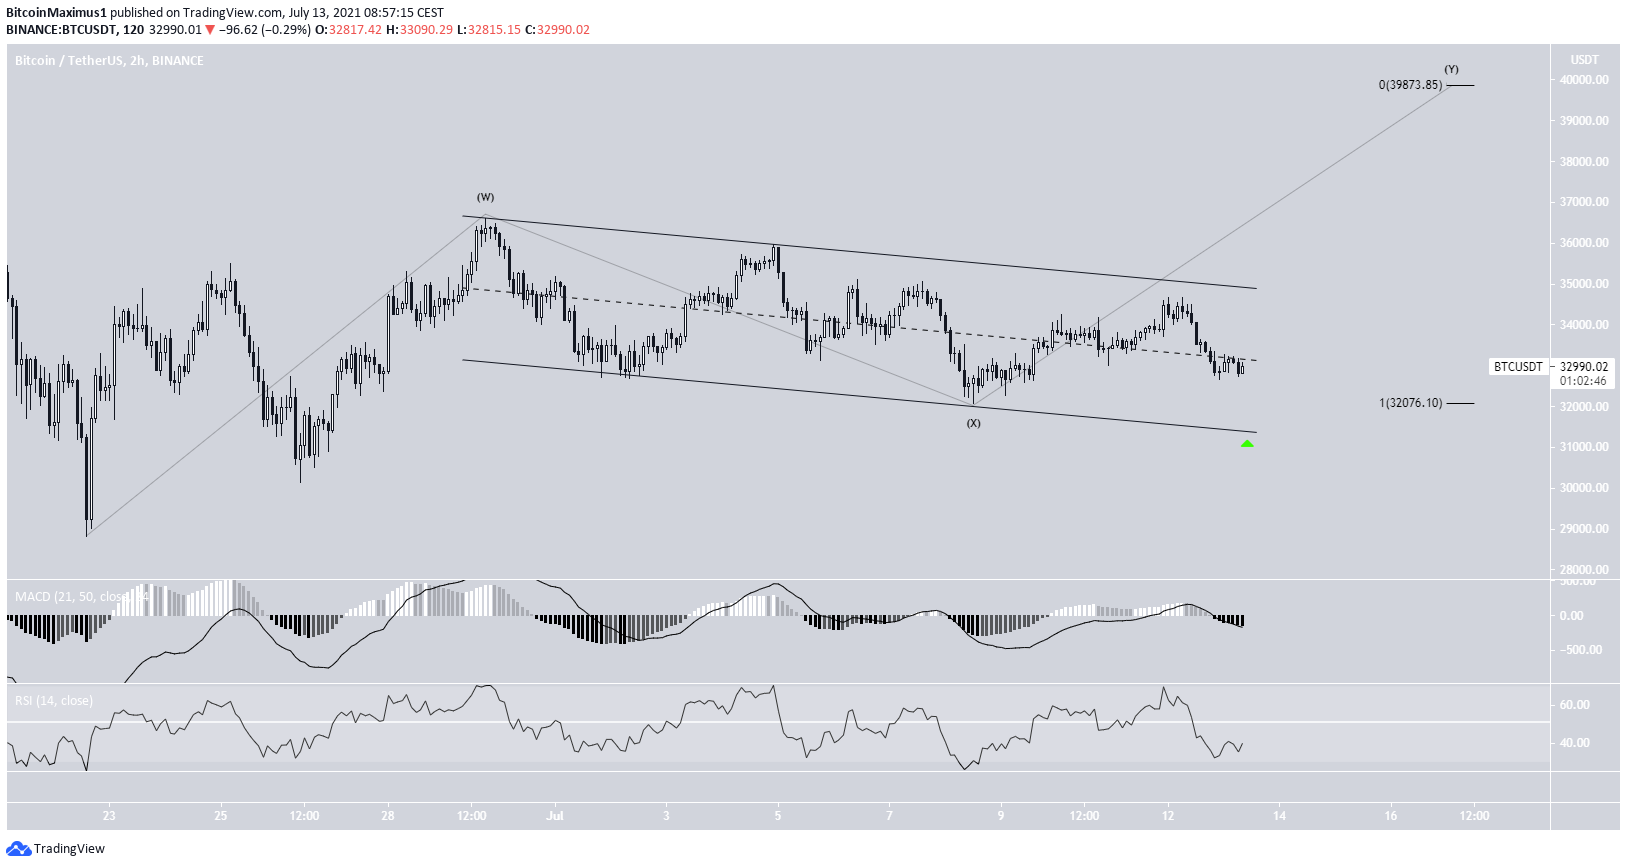
The two-hour chart shows that BTC is trading inside a descending parallel channel with very choppy movement. Therefore, it’s trajectory is likely to be corrective.
The most likely wave count indicates that the movement is a complex W-X-Y corrective structure. In this case, a breakout would be expected, which could take the price towards the range highs.
It’s possible that BTC will revisit the support line of the channel once more in order to complete the X wave before breaking out.
For BeInCrypto’s latest bitcoin (BTC) analysis, click here.


