Synthetix (SNX) is trading inside a short-term bullish pattern and has shown signs of a short-term bullish reversal. However, the longer-term trend remains bearish.
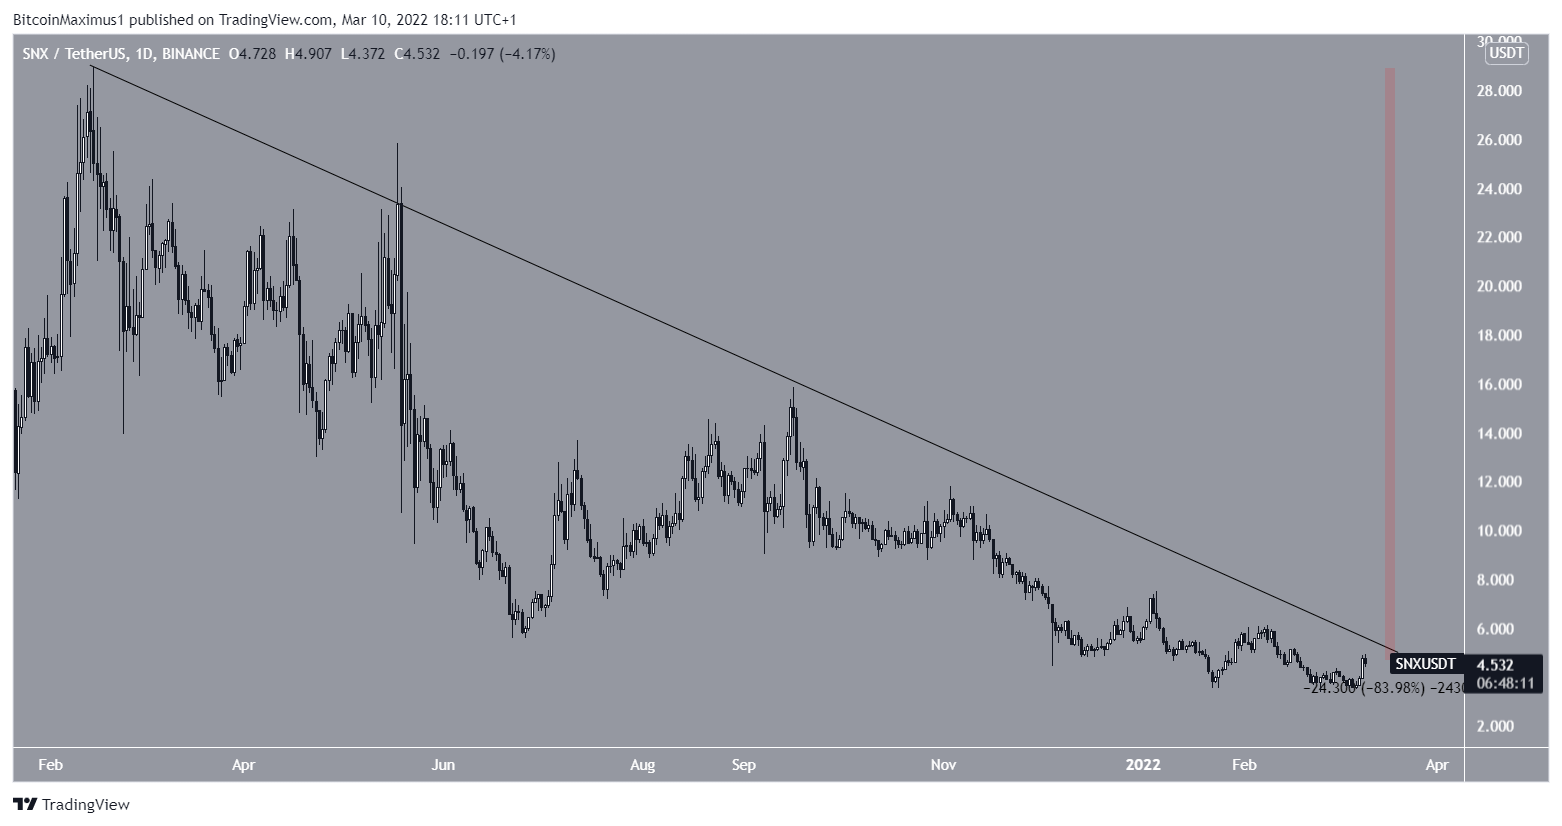
SNX has been decreasing alongside a descending resistance line since reaching a high of $26.91 on Feb 15. So far, the downward movement has led to a low of $3.32 on Feb 24.
After reaching the low, SNX initiated a slight bounce, which however failed to cause a breakout from the descending resistance line, which is currently at $4.70.
At the time of writing, SNX was trading 84% below its all-time high price.
Bullish divergences
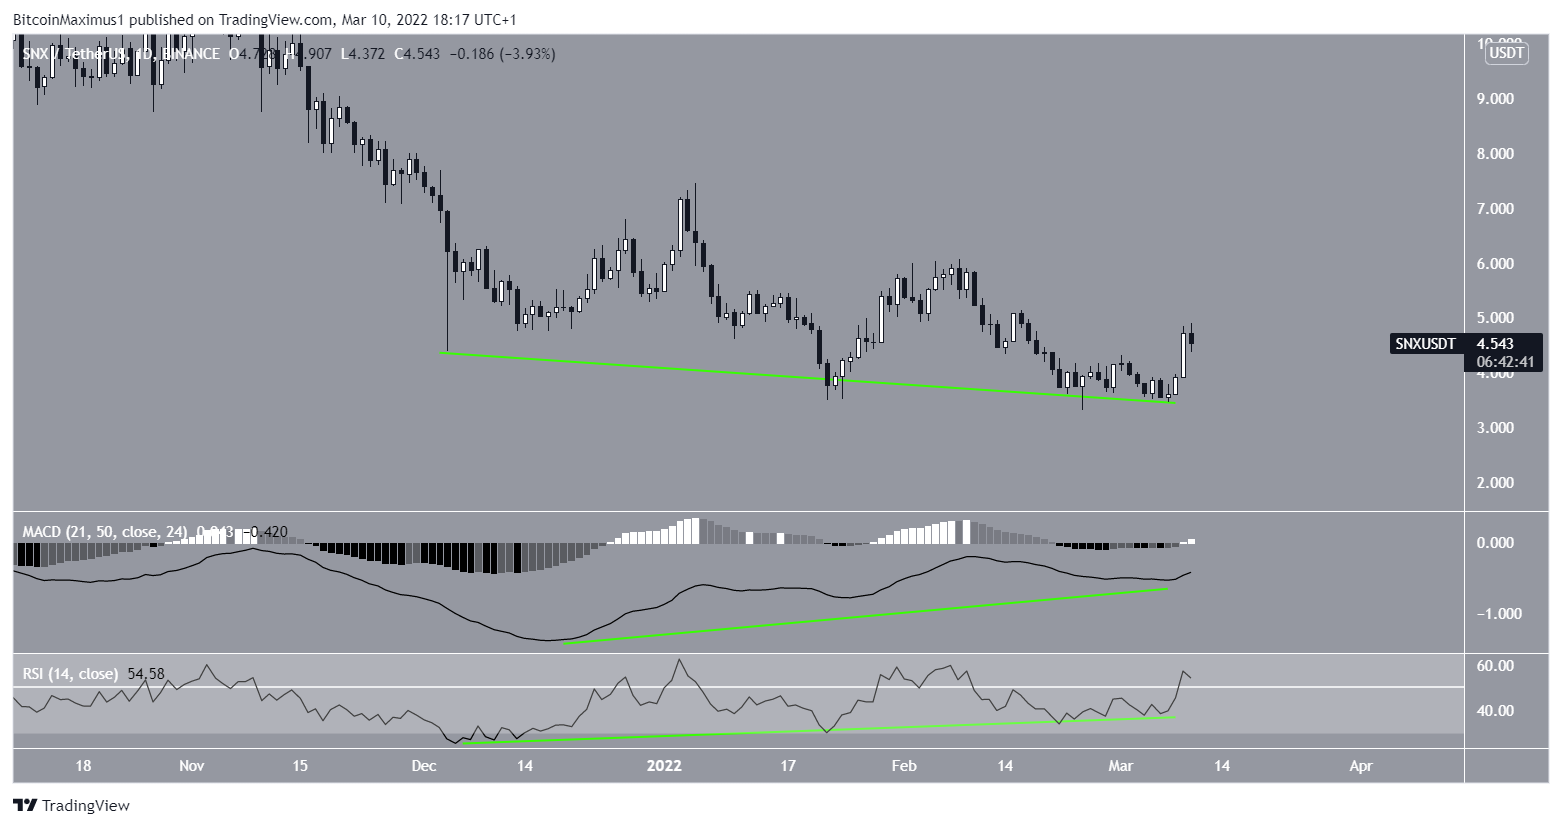
The daily chart suggests that it is possible that SNX will initiate an upward movement and break out from the aforementioned descending resistance line.
The reason for this is the pronounced bullish divergence that has developed in both the RSI and MACD. Such divergences often precede bullish trend reversals.
In addition to this, the RSI has already moved above 50, which is considered a sign of a bullish trend.
A MACD movement above 0 would confirm that the bullish reversal is underway.
Short-term SNX movement
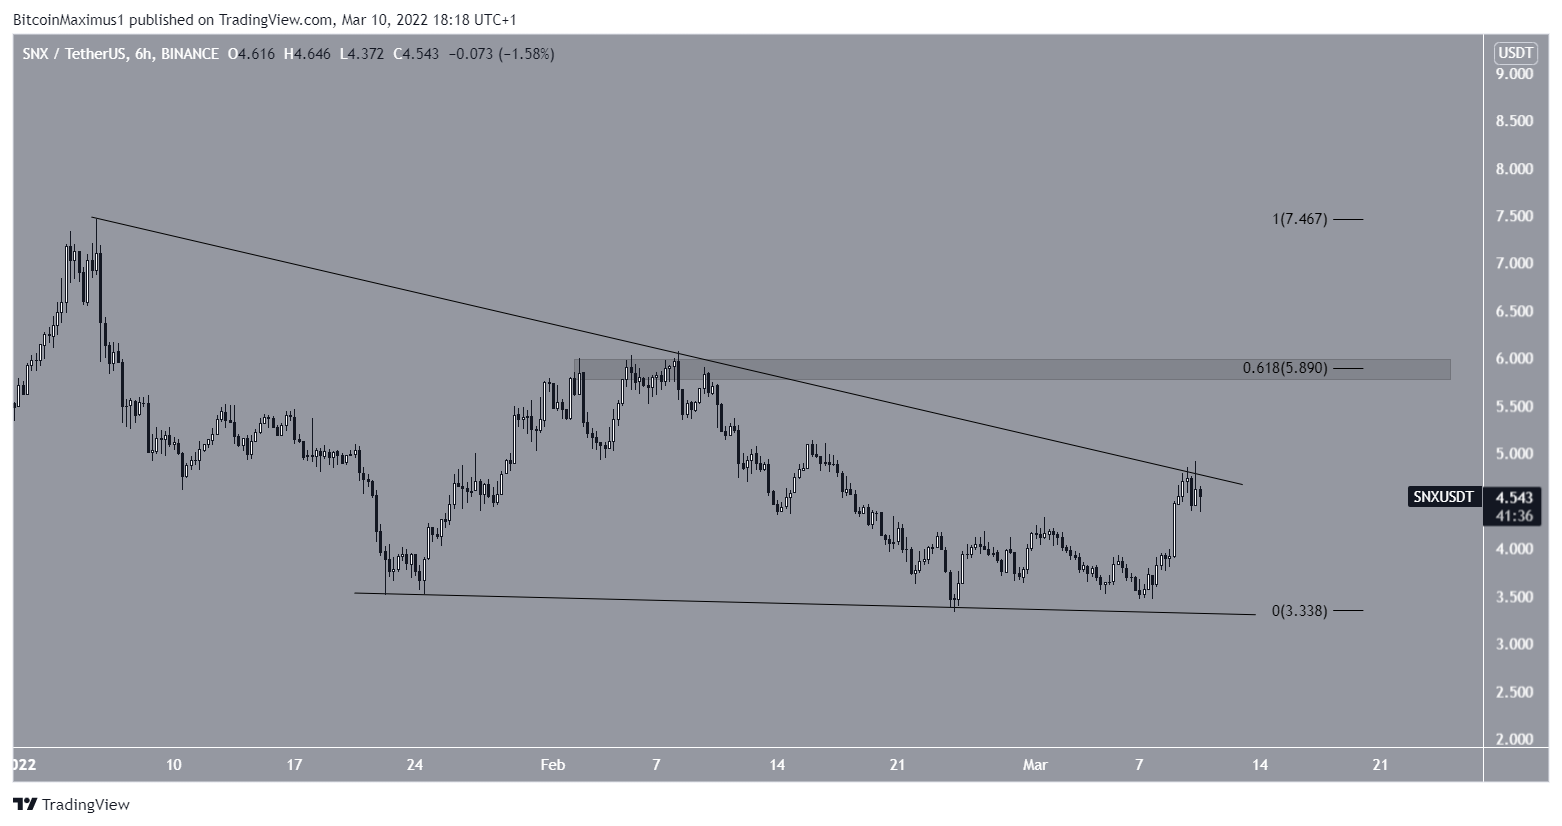
Furthermore, the six-hour chart shows that SNX has been trading inside a descending wedge since the beginning of Jan. The descending wedge is considered a bullish pattern, meaning that a breakout from it would be the most likely scenario.
If one occurs, the closest resistance area would be at $5.90. This is the 0.618 Fib retracement resistance level and a horizontal resistance area.
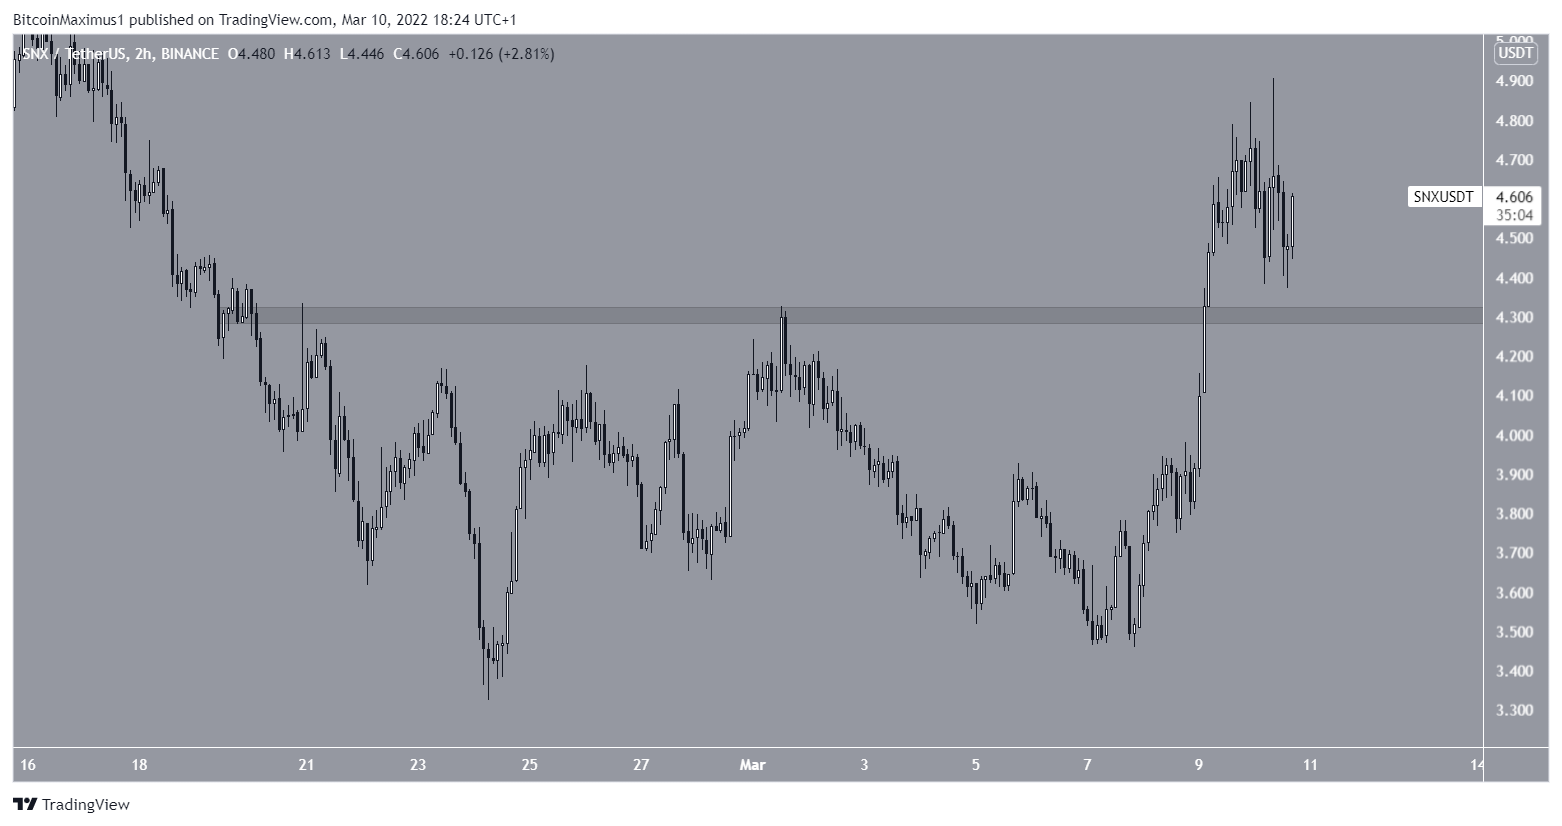
A closer look shows that SNX has broken out from the $4.20 resistance area. Afterwards, it returned and is close to validating it as support.
If the area holds, the continuation of the upward movement and eventual breakout would be expected.