


Since November 25, the Bitcoin price has increased by slightly more than 13 percent. After trading in a range for a couple of days, it initiated a breakout and moved above its previous trading range.
The breakout presents a sigh of relief for bulls everywhere, since the ongoing decrease from $10,500 in late October has had no retracement whatsoever. Not everyone is on-board with the newfound bullishness, with many calling for a continued bearish market and further price decreases.
While lower time-frames give a bullish outlook, the Bitcoin price is likely to retrace once it reaches longer-term resistance.
Former Senior Market Analyst at eToro Mati Greenspan suggested that, after yesterday’s breakout, the current Bitcoin price setup looks ‘extremely bullish.’
Retest of the neckline with a bullish flag.
Past performance is not an indication of future results but as far as TA goes this setup is extremely 🐂ish. pic.twitter.com/J4WriL8dti
— Mati.Quantum (@MatiGreenspan) November 28, 2019
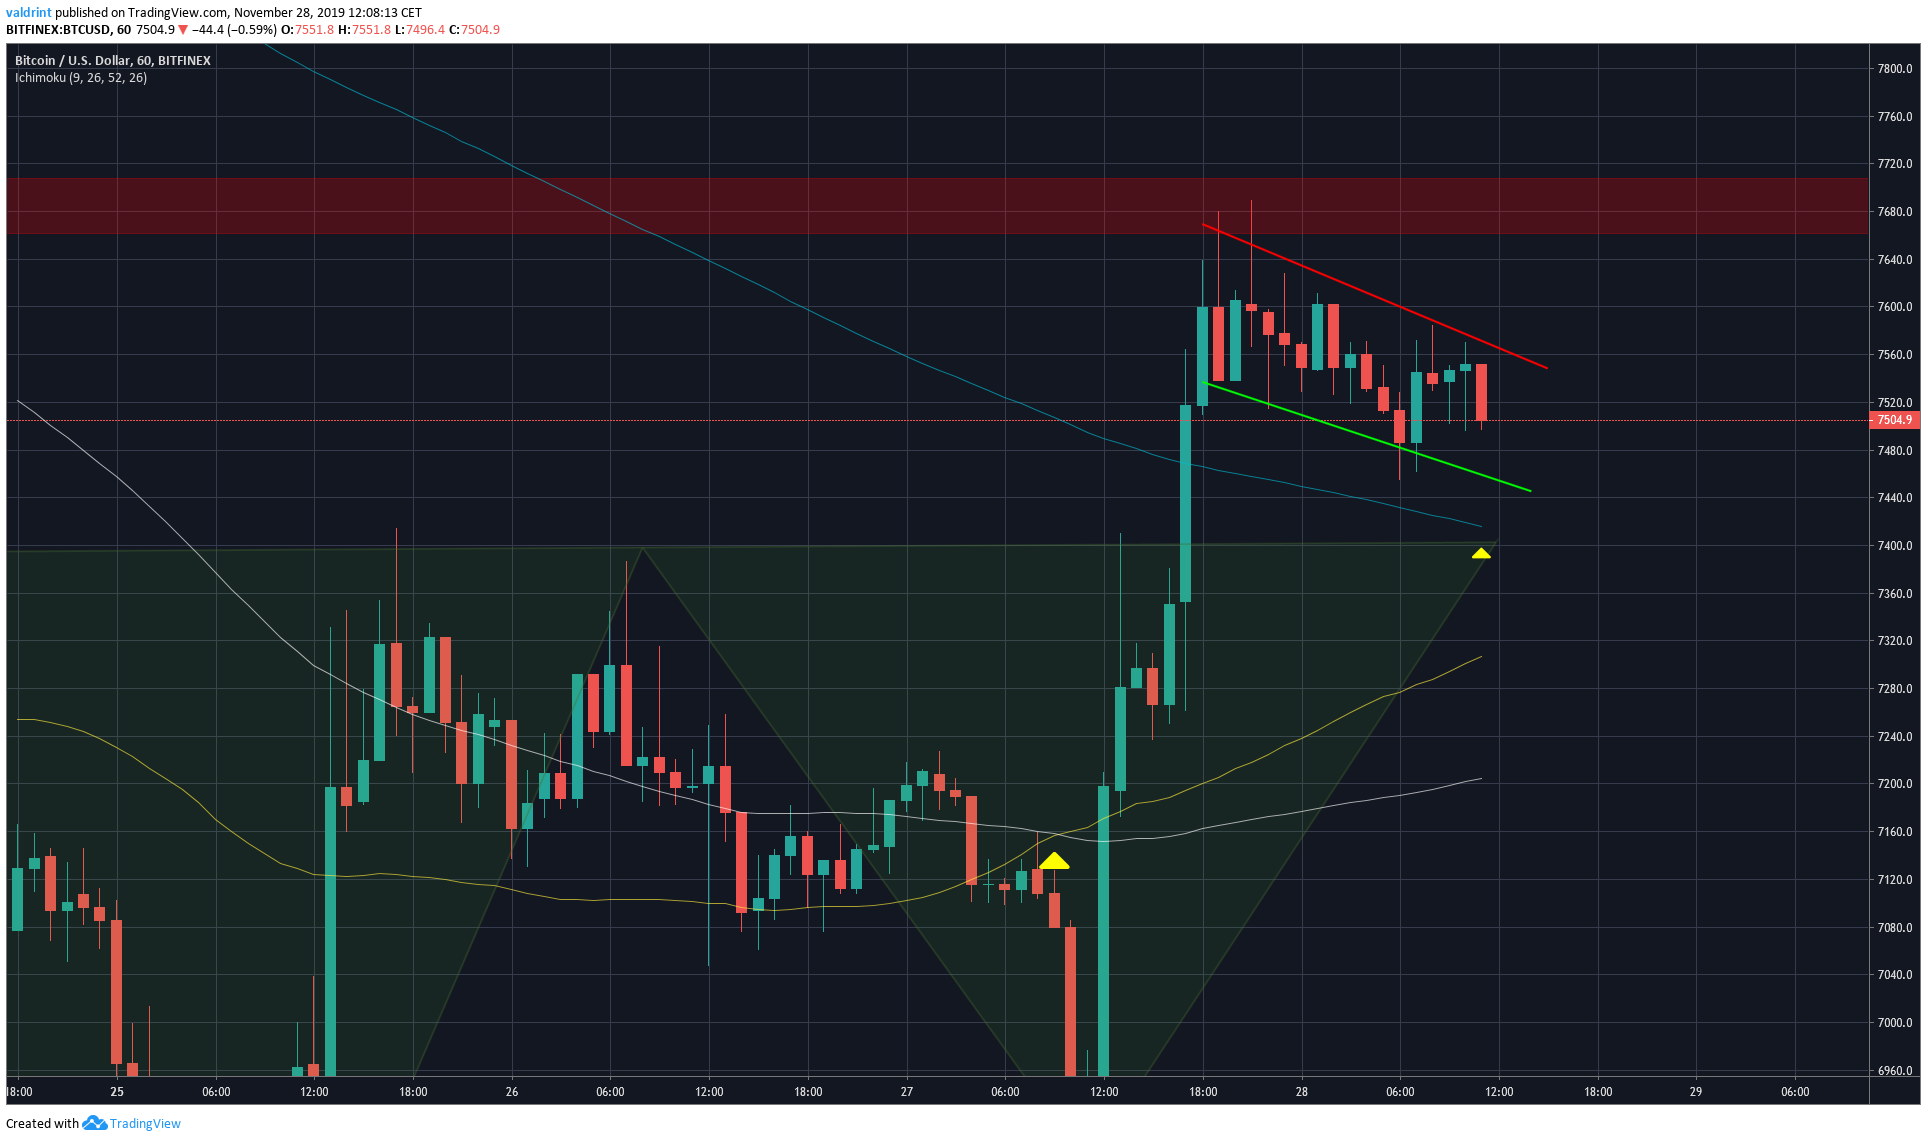
The Bitcoin price is trading inside a bullish flag and in the process of retesting the neckline.
Bitcoin Pattern Breakout
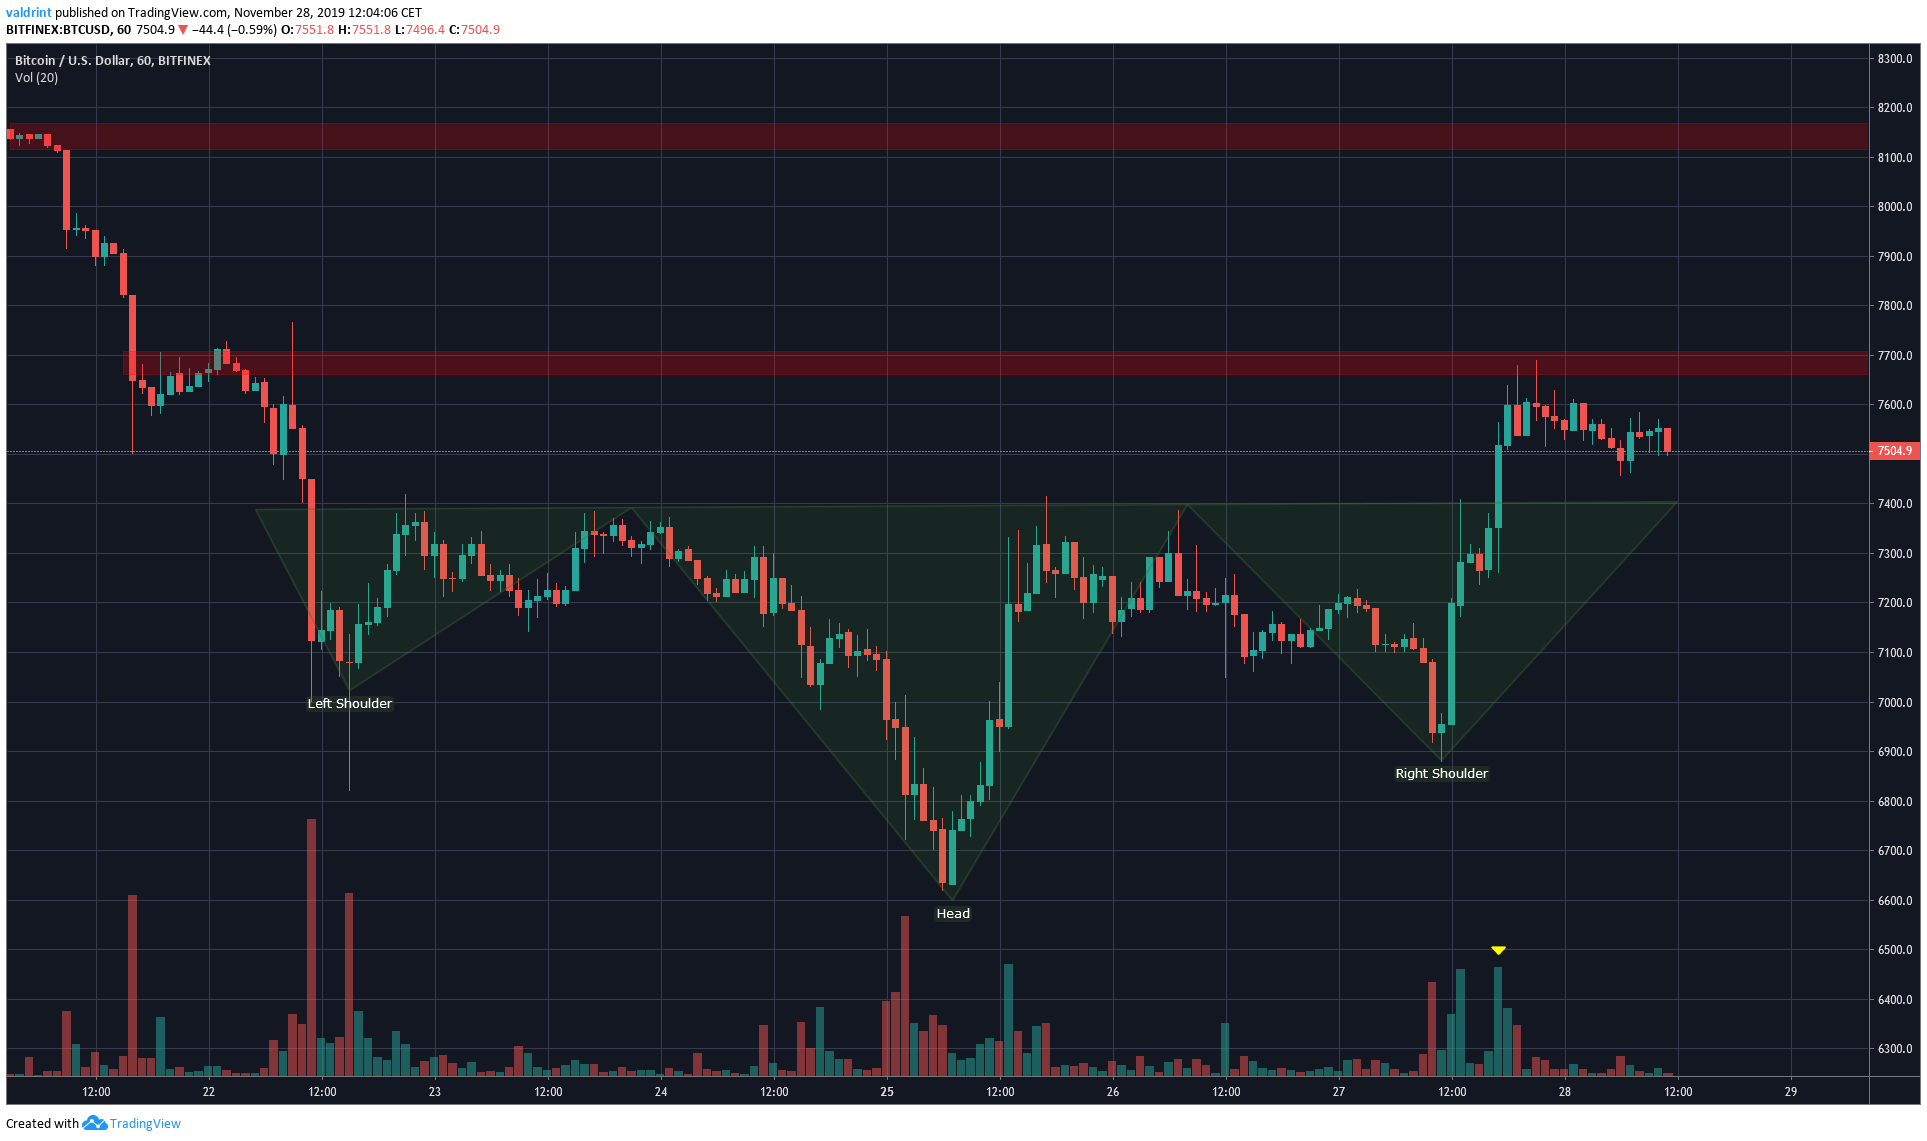
The Bitcoin price has been trading inside an inverse head and shoulders pattern since September 22. It broke out from it yesterday, and reached the minor resistance area at $7700 before retracing. The next resistance area is found at $8100.
Currently, the Bitcoin price is in the process of retesting the neckline. If the price moves upward the entire length of the pattern, it should reach the second resistance area.
Looking closer at the price movement, we can see that BTC has moved above all of the 50-, 100- and 200-hour moving averages (MA). The 50- and 100- hour ones have made a bullish cross.
It is creating a bull flag, which very often leads to a breakout. Additionally, there is no bearish divergence yet in the RSI in order to diminish the chances of a breakout.
Future Movement
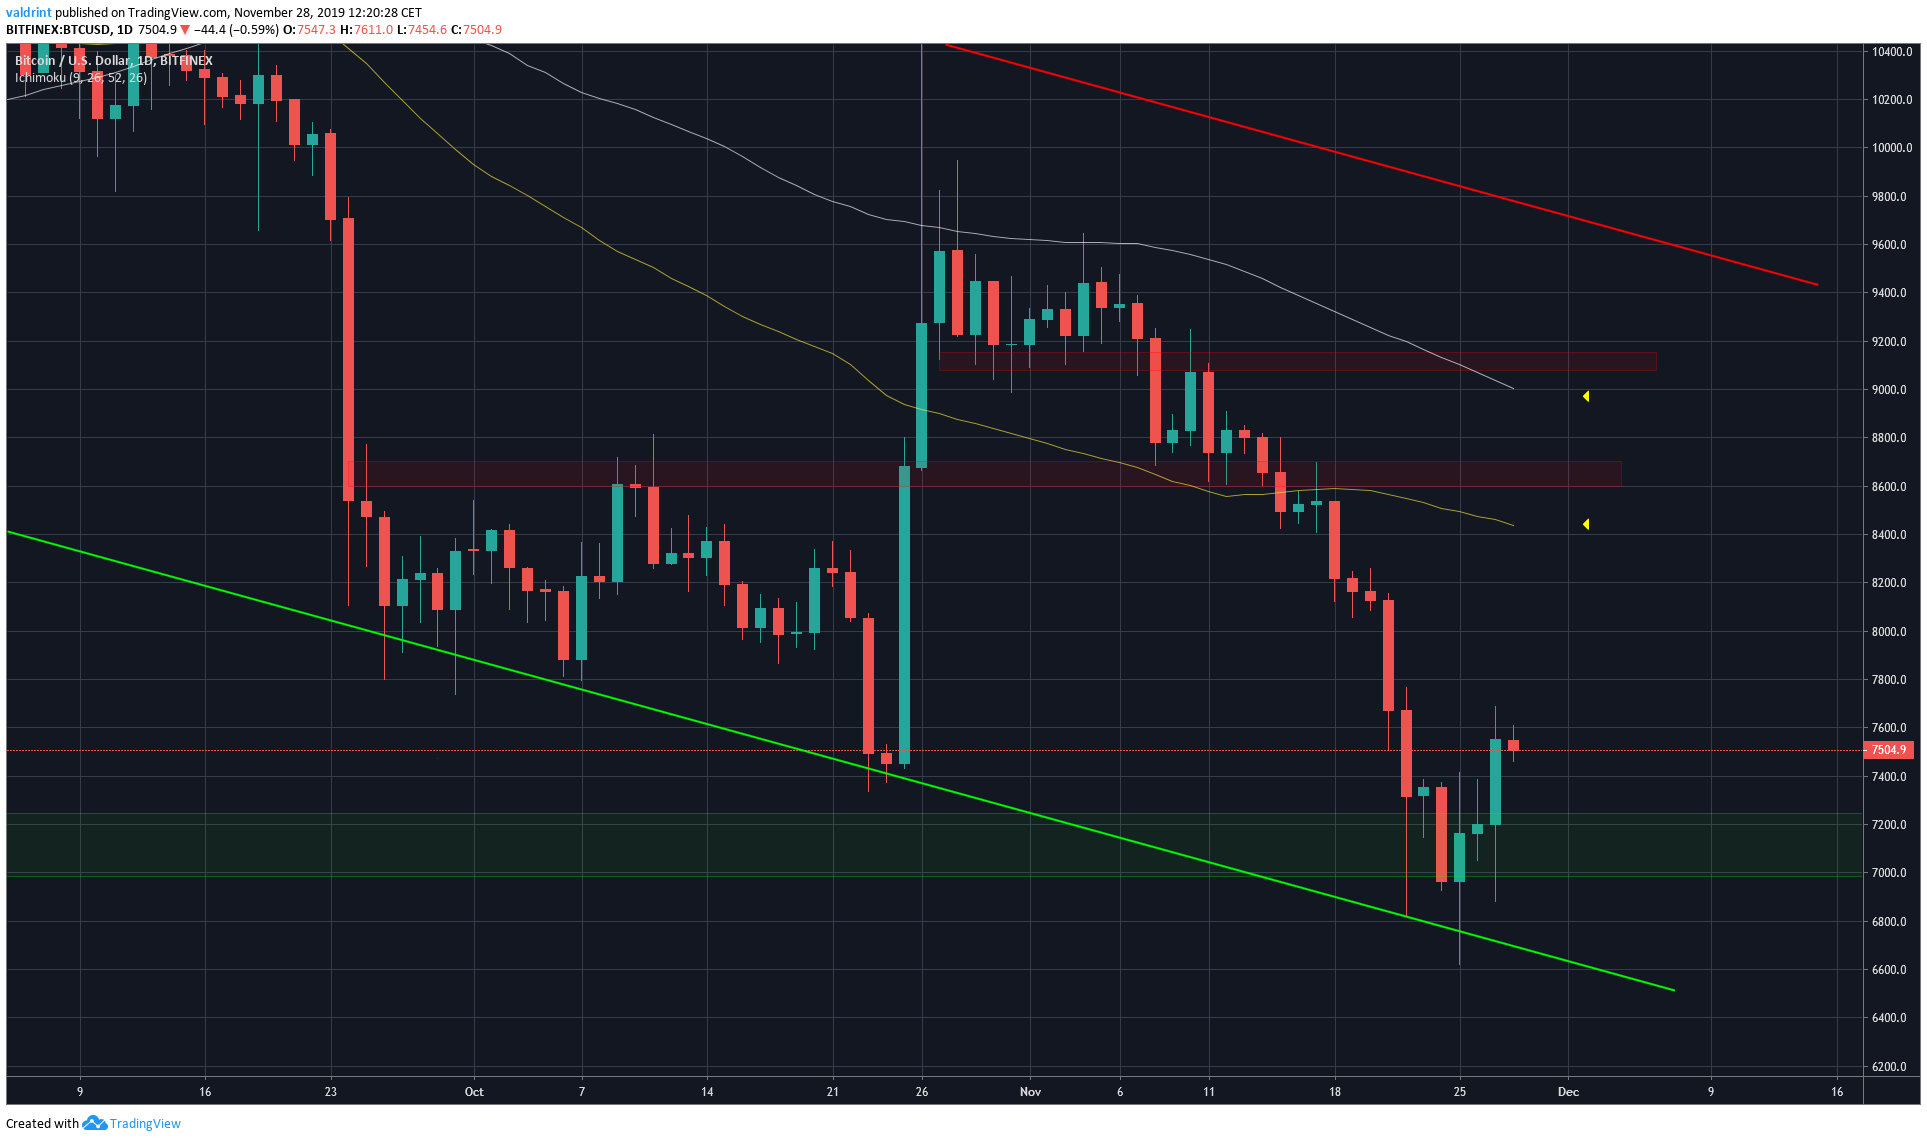
Looking at higher time-frames, we can see that BTC is trading inside a descending channel. While the increase since November 25 has been strong, it pales in comparison to the previous downward move.
Additionally, very strong resistance is found between $8000-$9000 strengthened by the presence of the 50- and 100-day MAs.
Similar resistance levels are given by Scott Melker. The resistance is found by significant Fib levels, further solidifying the difficulty of the price moving above all of them.
$BTC 4 Hour
Quite the breakout while I was gone. Just pulled Fibonacci levels for the entire drop from 10K+. The 38.2% retracement up is in confluence with the next key resistance drawn on my chart. Good area to think about taking some profit if we get there (green box). pic.twitter.com/3aMrcsa7bk
— The Wolf Of All Streets (@scottmelker) November 27, 2019
To conclude, the Bitcoin price recently broke out from its trading pattern. While the breakout was significant, there are several important resistance levels that need to be broken for the price to begin an uptrend.
Disclaimer: This article is not trading advice and should not be construed as such. Always consult a trained financial professional before investing in cryptocurrencies, as the market is particularly volatile.


