


The Bitcoin Dominance Rate (BTCD) reached the 41% support area on Sept. 4 and has initiated a slight bounce.
However, there are no definite bullish reversal signs yet and the bearish structure still remains intact.
Ongoing BTCD descent
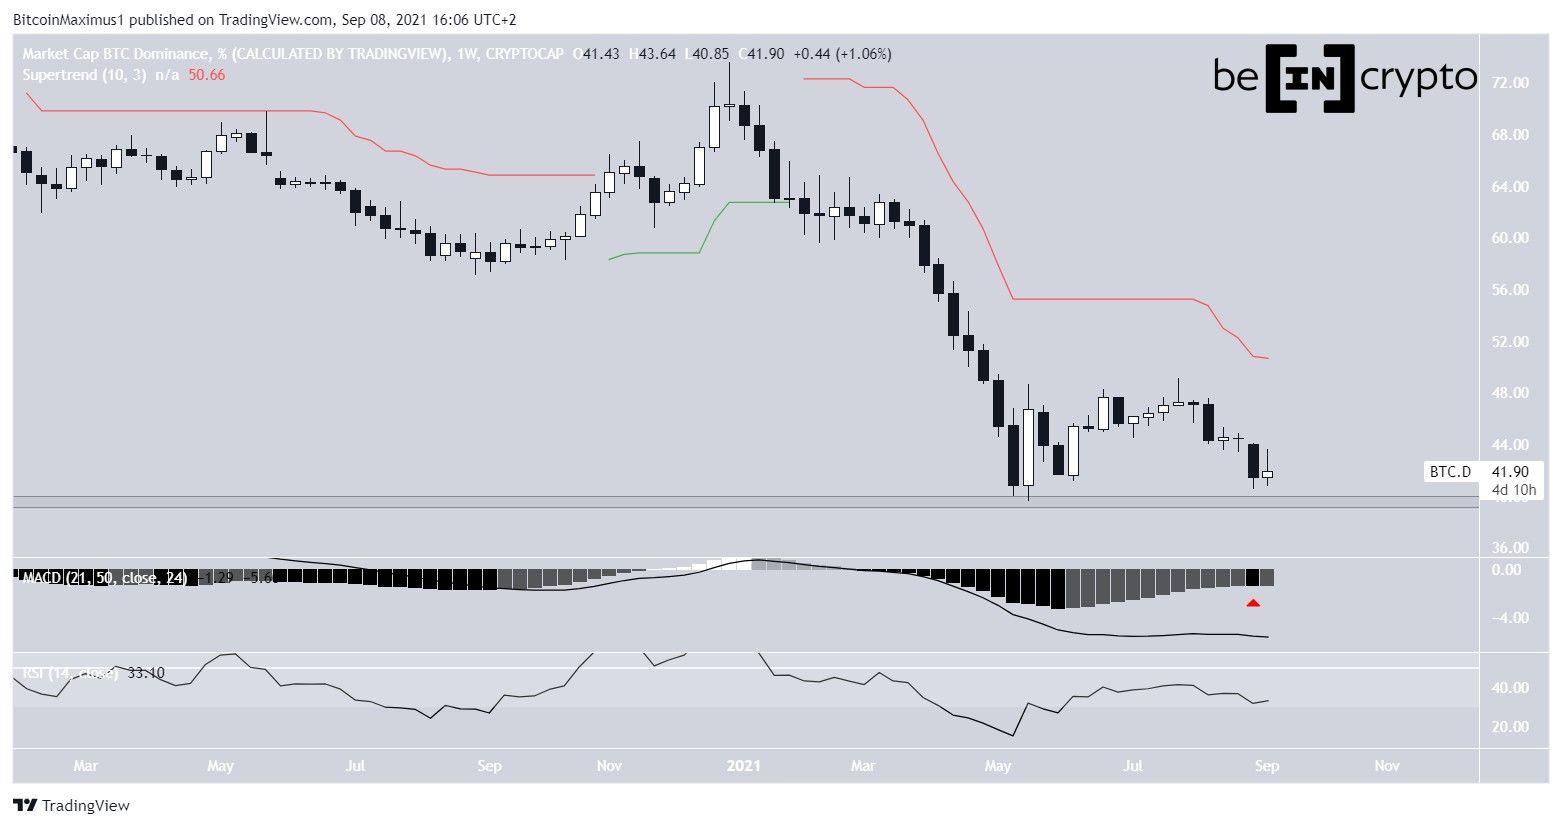
BTCD has been decreasing since reaching a high of 73.65% on Jan 3. The downward movement continued until a low of 39.66% was reached on May 19.
A bounce ensued afterwards, which however was short-lived.
Technical indicators are still bearish. The RSI is below 50 and the MACD is negative. While the latter had begun to move upwards, it created a lower momentum bar last week (red icon).
In addition to this, the Supertrend is negative.
Therefore, it is likely that the long-term trend is still bearish.
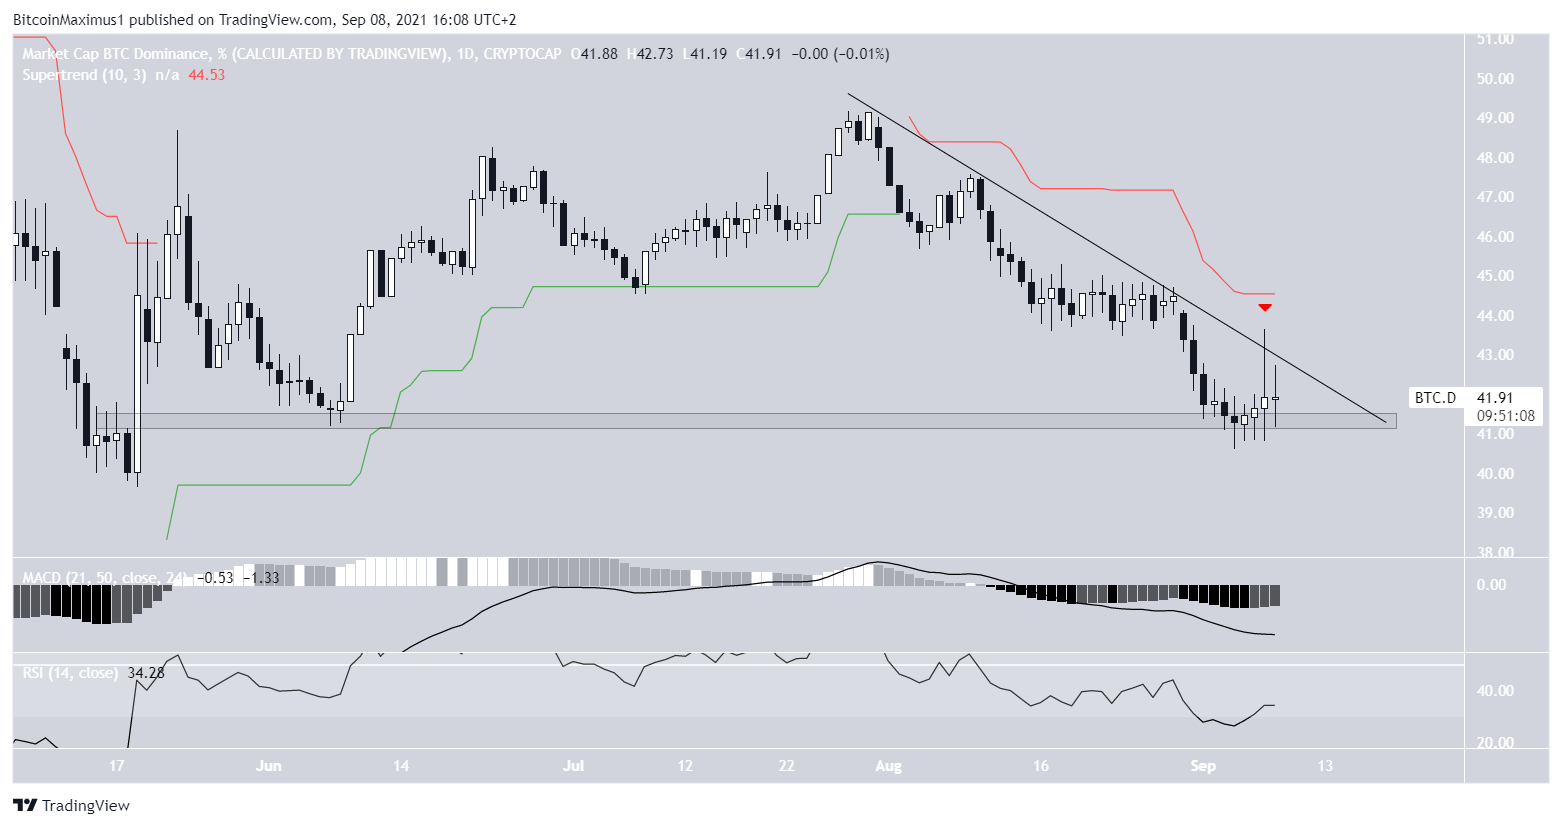
The daily chart shows that BTCD has also been following a descending resistance line since July 25. Yesterday, it was rejected by the line for the fourth time.
Similarly, the MACD and RSI are both bearish. The former is negative, while the latter is below 50. Also, the Supertrend is bearish (red line).
There is a minor support level at 41%. A breakdown below it would likely take BTCD towards a new all-time low.
Cryptocurrency trader @CryptoNewton outlined a BTCD chart, stating that a bounce is likely.
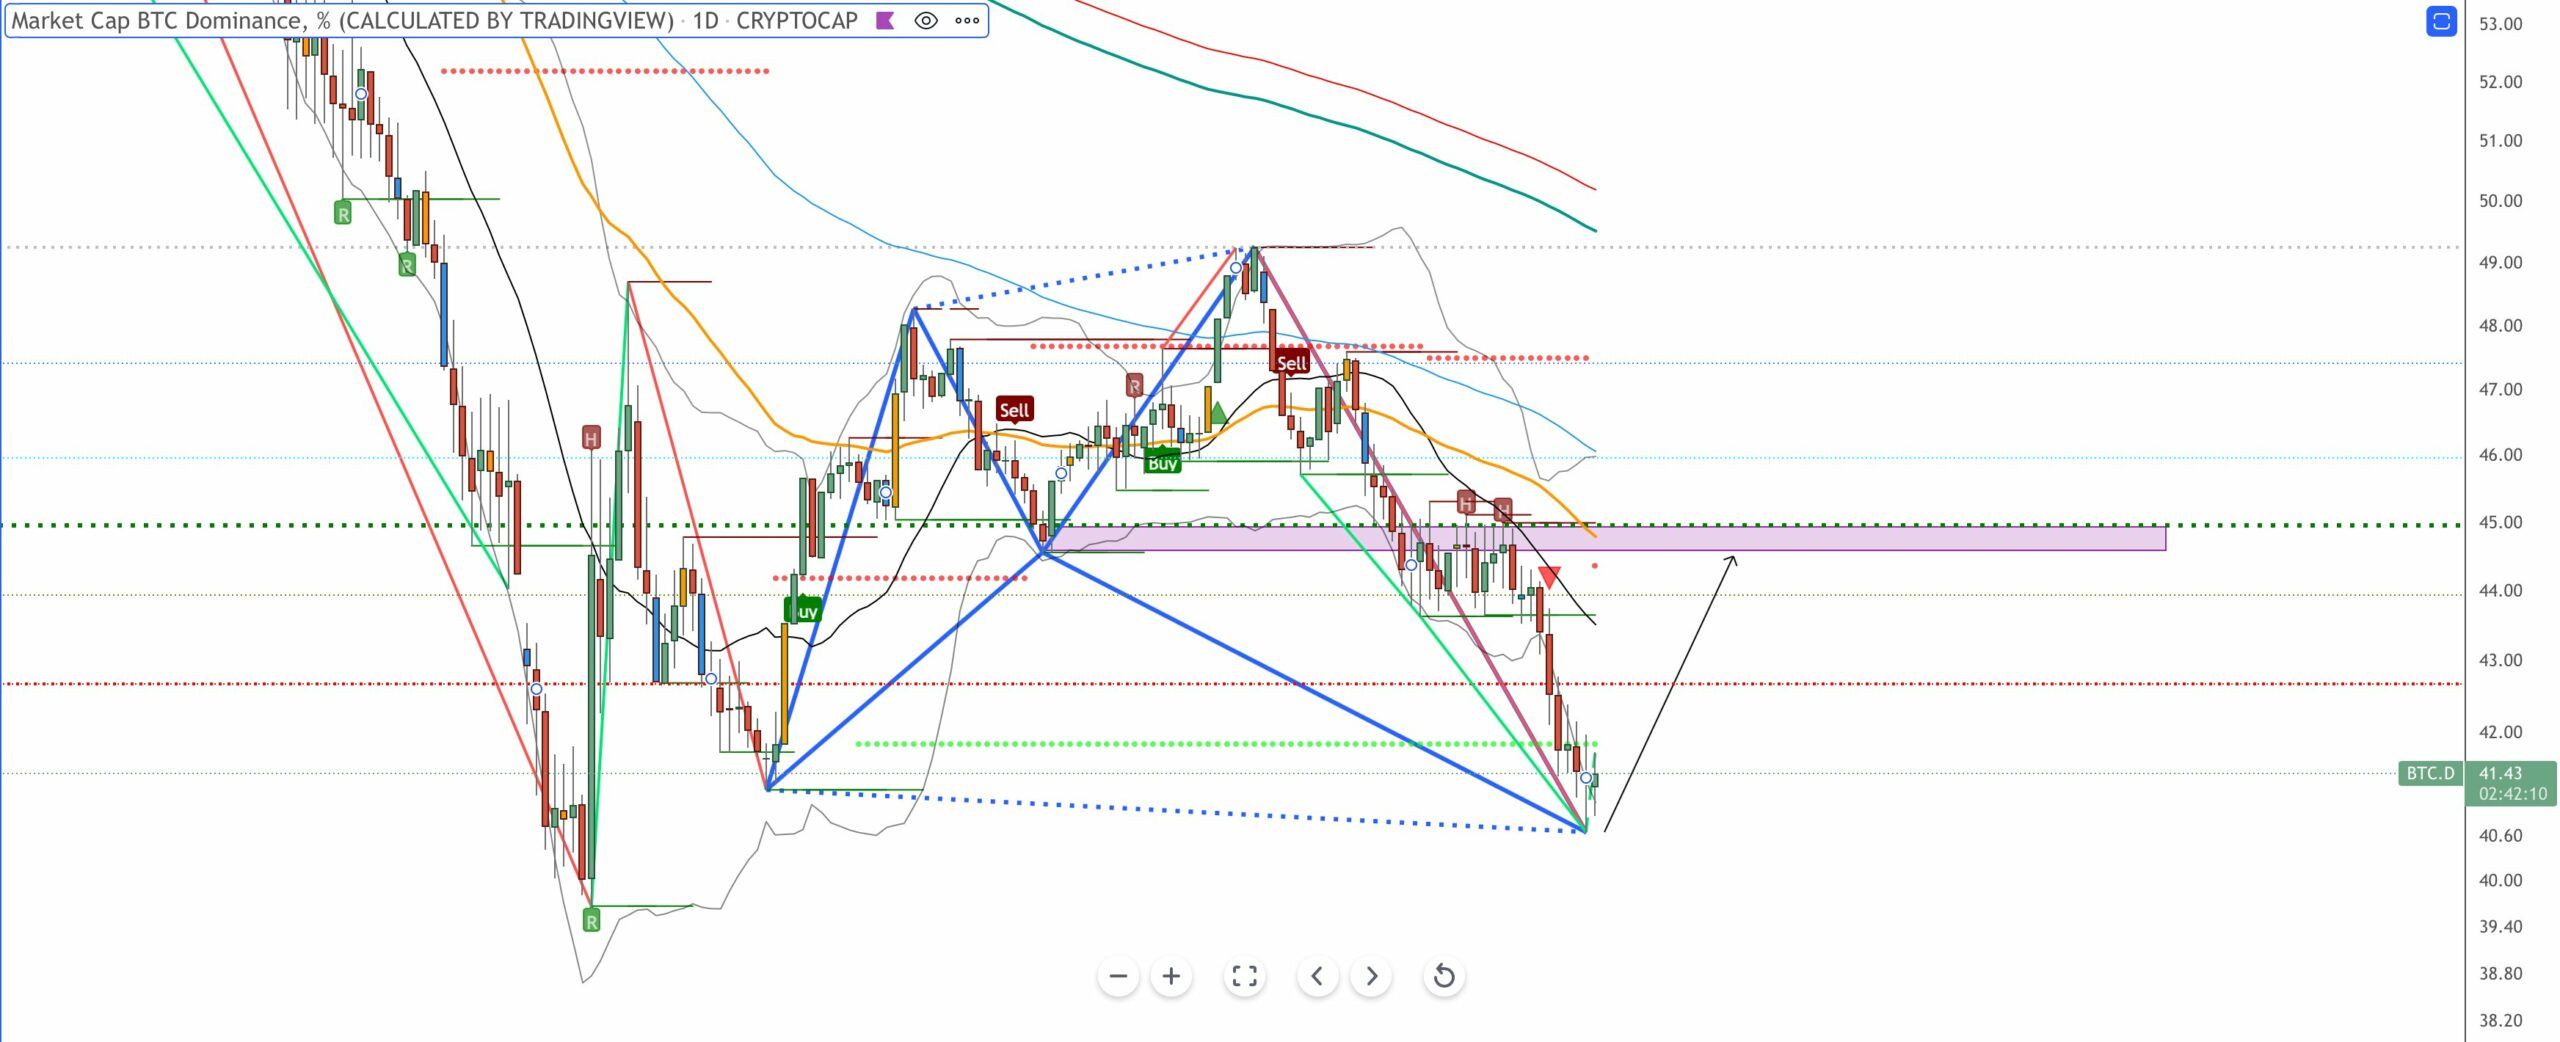
While the bounce has occurred, BTCD has yet to break out from the aforementioned descending resistance line. Furthermore, the wave count suggests that there is one more low to come.
Short-term movement
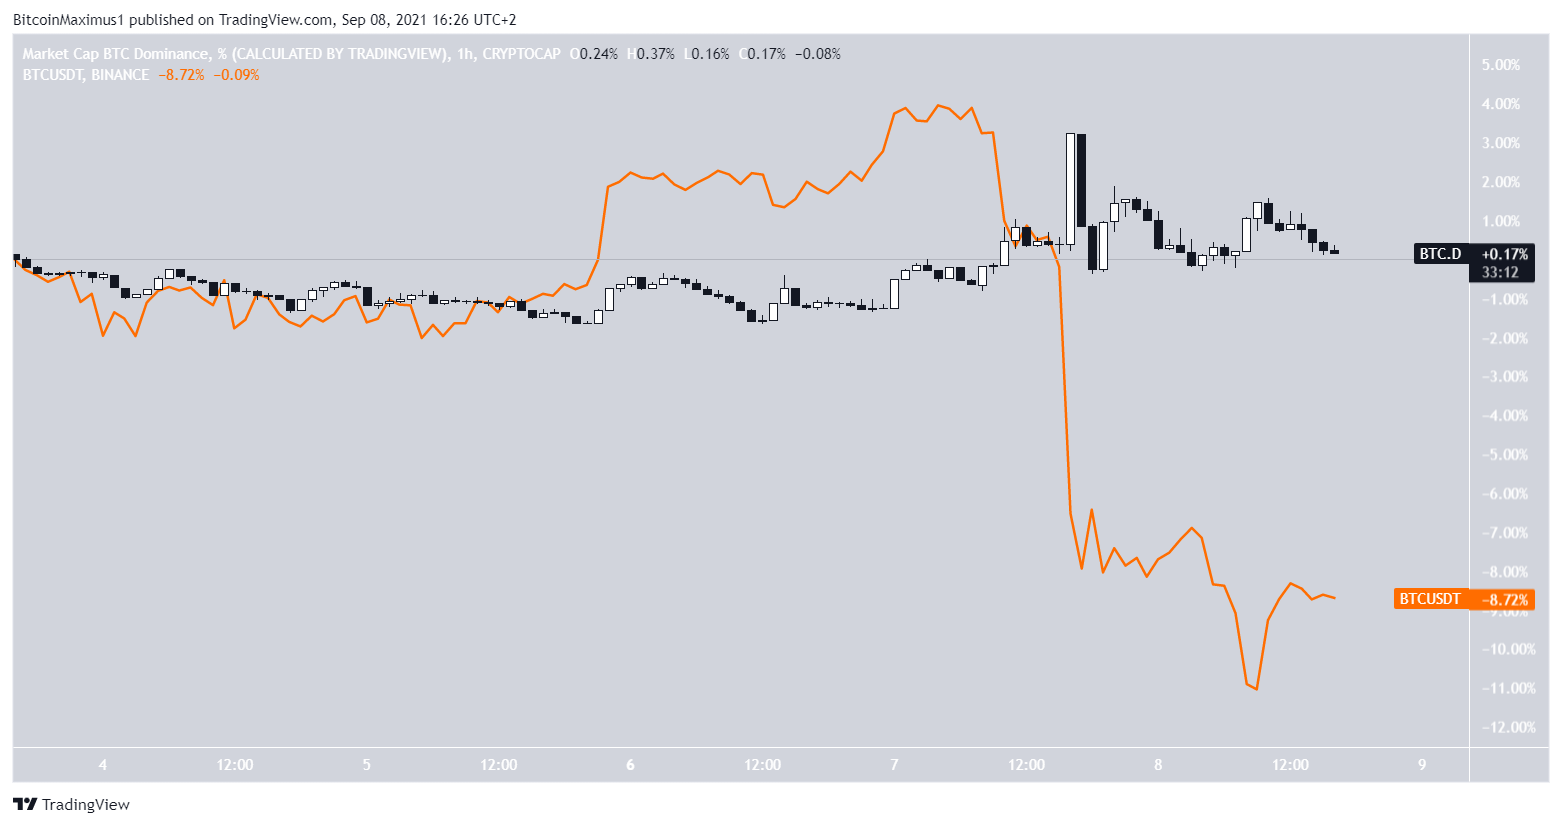
In the beginning of September, BTC had a positive relationship with BTCD. This means that an increase in one also caused an increase in the other.
However, since the sharp fall on Sept. 7, the relationship has turned negative. Therefore, a BTC price increase is causing BTCD to fall and vice versa.
For BeInCrypto’s latest Bitcoin (BTC) analysis, click here.



