
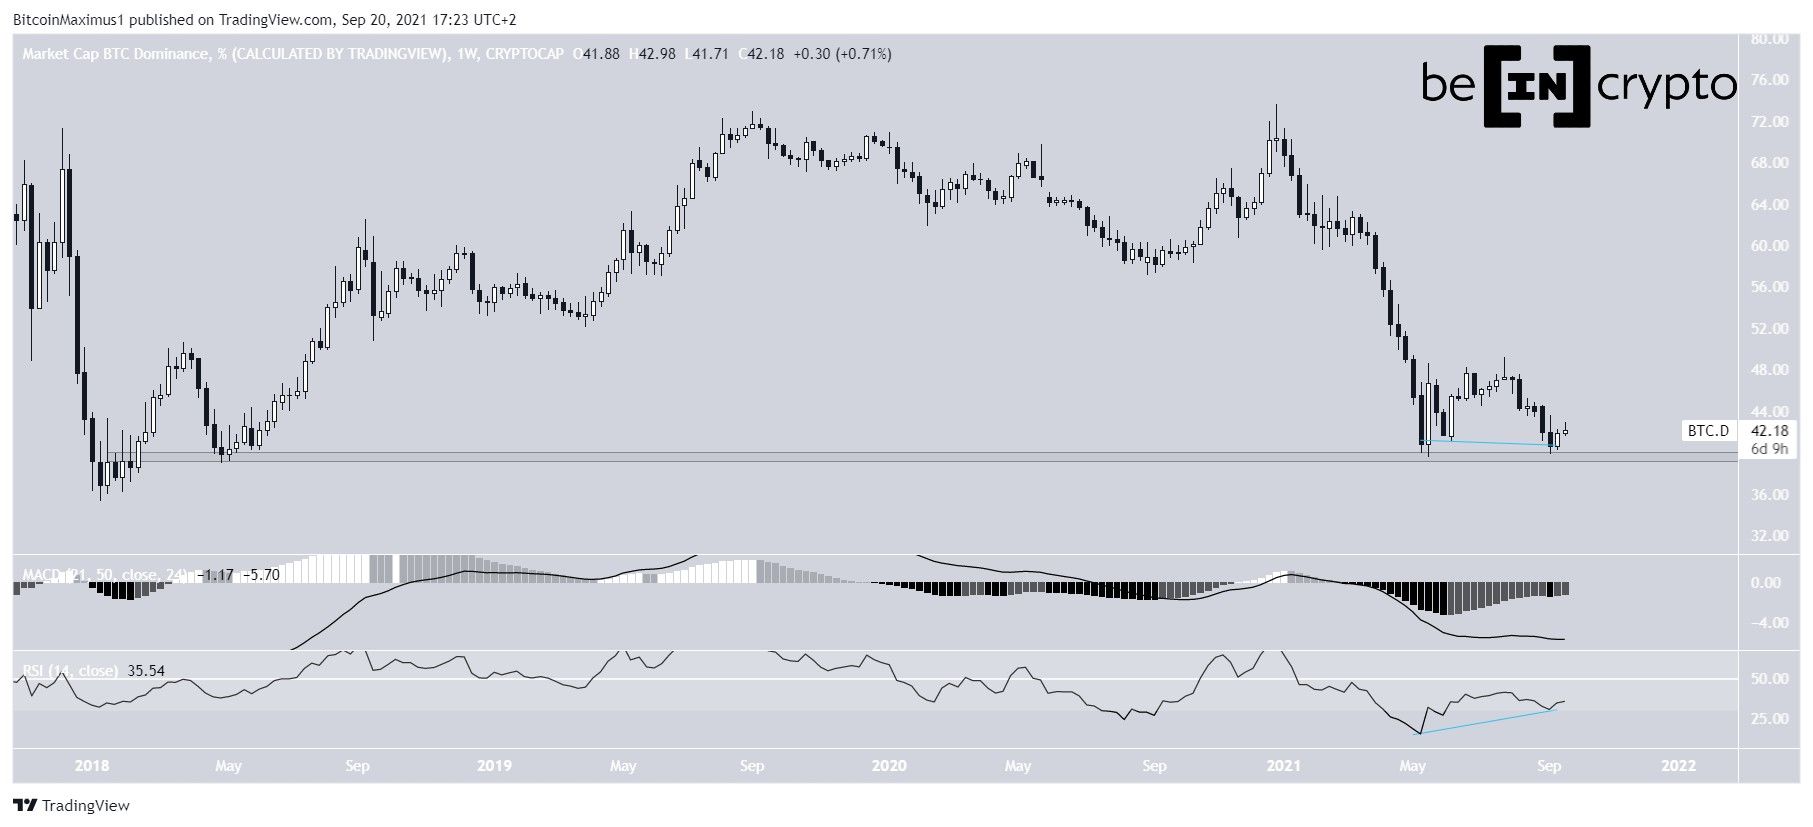
The Bitcoin dominance rate (BTCD) has created a long-term double bottom pattern close to the 39.50% long-term support area.
It broke out from a descending resistance line afterwards and is moving towards the 44.50% resistance area.
Long-term double bottom
BTCD has been decreasing since it reached a high of 73.65% in January. So far, it has reached a low of 39.66%, doing so on May 19.
After a bounce, it returned to the same level, potentially creating a double bottom pattern. While the pattern is combined with bullish divergence in the RSI, the MACD is still bearish.
Furthermore, the bounce has been weak so far.
Therefore, despite the possibility of a bullish pattern, the bullish reversal is not yet confirmed.
Future BTCD movement
Cryptocurrency trader @TradingTank outlined a BTCD chart, stating that a short-term upward movement towards at least 42.5% is likely.
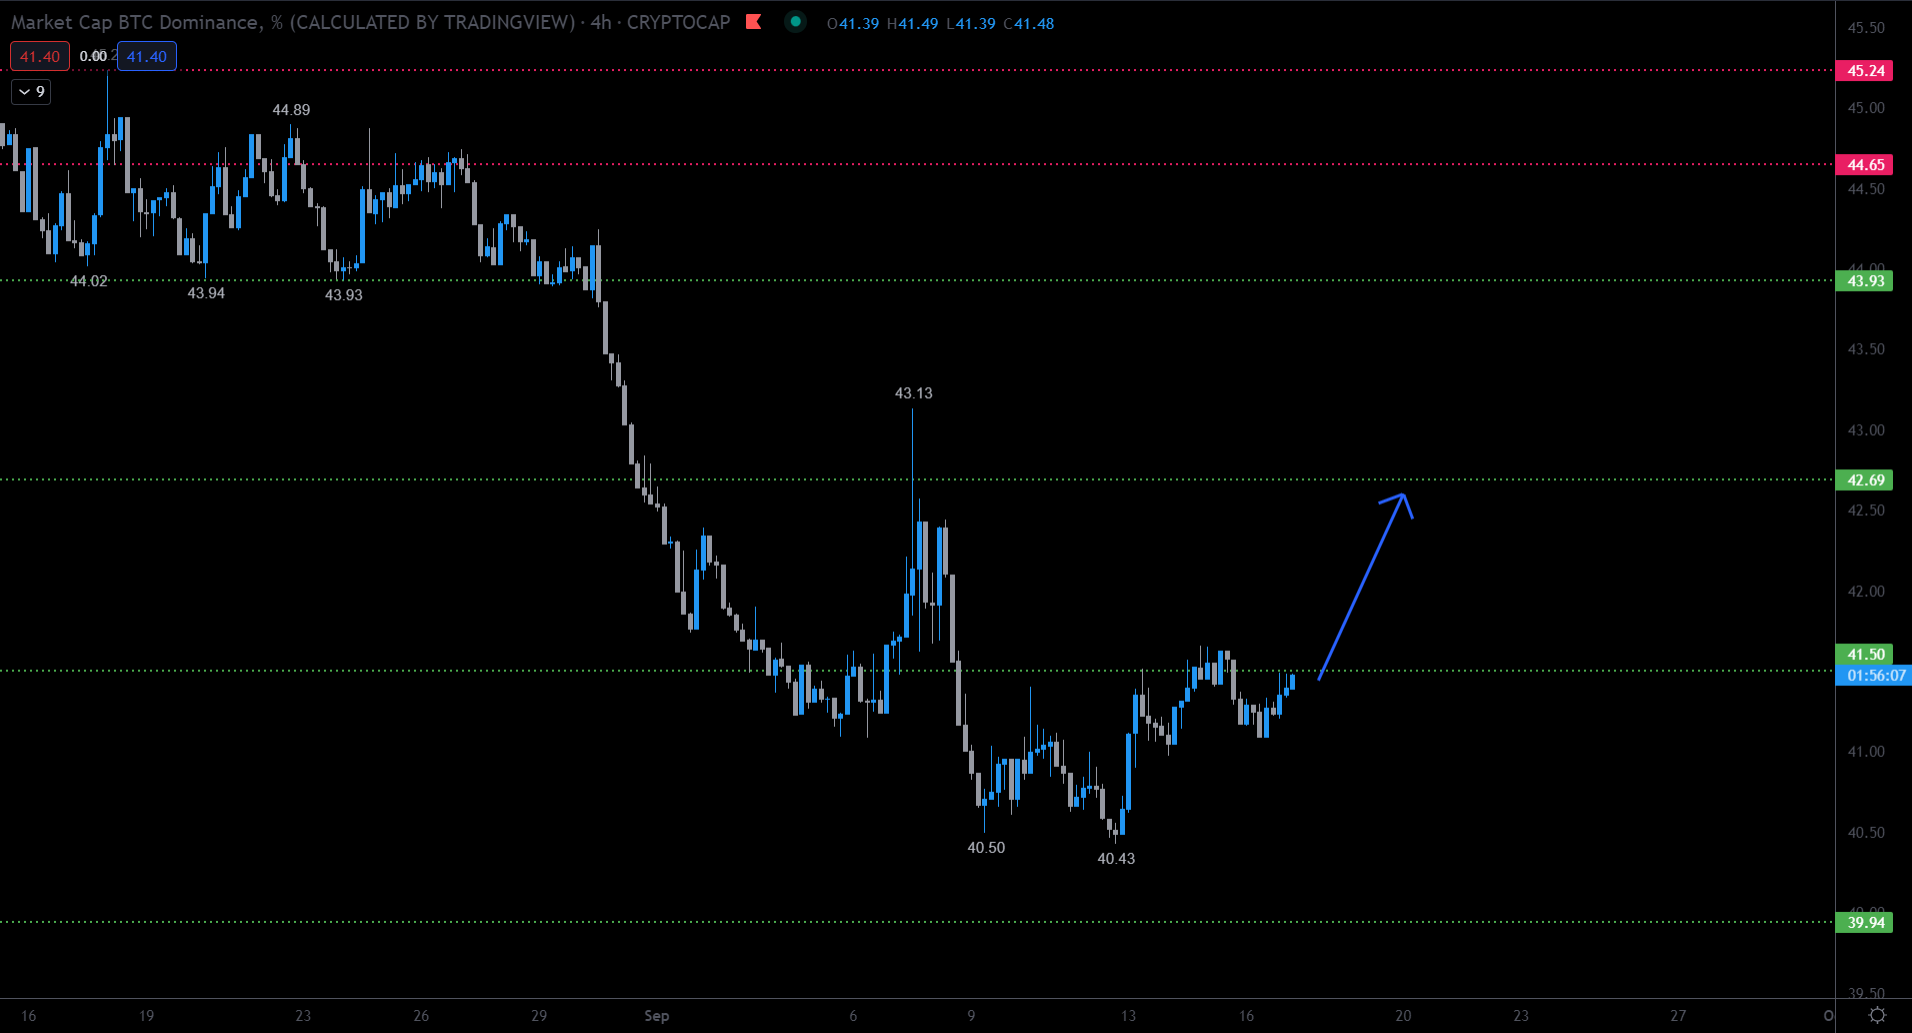
The daily chart shows that BTCD has broken out from a descending resistance line after the previously outlined bounce.
Indicators are turning bullish, but have yet to confirm the bullish reversal. The MACD and RSI are both increasing, but the former is still negative while the latter is below 50.
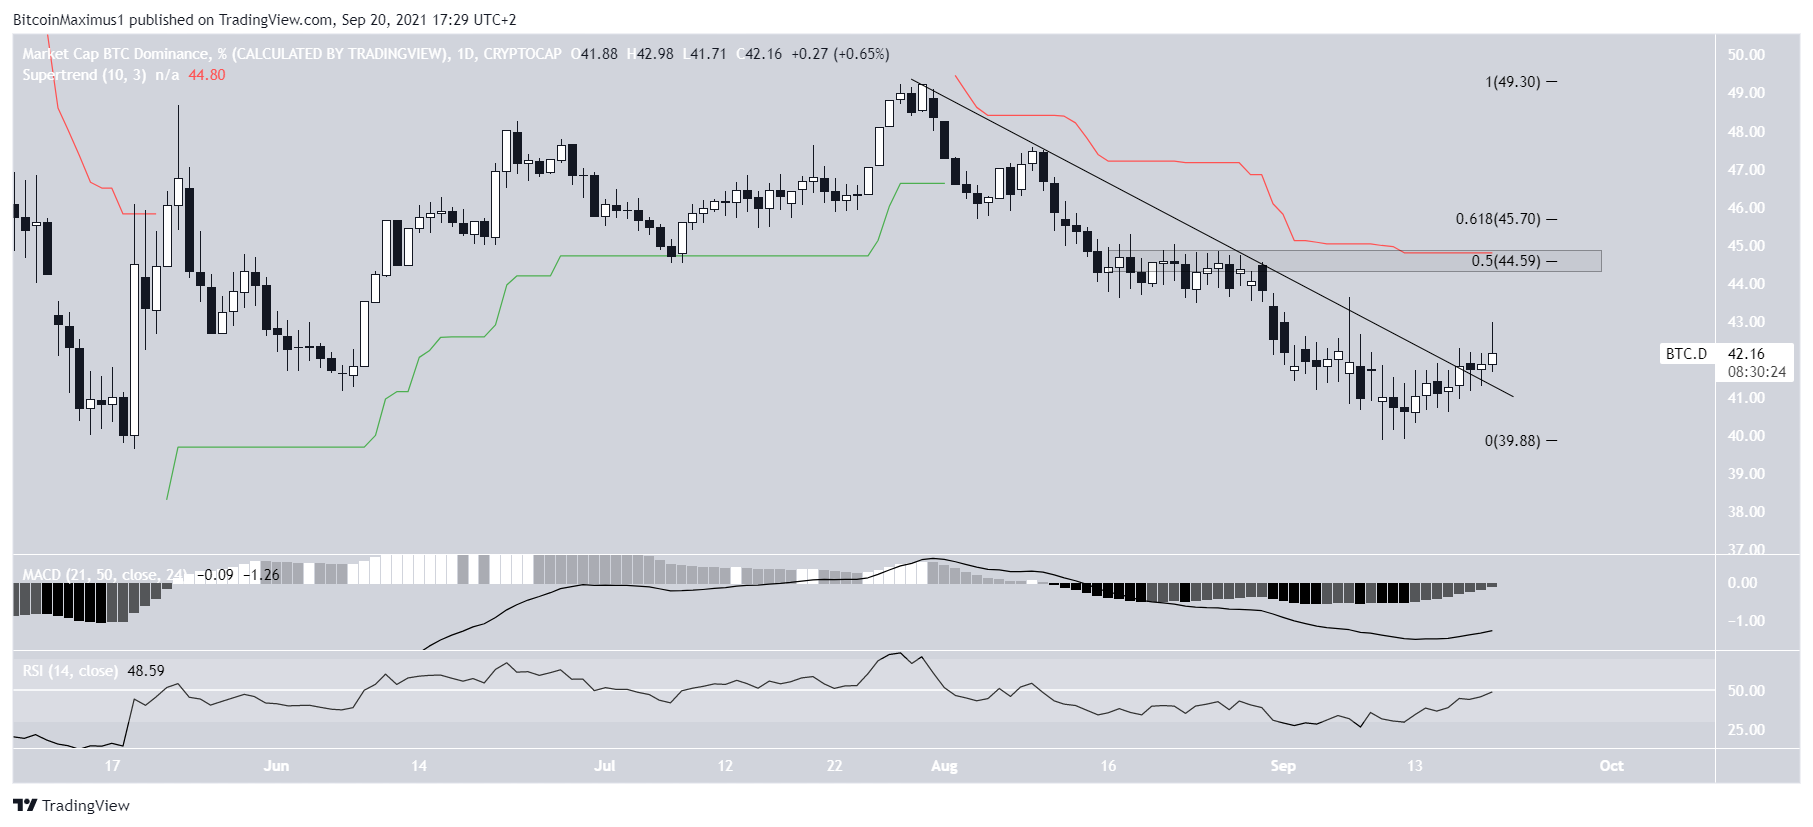
There is a very strong resistance area at 44.50%. It is created by the 0.5 Fib retracement resistance level, the Supertrend line (red) and a horizontal resistance area.
Therefore, until this area is reclaimed, the trend cannot be considered bullish.
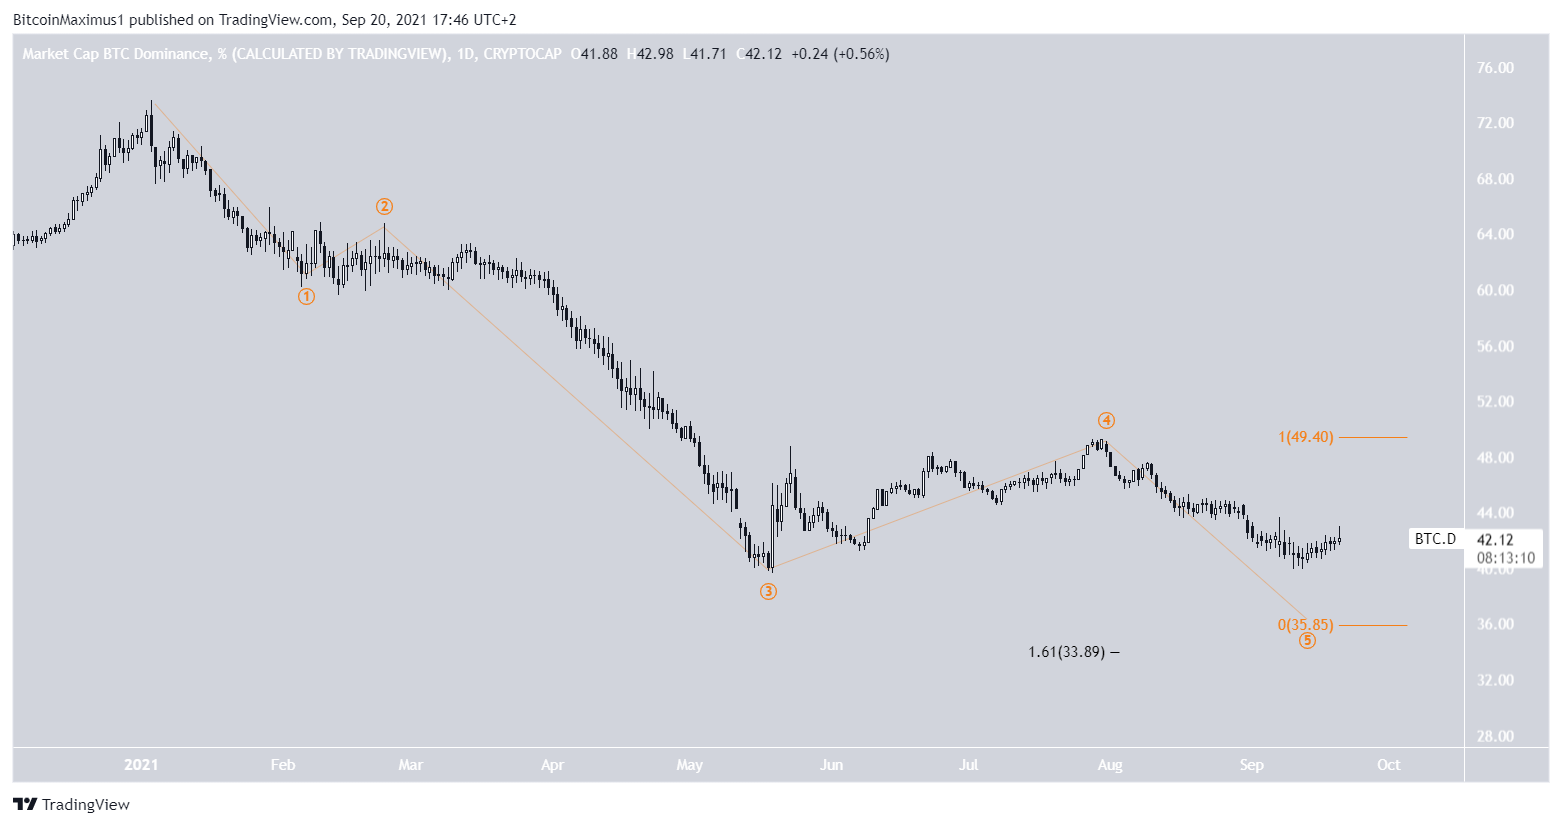
Wave count
The most likely wave count indicates that the ongoing decrease is part of wave five (orange) of a bearish impulse.
The most likely downside target for this movement is between 33.89% and 35.85%. The target is found by using an external retracement on wave four (black) and the length of wave one (orange).
This would lead to a new all-time low, after which a considerable upward movement would be likely.
For BeInCrypto’s latest Bitcoin (BTC) analysis, click here.
What do you think about this subject? Write to us and tell us!
