


The long-term outlook for the Bitcoin (BTC) price is decisively bullish but the short-term trend is still undecided.
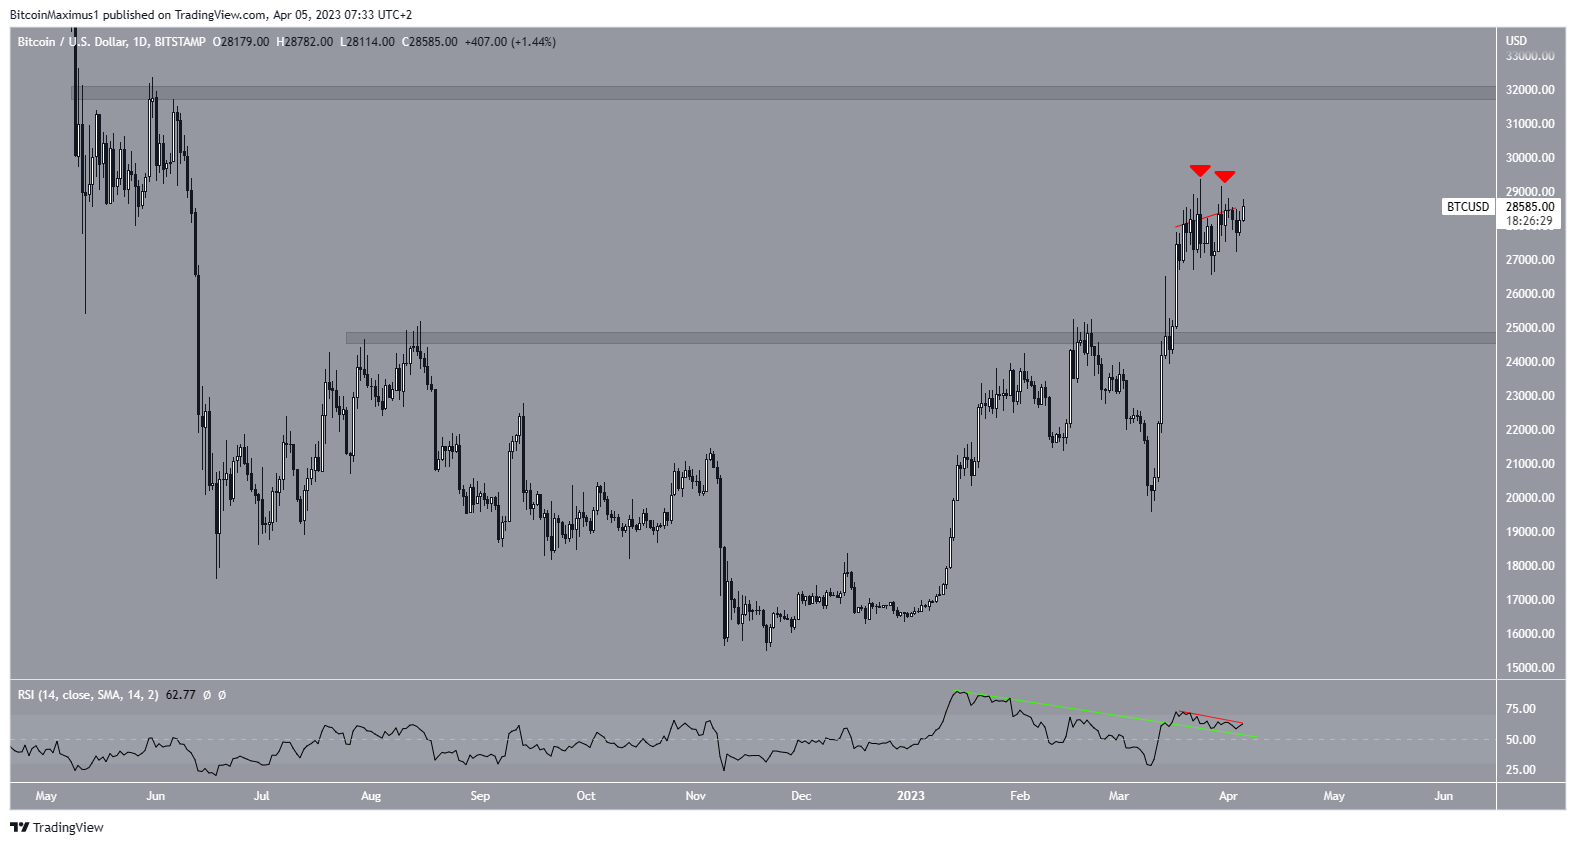
The daily time frame readings for the Bitcoin price give conflicting signals. On the bullish side, the price broke out from the $24,800 resistance area. Then, it reached a new yearly high of $29,380 on March 24. Moreover, the daily RSI broke out from its bearish divergence trendline (green line) and validated it as support.
However, the price has also created a double top pattern (red icons) combined with long upper wicks. This was compounded by a new bearish divergence in the RSI (red line).
Therefore, the conflicting signs make it unclear if the BTC price will increase to the next resistance at $31,800 or fall to the $24,800 support area.
It is worth mentioning a piece of negative Bitcoin news from April 4. Texas lawmakers passed “Bill 1751”, which greatly restricts Bitcoin miners’ operations.
Weekly Bitcoin (BTC) Price Outlook Remains Bullish
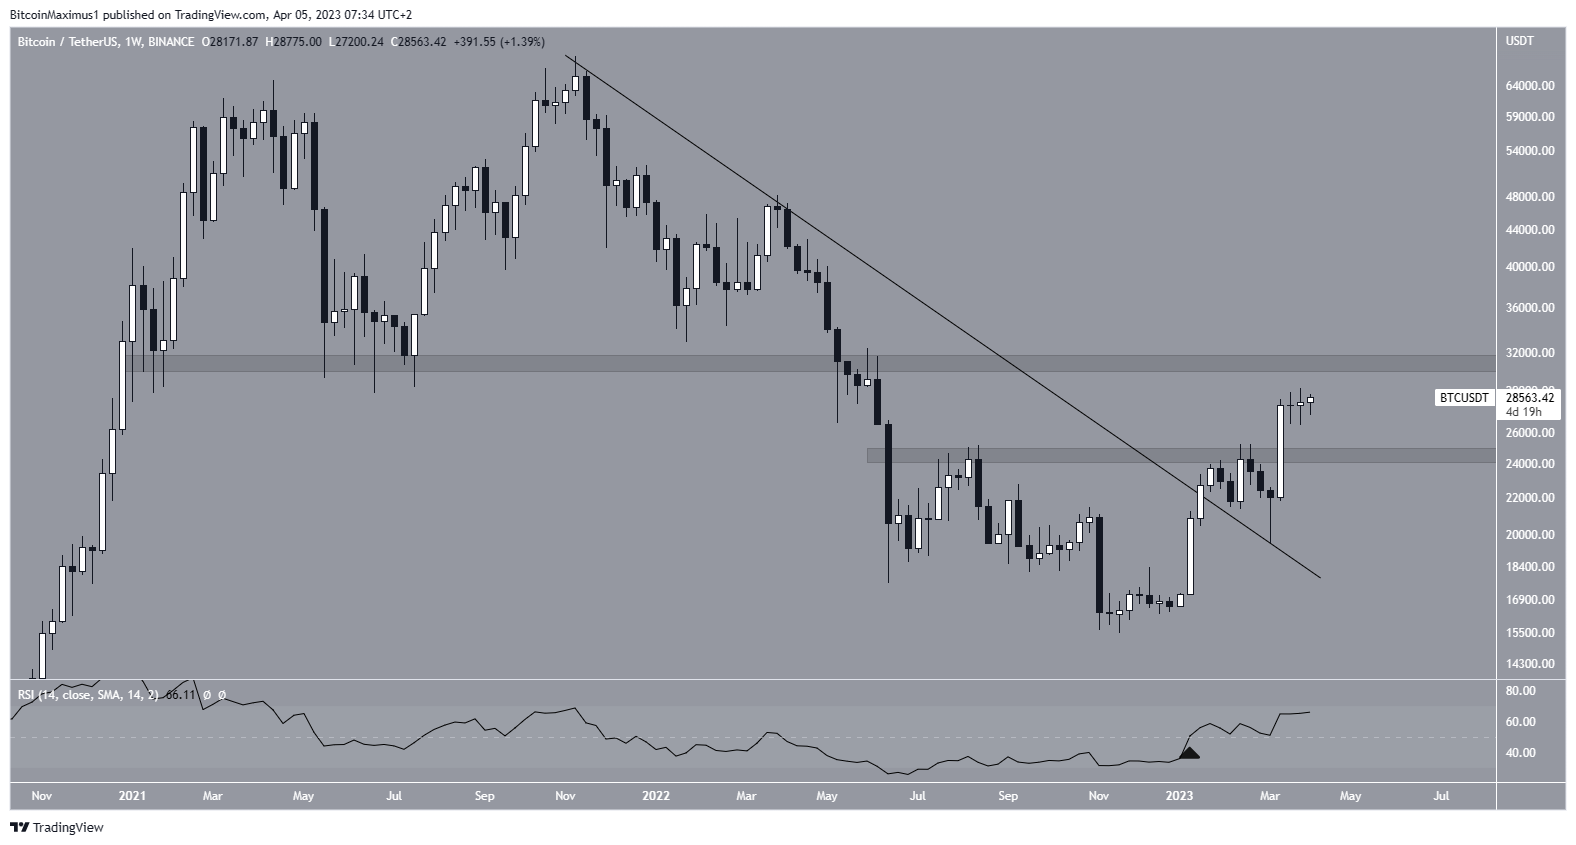
While the technical analysis from the daily time frame does not confirm the trend’s direction, the weekly outlook is decisively bullish. There are numerous reasons for this.
The BTC price broke out from a long-term descending resistance line that had existed since the all-time high. Then, it validated it during the week of March 6-13, creating a long lower wick (green icon) and a bullish engulfing candlestick next week. Finally, the weekly RSI moved above 50 (black icon) for the first time since June 2021.
As a result, the weekly time frame indicates that the price is expected to move toward its long-term resistance at $31,500, which aligns with the shorter-term one at $31,800.
On the other hand, a weekly close below $24,600 would invalidate this bullish forecast. If that occurs, the BTC price could decrease toward $20,000.
Bitcoin (BTC) Price Prediction for April: Rally or Correction?
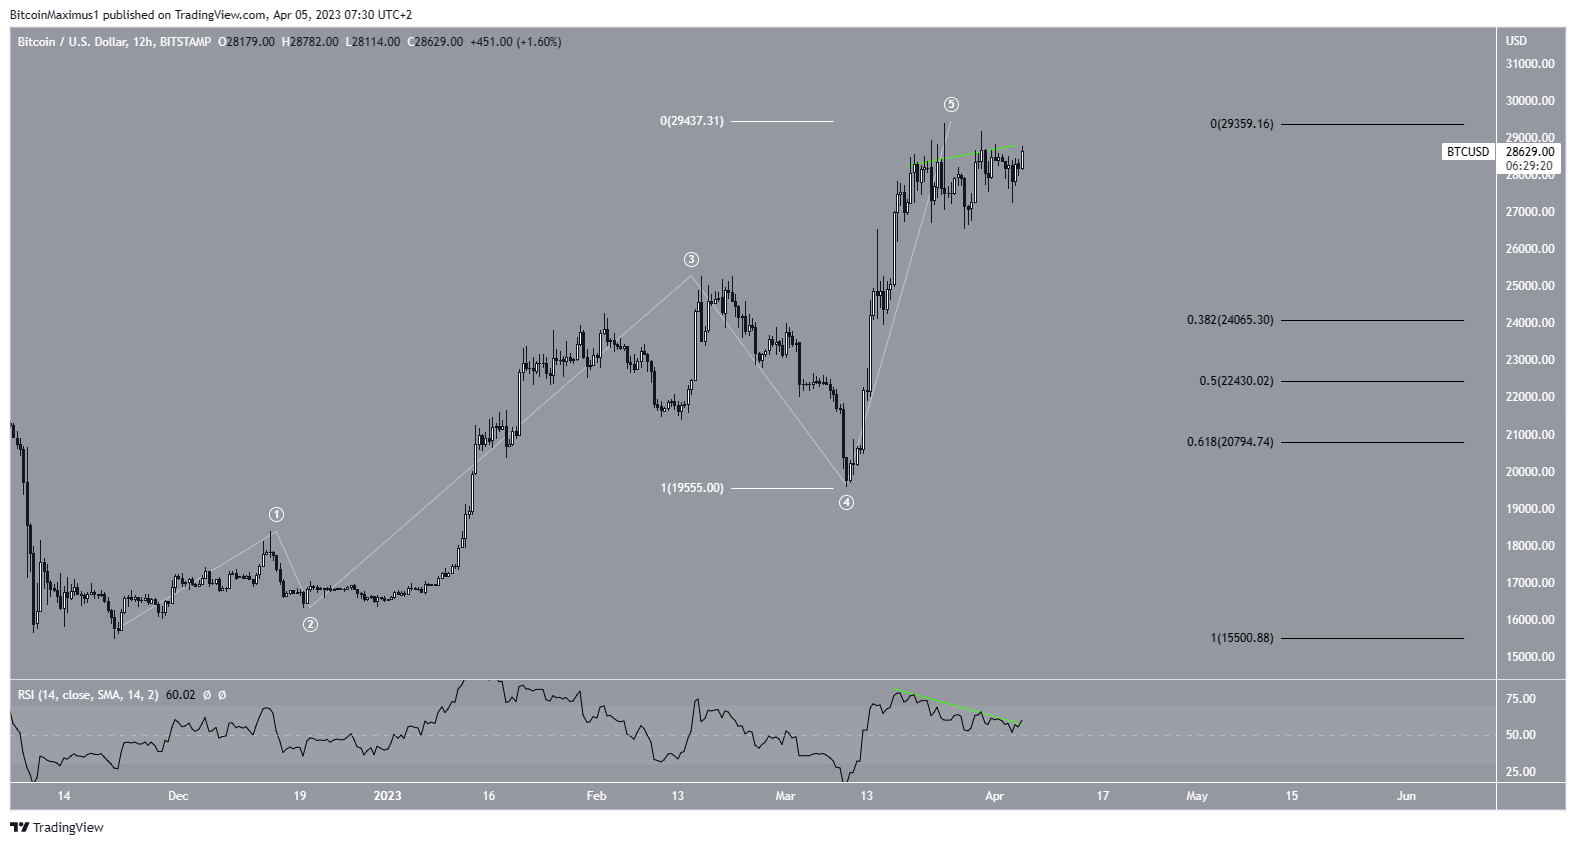
The Bitcoin price prediction for April is still undecided. The main reasons for this are the wave count and the previously outlined bearish divergence in the RSI.
The wave count shows that the BTC price has completed a five-wave upward movement (white). In it, wave five extended (white), reaching the same length as waves one and three combined. If the upward movement is complete, a significant correction will soon follow. This is also supported by the bearish divergence in the 12-hour RSI (green line).
In this case, the BTC price could fall to the 0.382 Fib retracement support level at $24,065, very close to the long-term support area.
However, if the daily RSI breaks its bearish divergence trendline, also causes a price pump. This will invalidate the bearish Bitcoin price prediction for April and could catalyze an increase toward $32,000.
To conclude, while most long-term Bitcoin price forecast is bullish, the short-term one is still undecided. Whether the price creates a new yearly high or gets rejected from the current level will go a long way in determining the direction of the short-term movement.
For BeInCrypto’s latest crypto market analysis, click here.


