


The Bitcoin (BTC) price is moving toward a long-term resistance area after finally breaking out above $30,000.
The outlook for Bitcoin in the coming week is optimistic for several reasons. One of the main factors is that the BTC price has broken out of a downward trend line that had been in place since it reached its all-time high, and this breakout was confirmed by a long lower wick and a bullish engulfing candlestick the following week. In addition, the weekly RSI has risen above 50 for the first time since June 2021.
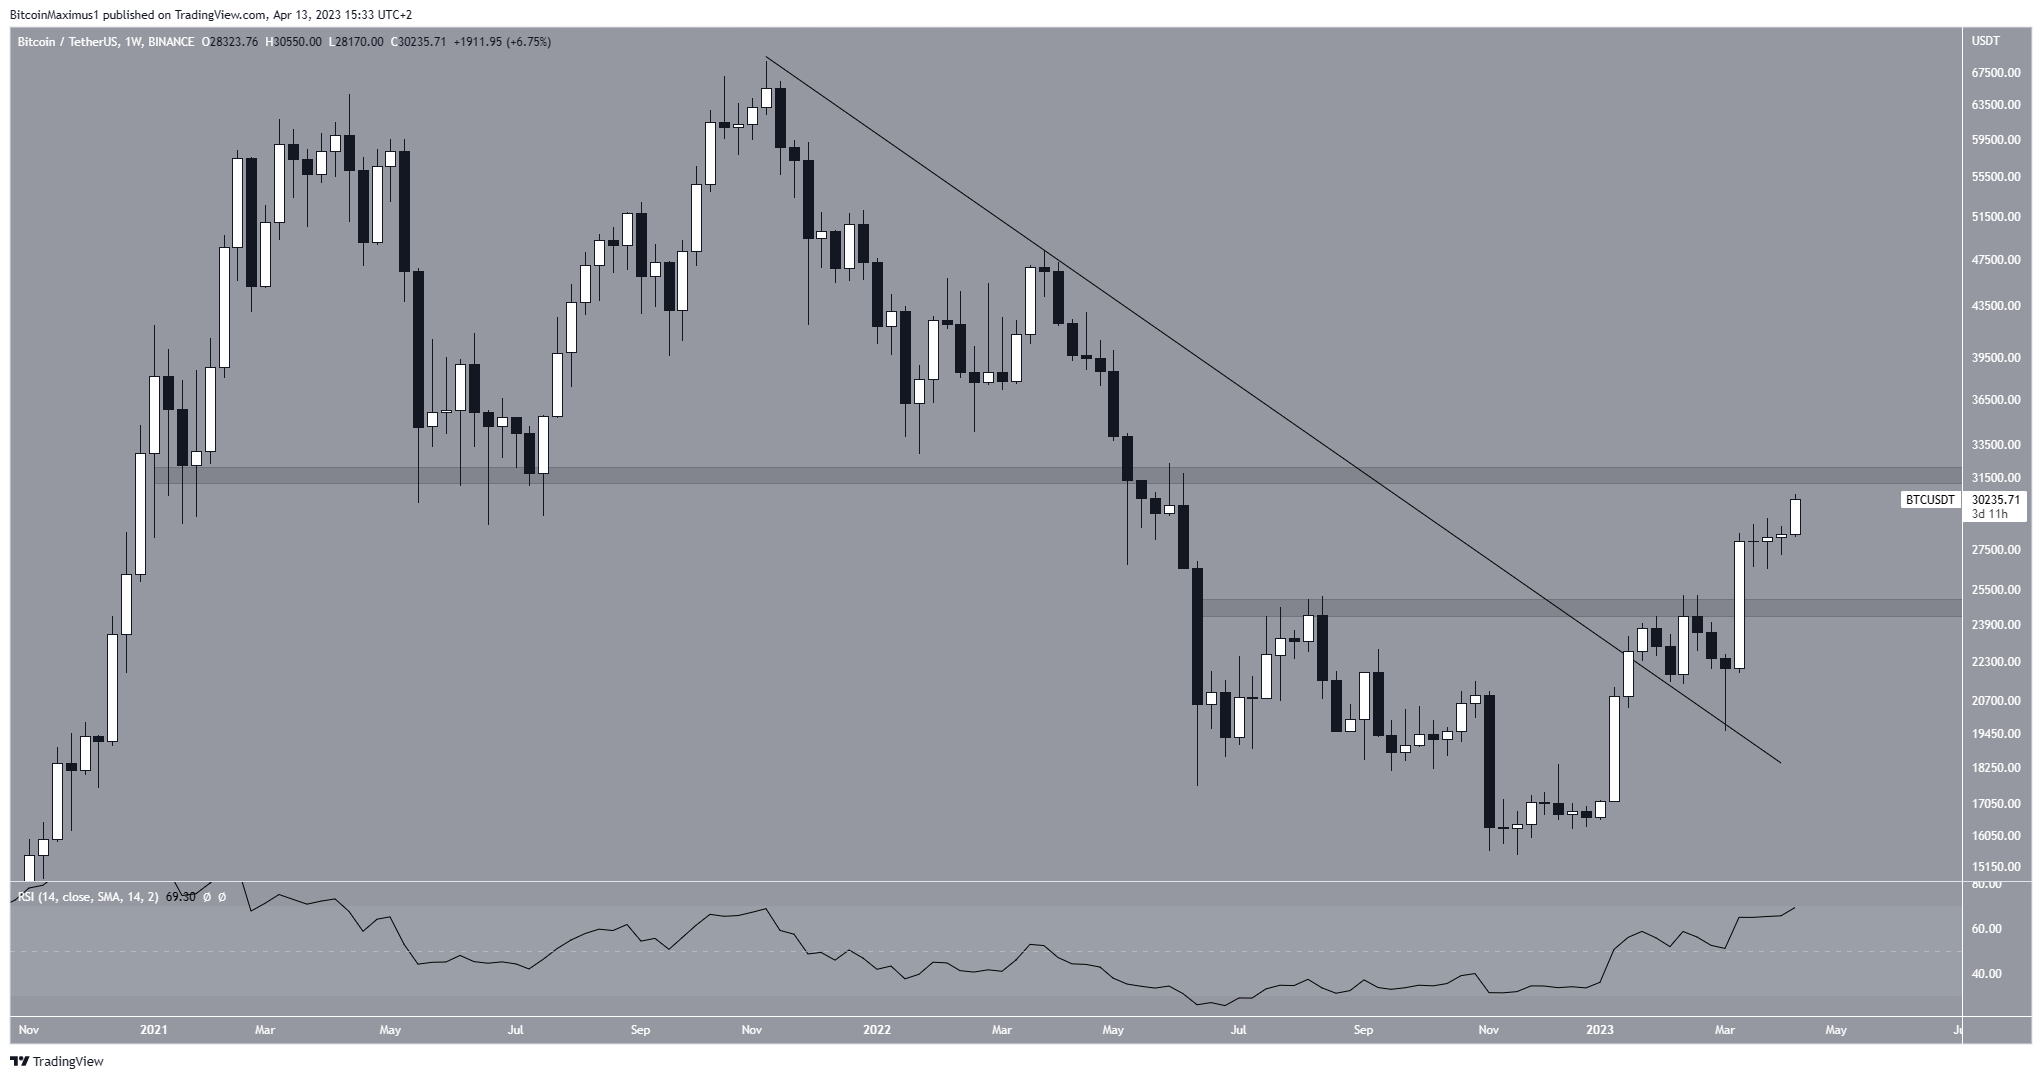
As a result, it seems probable that the price of Bitcoin will continue to rise towards its long-term resistance level of $31,700 soon. However, if it is unable to break through this level, there is a possibility that the digital currency may drop back down to $24,600.
How Long Will the Bitcoin (BTC) Price Breakout Continue?
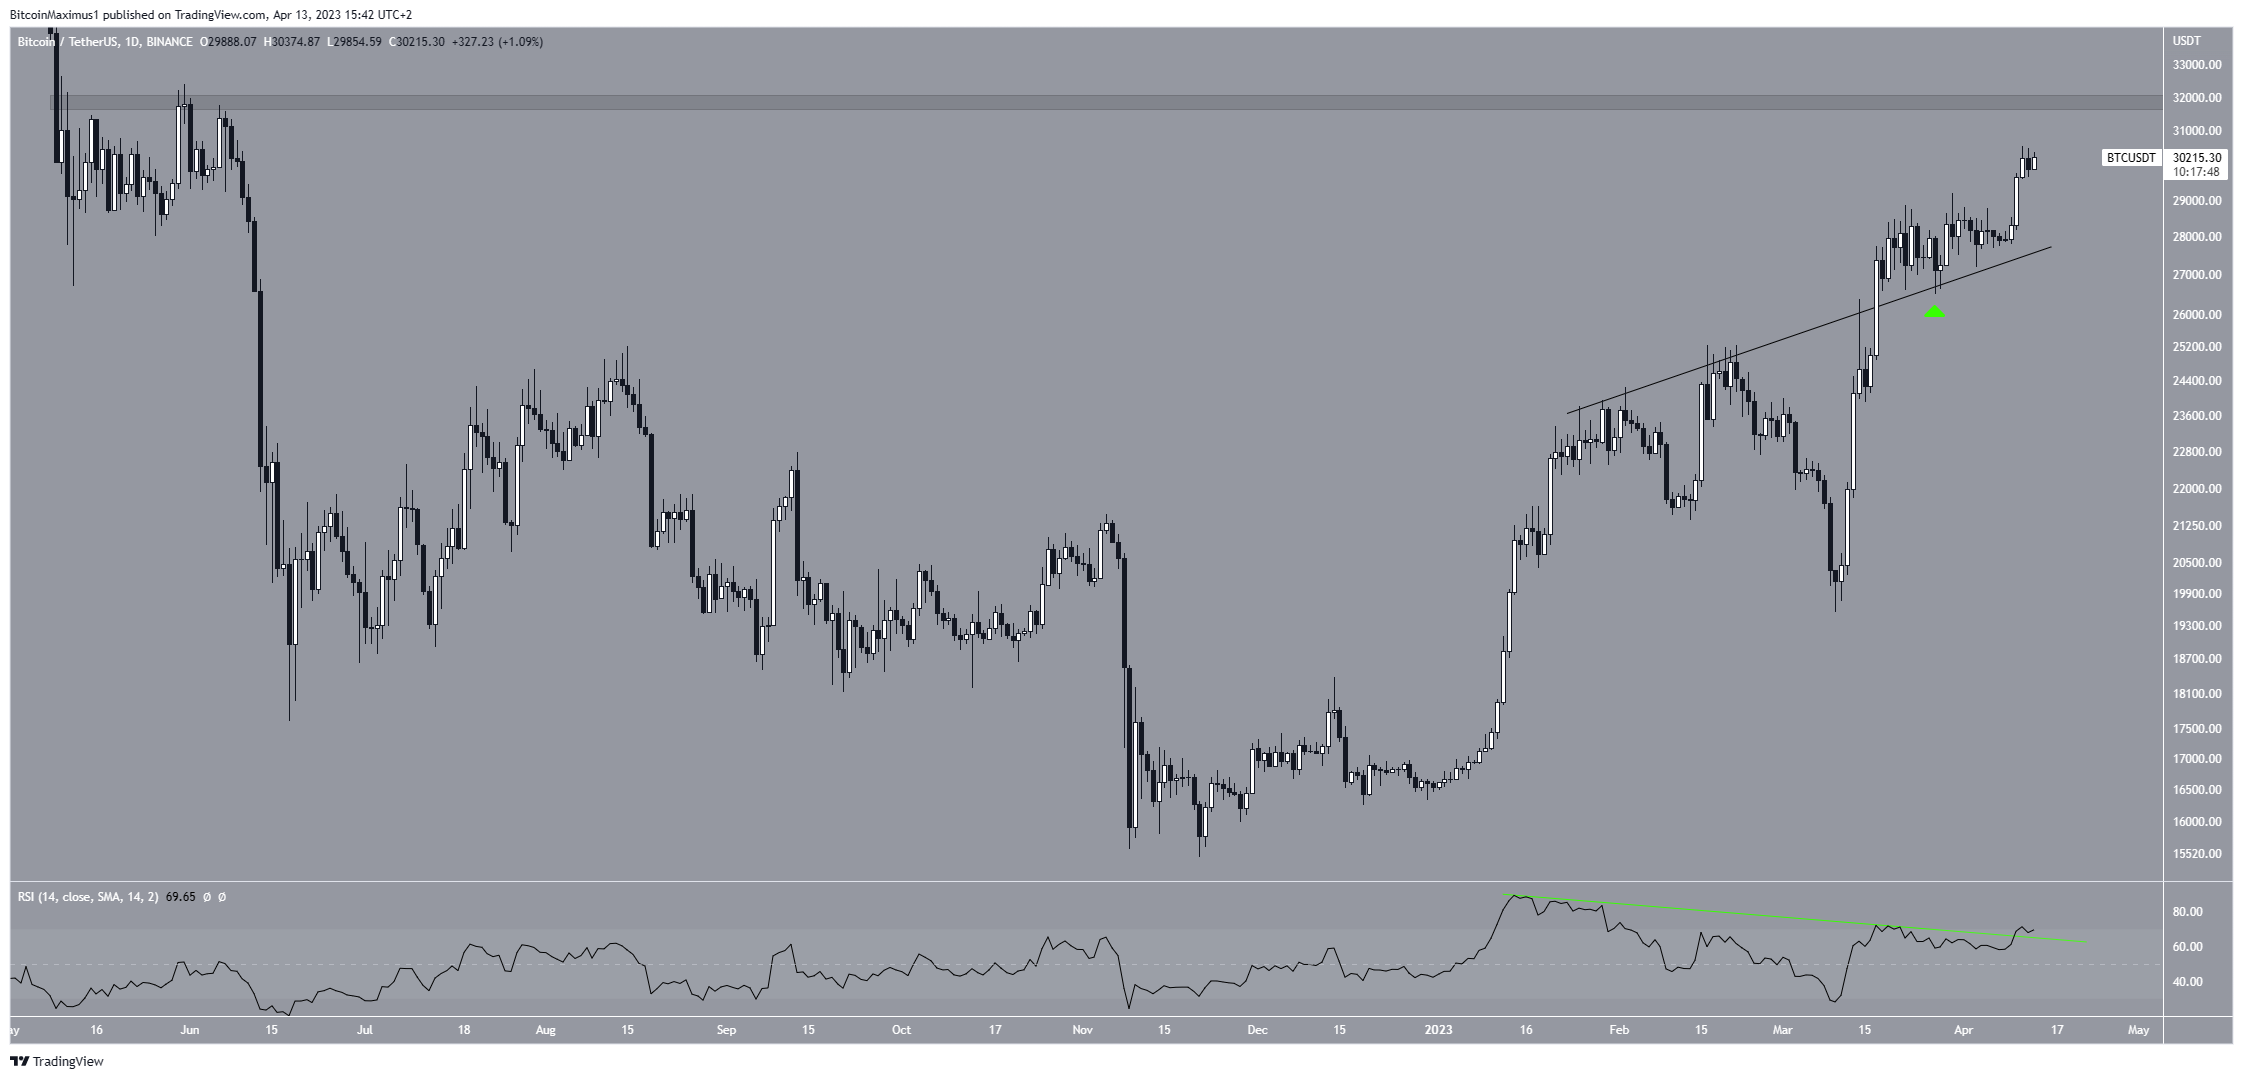
The analysis of Bitcoin’s daily time frame also gives a positive Bitcoin price forecast, with several indicators supporting this conclusion. One of the most significant indicators is the daily RSI movement, which is currently breaking out from a bearish divergence trendline (green), indicating that there is no bearish reversal in sight, and the BTC trend is bullish.
Furthermore, the price has broken through an ascending resistance line and confirmed it as support (green icon).
If the price increase continues, the nearest resistance area in the daily time frame is at an average price of $31,800. While this is the most likely future price scenario, a close below the ascending support line would invalidate this and could result in a decrease towards $25,000.
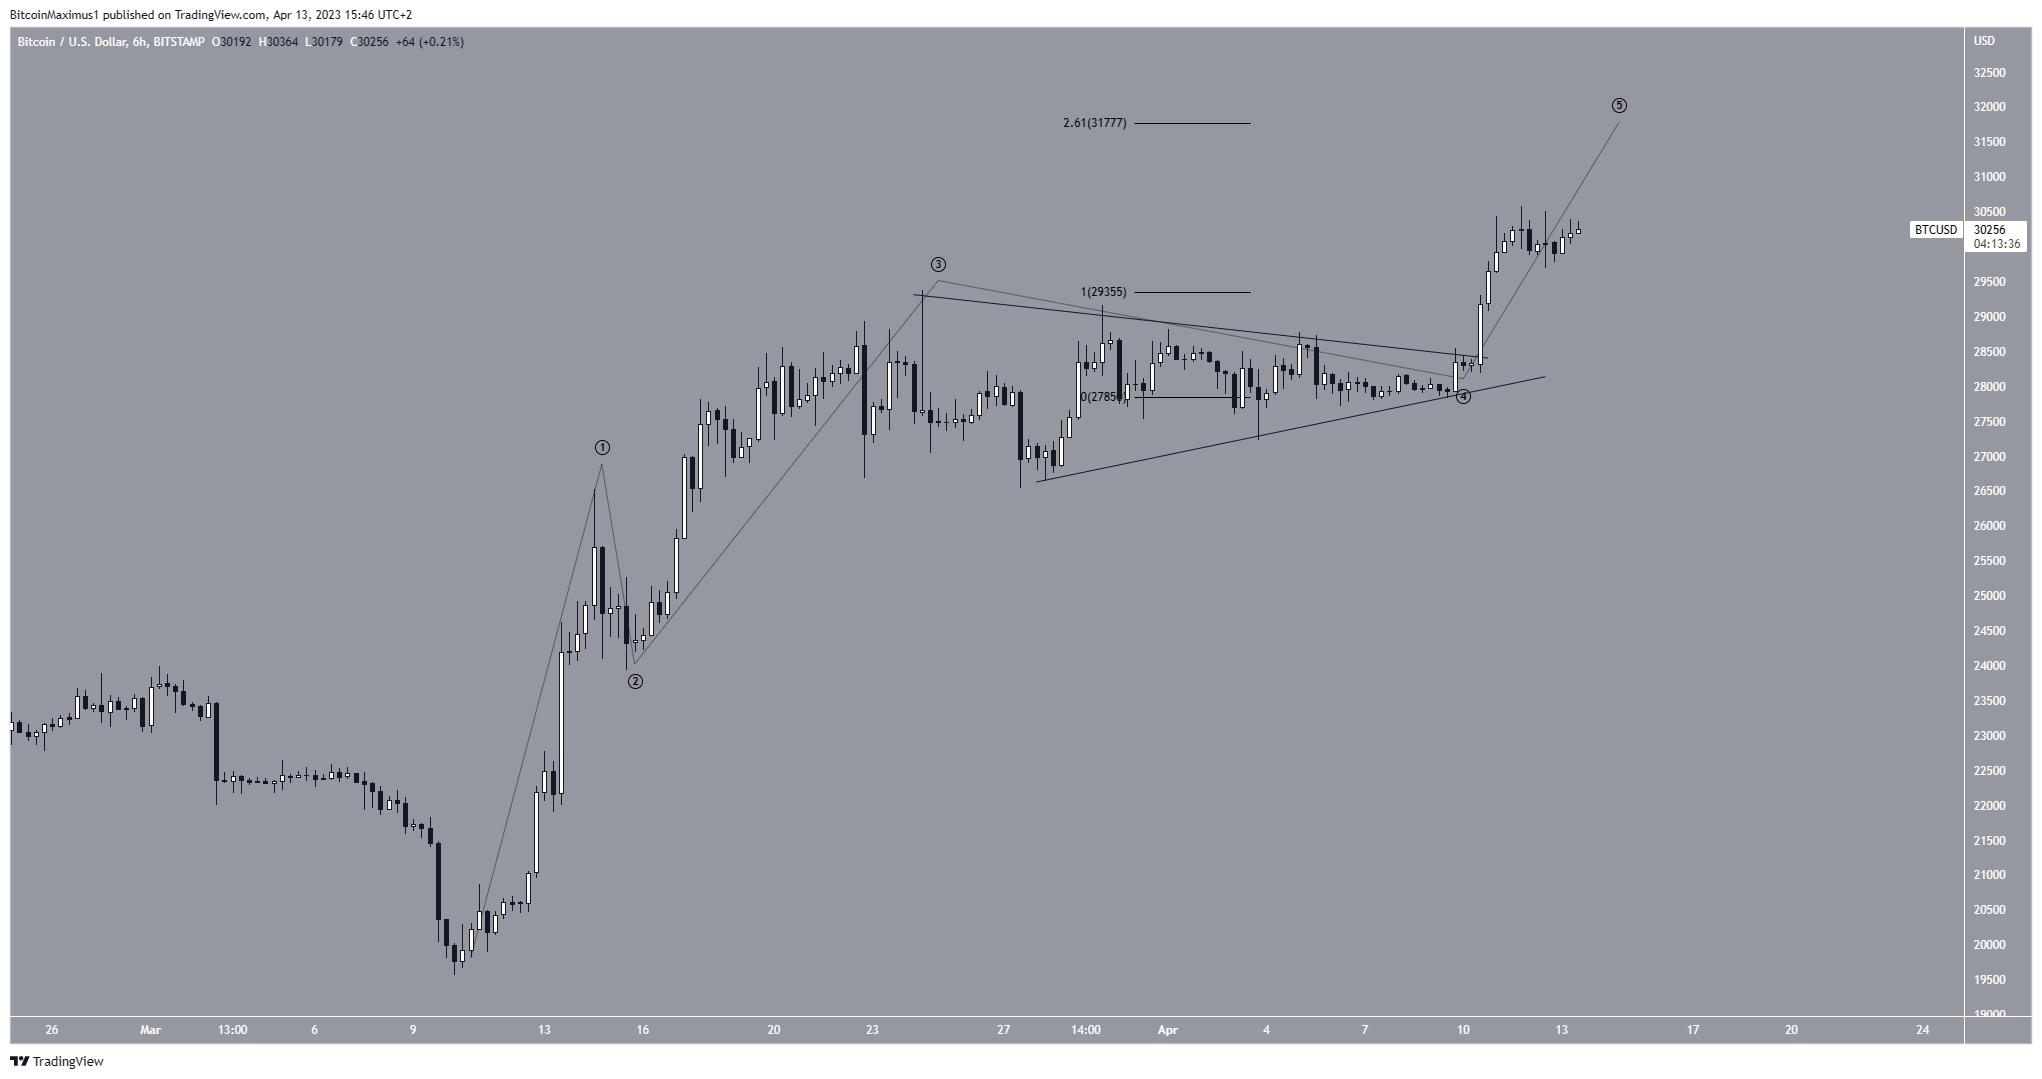
Finally, the short-term wave count also aligns with the upward movement. The BTC price is in the fifth and final wave of an increase that began on March 10. At the same time, it is unclear how this fits with the long-term count. However, the current increase is still ongoing.
The next most likely area for the price to reach a top would be at $31,777, found by the 2.61 external retracement of wave four. Since this is very close to the $31,700 resistance area, it has a high chance of acting as the top.
To conclude, the most likely Bitcoin price forecast is an increase toward $31,800. This would be invalidated by a close below the previous ascending support line, something that could trigger a drop toward $24,000-$25,000.


