


Bitcoin (BTC) is in a long-term bear market that has been ongoing since at least November 2021. The decline in the price of BTC has wrecked most portfolios, and many on-chain indicators have led to historic lows. Despite this, some data indicate that another brutal sell-off may be ahead.
Today’s on-chain analysis looks at several indicators that, on the one hand, suggest that the Bitcoin market today has record high investor confidence and low risk. So far, the $18,500-$19,000 area appears to be solid support and market participants believe it will deliver a bounce. However, on the other hand, there are reasons to believe that the declines are not over yet and a final, deeper sell-off is ahead.
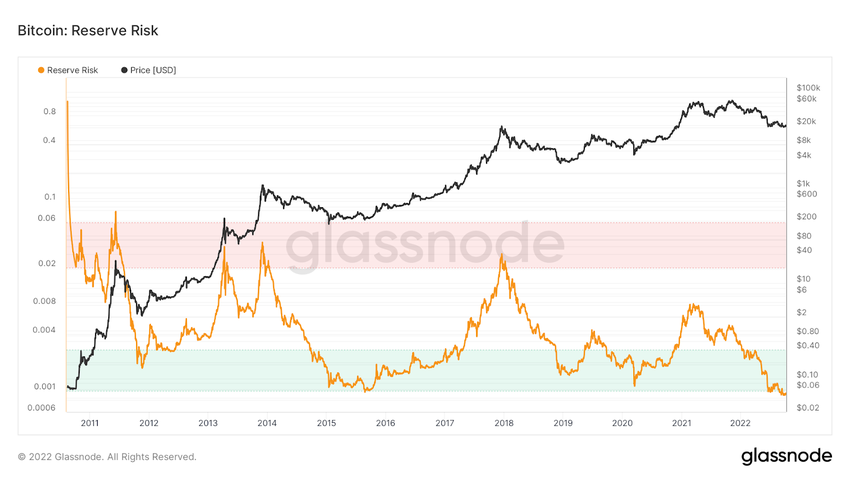
Reserve Risk – high investor confidence and low risk
Reserve Risk is defined as the price relative to the so-called HODL Bank. It is used to assess the confidence of long-term holders relative to the price of the native coin at a given time. When investor confidence is high and the price is low, there is an attractive risk/reward ratio. Reserve Risk is low. When confidence is low and the price is high, the risk/reward ratio is unattractive at that point. Then Reserve Risk is high.
On the long-term chart, we can see that in historical bear markets Reserve Risk reached lows in the green range between 0.0025 and 0.0001. In contrast, the historical all-time highs (ATH) of the Bitcoin price were correlated with the indicator’s peaks in the red range of 0.02-0.06.
Currently, Reserve Risk is hitting all-time lows (ATL) near 0.0009, an extreme low that falls below the green range and has never been seen before. The data suggests that the price of Bitcoin today is giving the best risk/reward ratio in history.
Another brutal sell-off?
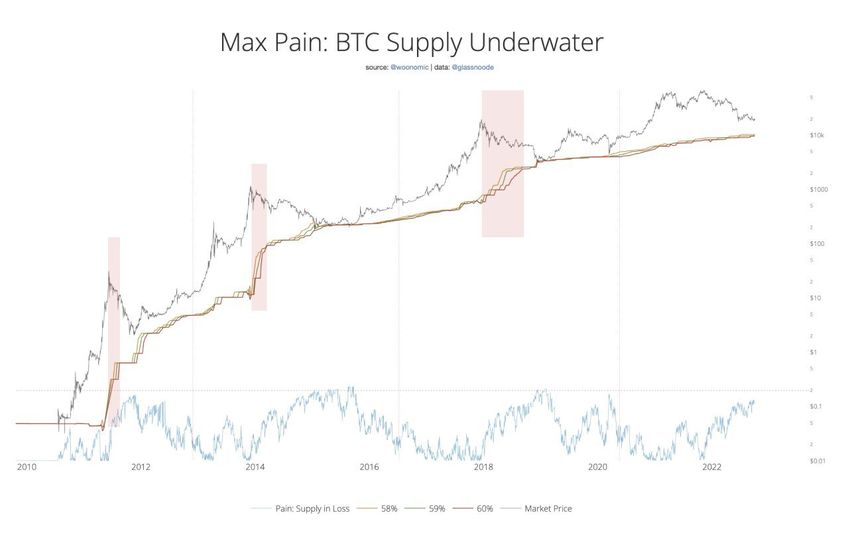
Despite definitely bullish readings from Reserve Risk, some analysts are still warning of the possibility of yet another brutal sell-off in the Bitcoin market. In a recent tweet from @woonomic, we see a chart of the maximum pain expressed in the percentage of BTC supply underwater (recording a loss).
The famous analyst marked (in red) the periods when long-term hodlers and whales dumped their coins on the bleeding market. In all previous cycles, they correlated with the first phases of bear markets. The exception on the chart is the current cycle, which does not see this kind of surge of supply in losses at the beginning of a downturn.
Willy Woo admits that the behavior of hodlers and whales is different in this cycle. He says that the explanation for this phenomenon is that their activity has shifted to the futures markets, which do not translate into the on-chain activity of the Bitcoin network. However, if another deep sell-off were to happen, according to Woo’s chart, support is near $10,000 today.
All in the hands of whales
Another possibility can be found by looking through the on-chain activity of Bitcoin whales, which hold more than 10,000 BTC. Their numbers are very small, ranging from 81-125 since 2013.
Despite this, one can see some fractal similarities between the chart of the largest whales from the 2017-2019 cycle and the current one. While the price of Bitcoin was surging in 2016-17 and 2020-21, the whales gradually declined. On the other hand, after the BTC price peaked, the whales started accumulating again (red and green arrows).
Addresses holding more than 10,000 BTC were increasing in bear markets. As a result, in both cases, they reached the level before the start of the phase of dynamic increases (blue line).
However, the biggest difference appears at the end of this fractal, when there was a dramatic drop in the number of whales between November and December 2018 (purple area). This correlated with the plunge of the Bitcoin price from its long-term support near $6500. The drop of more than 50% led to the absolute low of the previous cycle at $3150.
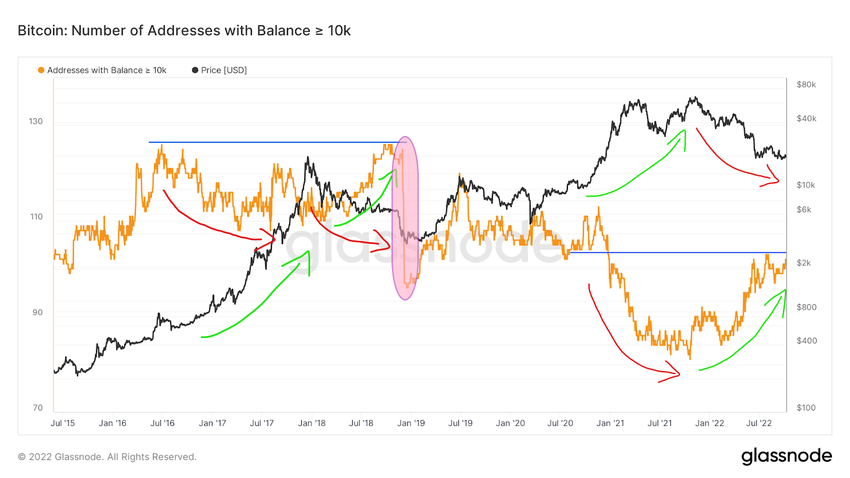
On the current Bitcoin chart, a similar drop of about 40% happened in early June 2022. However, it was not correlated with the sell-off of whales, whose number remained at the same level.
If the scenario of late 2018 were to repeat itself now, a brutal whale sell-off could drive the price to the $10,000 area. This would remain in confluence with the long-term chart of max pain from Willy Woo.
For Be[In]Crypto’s latest Bitcoin (BTC) analysis, click here.


